
Recommended
Recommended
More Related Content
What's hot
What's hot (20)
Viewers also liked
Viewers also liked (6)
Similar to Genetic variability in the macaw palm germplasm accessions revealed by microsatellite markers fekadu final
Similar to Genetic variability in the macaw palm germplasm accessions revealed by microsatellite markers fekadu final (20)
Recently uploaded
Recently uploaded (20)
Genetic variability in the macaw palm germplasm accessions revealed by microsatellite markers fekadu final
- 1. GENETIC VARIABILITY IN THE MACAW PALM GERMPLASM ACCESSIONS 1 REVEALED BY MICROSATELLITE MARKERS 2 3 FEKADU GEBRETENSAY MENGEISTU1; SÉRGIO YOSHIMITSU MOTOIKE1; KACILDA 4 NAOMI KUKI1; TELMA FALLIERI NASCIMENTO QUEIROZ1 5 INTRODUCTION 6 The macaw palm (Acrocomia aculeata (Jacq.) Lood. ex Mart.), is a perennial, fruit-producing 7 palm-tree native to tropical forests, and widely distributed throughout Central and South America. In 8 Brazil, it mainly occurs in the states of Ceará, Minas Gerais, Mato Grosso, Mato Grosso do Sul and São 9 Paulo (SCARIOT et al., 1995). Its fruits constitute a potential source of oil for the cosmetic industry 10 and as feedstock biofuel. According to Teixeira (2005), macaw palm can yield between 1500-5000 kg 11 of oil per hectare, which makes the species with great potential for production of biodiesel. It is 12 amongst others economically important flora of Brazilian savannah with great genetic variability in 13 natural populations. However, this variability has been threatened by predatory extractivism, 14 unsustainable land use and climate change (FALEIRO et al., 2008). Hence, characterization of 15 accessions maintained in a collection and examination of the genetic relationship between them is a key 16 for the sustainable conservation and increased use of the genetic resources. Germplasm characterization 17 using microsatellites or simple sequence repeats (SSR) markers has experienced a great development 18 and are well known for its potentially high information content and versatility as molecular tools 19 (FERREIRA, 2005). The present work was therefore carried out to assess and quantify the extent of 20 genetic variability in the macaw palm germplasm accessions conserved in a germplasm bank using 21 microsatellite molecular markers. 22 23 MATERIALS AND METHODS 24 Fourty five macaw family of half-sibs were used in this study from Araponga germplasm bank, 25 (BAG - Macauba) which is situated in the experimental farm of the Federal University of Viçosa in 26 Araponga-Minas Gerais. Collections were originally made from six states of Brasil including Minas 27 Gerais (25), Sao Paulo (6), Mato-Grosso do Sul (11), Para (1), Paraiba (1) and Pernambuco (1). A total 28 of 196 individuals were evaluated with a maximum of 5 individuals randomly selected from each 29 family. Leaf tissues were collected, stored under -80 0C, lyophilized for 72 hours and grounded in 30 liquid nitrogen and DNA was extracted following CTAB (Cetyl Tri-methyl Ammonium Bromide) 31 1 Univerisade Federal de Viçosa, e-mails: fgebretensay@yahoo.com; motoike@ufv.br; naomikuki@hotmail.com; fallieri@yahoo.com.br
- 2. method. PCR was performed in 20 μL of total reaction volume containing 30 ng of genomic DNA; 32 1xPCR buffer; 250 μM of each dNTPs; 0.15 μM of forward primer and 0.15 μM of reverse primer; 3 33 mM of MgCl2; and 1U of Taq DNA polymerase. Eight microsatellite loci including Aacu07, Aacu10, 34 Aacu12, Aacu18, Aacu26, Aacu30 and Aacu32 developed and characterized by Nucci et al. (2008) and 35 one additional locus (Aacu45) selected from Nucci (2007) were used in the study. The amplification 36 cycles were carried out in a thermal cycler (Applied Biosystem) programmed at initial denaturing step 37 at 94 oC for 5 minutes followed by 30 cycles of 1 minute denaturation at 94 oC; 1 minute primer-38 specific annealing temperature at 56 oC and primer elongation at 72 oC for 1 minute and final 5 minutes 39 extension at 72 oC. PCR amplified products were run in 6% polyacrylamide gel electrophoresis in 1x 40 TBE buffer, and stained with silver nitrate. Only clear and unambiguous SSR alleles were scored to the 41 corresponding band among the genotypes. Allelic data were subjected to analysis using GenAlex 42 (Version 6.2) and GENES (Version 2011.9.0), while Analysis of Molecular Variance (AMOVA), and 43 Principal Coordinate Analysis (PCA) were used to show the result of the study. 44 45 RESULTS AND DISCUSSION 46 A total of 45 alleles at six loci (average of 7.5 alleles per locus) ranging from 5 (Aacu45) to a 47 maximum of 11 alleles (Aacu12) were observed. Locus Aacu12 showed the highest observed 48 heterozygosity, Ho (0.541) while Aacu26 presented the lowest (0.304). The highest (0.715) and lowest 49 (0.441) expected heterozygosity (He) were presented by locus Aacu12 and Aacu45 respectively. 50 Higher genetic variation was found among families than within families. About 54 % of the variance 51 was explained by the genetic variation among the families and the rest 46 % was attributed to the 52 variation within families (Table 1). 53 Table 1. AMOVA among and within 43 families of macaw germplasm accessions collected from six 54 states of of Brasil. 55 56 On average 2.42 (SE=0.07) different alleles with a range of 1.3 to 3.5 per family have got allelic 57 frequency more than or equal to 0.5 while the average percentage of polymorphic loci across families is 58 80.23 % (SE=2.84 %). Consequently, high variation in heterozygosity was observed among families of 59 macaw accessions with a range of 0.125 to 0.593 with average value of 0.385 (SE=0.107). Four distinct 60 groups of families were formed by the PCA in which one group was formed by families from the 61 Source of variation df SS MS Variance Percent Among families 42 860.970 20.499 3.799 54.0 Within families 153 489.183 3.197 3.197 46.0 Total 195 1350.153 6.996 100.0
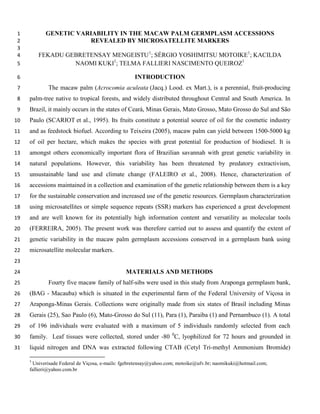
- 3. North, South, East, West and Central Minas; the second was composed of families from the state of 62 Para, Pernambuco and Paraiba, while the third and the fourth were formed by families from São Paulo 63 and Mato Grosso do Sul respectively (Figure 1). 64 65 Figure 1. PCA of group of macaw germplasm accessions based on their source of geographical 66 origins. (MS=Mato Grosso do Sul), SP=São Paulo, PAB=Paraiba, PA=Para, PE=Pernambuco, 67 NM=North Minas, SM=South Minas, CM=Central Minas, EM=East Minas, and WM=West 68 Minas). 69 70 Single data analysis for the state of Minas Gerais accessions showed the majority (81%) of the 71 variability is within the families and the remaining 19 % among them (Table 2). 72 Table 2. AMOVA among and within families of macaw germplasm accessions collected from Minas 73 Gerais state. 74 75 Source of variation df SS MS Variance Percent Among families 4 145.004 36.251 1.255 19.0 Within families 118 648.354 5.495 5.495 81.0 Total 122 793.358 6.749 100.0 76 This result is in accordance with a previous work by Oliveira et al. (2012) in that 17.2 % of 77 genetic variability occurred among populations and 82.8% within populations of macaw collections 78 from the Northern Minas Gerais. Colombo et al. (2013) explained that the species has mixed mating 79 behavior and has greater genetic diversity within than among populations, suggesting an involvement 80 of metapopulation structure, indicating that the populations studied underwent genetic drift due to 81 anthropization and have restricted gene flow. 82 83
- 4. CONCLUSIONS 84 It is possible to draw a conclusion from the result that, the higher genetic variation observed 85 was among the families originated from the six different states, which gives a clue to have high 86 consideration to conserve the genetic variability among families with respect to their geographical 87 origins. However, in the state of Minas, which shares more than 60% of the collection, within family 88 variation was higher and consequently, there is a need to have conservation work to maintain the 89 genetic variability within the accessions in the germplasm bank to facilitate for the processes of pre-90 breeding and selection. 91 92 REFERENCES 93 94 COLOMBO C.A., NUCCI S.M., PRIOLLI REGINA H.G., ZUCCHI M.I., CARVALHO C.R.L., 95 CHORFI BERTON L.H., SIQUEIRA W.G., AZEVEDO-FILHO J.A. Genetic Diversity of Macaw 96 Palm (Acrocomia aculeata) by Microsatellite Markers In: International Plant and Animal Genome 97 Conference, 2013, San Diego, CA. January 16, 2013. Available in: < http://www.intlpag.org/> . 98 Accessed in 07.10.2013. 99 100 FALEIRO F.G., COSTA A.M., KARIA C.T., ANDRADE R.P., JUNQUEIRA N.T.V., PEREIRA 101 A.V., PEREIRA E.B., SANO S.M. Molecular markers and geographic information systems as a tool to 102 study native plant species in the Brasilian Savannas: Simpósio International Savanas Tropicais, II, 103 2008, Parlamundi, Brasilia. Available in <http://www.cpac.embrapa.br/>. Accessed in 20.07.2012. 104 105 FERREIRA M.E. Molecular Analysis of Gene banks for sustainable conservation and increased use of 106 crop genetic resources. 2005, Villa Gualino, Turin, Italy.The role of biotechnology. Available in: 107 <http://www.fao.org/biotech/>. Accessed in 05.04.2012. 108 109 NUCCI S.M. Desenvolvimento, caracterização e analise da utilidade de marcadores microsatellites em 110 genética de população de macaúba. p.82. Dissertação do grau de Mestre em Área de Genética, 111 Melhoramento Vegetal e Biotecnologia. Instituto Agronomico, curso de Pós-Graduaçao em Agricultura 112 Tropical e Subtropical. Campinas, SP. 2007. 113 114 NUCCI S.M., AZEVEDO-FILHO A., COLOMBO A.C., PRIOLLI G.H.R., COELHO M.R., 115 MATA T.L., ZUCCHI I.M., Development and characterization of microsatellites markers from the 116 macaw.Blackwell, UK. Molecular Ecology Resources (2008) 8, 224-226. 117 118 OLIVEIRA D.A, JÚNIOR MELO A.F, BRANDÃO M.M., RODRIGUES L.A, MENEZES E.V, 119 AND FERREIRA P.R.B. Genetic diversity in populations of Acrocomia aculeate (Arecaceae) in the 120 northern region of Minas Gerais, Genetics and Molecular Research 11 (1): 531-538 (2012). 121 122 SCARIOT A.O, LLERAS E and HAY J.D. Flowering and fruiting phenologies of the palm Acrocomia 123 aculeata: patterns and consequences. Biotropica (1995) 27:168-173. 124 125 TEIXEIRA L.C. Potencialidades de oleaginosas para produção de biodiesel. Informe Agropecuário, v. 126 26, n. 229, p. 18-27, 2005 127 128