The study examines rural land rental markets in Malawi and Zambia, focusing on their trends, participation, and implications for household welfare. Findings indicate that land rental markets are more active in Malawi, driven by necessity, with growing participation resulting in both efficiency and equity gains. The research highlights the differences in welfare impacts, with Malawi showing positive benefits from renting in and concerns regarding distress rentals from renting out.
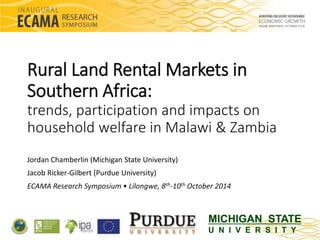


![Household model: participation
• Rental regime decision: ordered probit
푇푒푛푎푛푡
푟푖푡
퐴푢푡푎푟푘푦
푟푖푡
퐿푎푛푑푙표푟푑
푟푖푡
= 푓 푖 , 퐴 푖푡, 풙푖푡
• Rental amount decision (ha): tobit
푃 = 푓 , 퐴 푖푡 , 풙푖푡 , P ∈ [푇, 퐿]
푅푖푡
7
• Ability: from Cobb-Douglass production function:
log(푄푖푡 ) = log(풙푖푡 )휷 + 푢푖 + 휀푖푡
we recover 푎푏푖푙푖푡푦푖 = 푢 푖 from FE estimation
Rents in
Rents out
푎푏푖푙푖푡푦푖
푎푏푖푙푖푡푦푖
Jin & Jayne 2013](https://image.slidesharecdn.com/ecamachamberlin-141016052742-conversion-gate01/85/What-are-the-Drivers-of-Rural-Land-Rental-Markets-in-sub-Saharan-Africa-and-how-do-they-Impact-Household-Welfare-Evidence-from-Malawi-and-Zambia-by-Jordan-Chamberlin-7-320.jpg)


![Welfare impacts: Malawi [2]
20
Tenant (=1)
Landlord (=1)
Ha rented in
Ha rented out
Number of months
staples expected to last
(9) (10)
0.39***
(0.009)
0.13
(0.567)
0.543**
(0.025)
0.537**
(0.020)
Subjective wellbeing
(score: 1-5)
(11) (12)
0.65***
(0.000)
-0.36
(0.146)
0.33***
(0.003)
0.016
(0.826)
Probability of
poverty
(13) (14)
-0.11***
(0.006)
0.10***
(0.000)
-0.07***
(0.000)
0.02
(0.355)](https://image.slidesharecdn.com/ecamachamberlin-141016052742-conversion-gate01/85/What-are-the-Drivers-of-Rural-Land-Rental-Markets-in-sub-Saharan-Africa-and-how-do-they-Impact-Household-Welfare-Evidence-from-Malawi-and-Zambia-by-Jordan-Chamberlin-20-320.jpg)


