posco futurem 003670 Algorithm Investment Report
•
0 likes•4 views

posco futurem 003670 Algorithm Investment Report
![[Price for scheduled purchasing]
Arbitrarily made
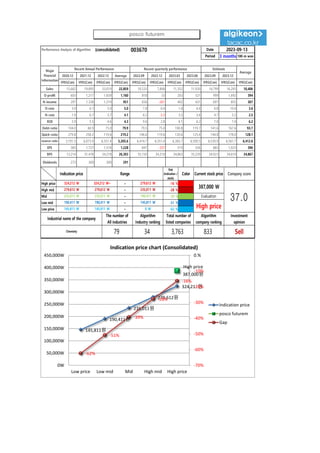
Algorithm stocks Trading Strategies (consolidated) 003670 Date
Period
Gap
(Indication /
stock)
Color
2023-09-13
3 months
Current stock price Evaluation
Stock price rise
probability score
Investment opinion Prospective purchase amount
387,000 W High price 45.2 Sell 2,000,000 W
Suggested Purchase
Amount 471,474 W
Number of stocks
purchased 1
Indication price Range Buying / Selling Buying / Selling [Stocks]
High price 324,212 W 324,212 W~ ~ 279,612 W -16 % 76,493 W 0
High mid 279,612 W 279,612 W ~ 235,011 W -28 % 130,829 W 0
Mid 235,011 W 235,011 W ~ 190,411 W -39 % 185,165 W 1
Low mid 190,411 W 190,411 W ~ 145,811 W -51 % 239,500 W 1
low price 145,811 W 145,811 W ~ 0 W -62 % 293,836 W 2
Stock price rise
probability score
A Sector 46.4 44.9 50.1 52.3 45.7 49.7
45.2
B Sector 37.1 26.7 33.8 52.3 16.3 57.5
Total average
2023.04.19 2023.05.19 2023.06.20 2023.07.18 2023.08.16 2023.09.13
41.7 35.8 41.9 38.3 31.0 53.6
-24 % 42 %
2023.05.19 2023.06.20 2023.07.18 2023.08.16 2023.09.13
Total of
increase rate
Total score
A Sector -3 % 10 % 4 % -14 % 8 %
1 % 49.3
B Sector -39 % 21 % 35 % -222 % 72 %
Total average -17 % 15 % -9 %
46 45
50 52
46
50
37
27
34
52
16
58
42
36
42
38
31
54
0
10
20
30
40
50
60
70
2023.04.19 2023.05.19 2023.06.20 2023.07.18 2023.08.16 2023.09.13
Stock price rise probability score
A sector
B sector
Total average
-3%
10% 4%
-14%
8%
-39%
21%
35%
-222%
72%
-17%
15%
-9%
-24%
42%
-250%
-200%
-150%
-100%
-50%
0%
50%
100%
2023.05.19 2023.06.20 2023.07.18 2023.08.16 2023.09.13
Increase rate of stock price rise
A sector
B sector
Total average
posco futurem](data:image/gif;base64,R0lGODlhAQABAIAAAAAAAP///yH5BAEAAAAALAAAAAABAAEAAAIBRAA7)
Recommended
Recommended
More Related Content
Similar to posco futurem 003670 Algorithm Investment Report
Similar to posco futurem 003670 Algorithm Investment Report (20)
More from 알고리즘 기업분석 컨설팅-알기컨,algikeon
More from 알고리즘 기업분석 컨설팅-알기컨,algikeon (20)
Recently uploaded
Recently uploaded (20)
posco futurem 003670 Algorithm Investment Report
- 1. Performance Analysis of Algorithm (consolidated) 003670 Date Period 3 months 100-m won 2020.12 2021.12 2022.12 Average 2022.09 2022.12 2023.03 2023.06 2023.09 2023.12 IFRS(Con) IFRS(Con) IFRS(Con) IFRS(Con) IFRS(Con) IFRS(Con) IFRS(Con) IFRS(Con) IFRS(Con) IFRS(Con) IFRS(Con) Sales 15,662 19,895 33,019 22,859 10,533 7,808 11,352 11,930 14,799 16,293 10,406 O-profit 603 1,217 1,659 1,160 818 33 203 521 999 1,692 394 N-income 297 1,338 1,219 951 656 -261 402 431 697 855 307 O-rate 3.9 6.1 5.0 5.0 7.8 0.4 1.8 4.4 6.8 10.4 3.6 N-rate 1.9 6.7 3.7 4.1 6.2 -3.3 3.5 3.6 4.7 5.2 2.5 ROE 2.9 5.5 4.6 4.3 9.6 2.8 6.1 6.2 7.0 7.4 6.2 Debt-ratio 104.0 60.9 75.0 79.9 79.5 75.0 100.8 119.7 141.6 167.6 93.7 Quick-ratio 279.8 258.2 119.6 219.2 146.6 119.6 120.6 125.4 144.8 178.0 128.1 reserve-ratio 3,191.5 6,073.9 6,351.4 5,205.6 6,414.7 6,351.4 6,383.7 6,500.5 6,530.9 6,561.7 6,412.6 EPS 383 1,727 1,574 1,228 847 -337 519 556 883 1,023 396 BPS 13,214 31,478 34,218 26,303 35,150 34,218 34,863 35,239 34,923 34,610 34,867 Dividends 273 300 300 291 2023-09-13 Major Financial Information Recent Annual Performance Recent quarterly performance Estimate Average Gap (Indication / stock) Color High price ~ -16 % High mid ~ -28 % Mid ~ -39 % Low mid ~ -51 % Low price ~ -62 % Indication price Range Current stock price Company score 279,612 W 279,612 W 235,011 W 235,011 W 235,011 W 190,411 W Evaluation 324,212 W 324,212 W~ 279,612 W 387,000 W 37.0 190,411 W 190,411 W 145,811 W High price Sell 145,811 W 145,811 W 0 W Industrial name of the company The number of All industries Algorithm Industry ranking Total number of listed companies Algorithm company ranking Investment opinion Chemistry 79 34 3,763 833 145,811원 190,411원 235,011원 279,612원 324,212원 High price 387,000원 -62% -51% -39% -28% -16% -70% -60% -50% -40% -30% -20% -10% 0.% 0W 50,000W 100,000W 150,000W 200,000W 250,000W 300,000W 350,000W 400,000W 450,000W Low price Low mid Mid High mid High price Indication price chart (Consolidated) Indication price posco futurem Gap posco futurem
- 2. [Price for scheduled purchasing] Arbitrarily made Algorithm stocks Trading Strategies (consolidated) 003670 Date Period Gap (Indication / stock) Color 2023-09-13 3 months Current stock price Evaluation Stock price rise probability score Investment opinion Prospective purchase amount 387,000 W High price 45.2 Sell 2,000,000 W Suggested Purchase Amount 471,474 W Number of stocks purchased 1 Indication price Range Buying / Selling Buying / Selling [Stocks] High price 324,212 W 324,212 W~ ~ 279,612 W -16 % 76,493 W 0 High mid 279,612 W 279,612 W ~ 235,011 W -28 % 130,829 W 0 Mid 235,011 W 235,011 W ~ 190,411 W -39 % 185,165 W 1 Low mid 190,411 W 190,411 W ~ 145,811 W -51 % 239,500 W 1 low price 145,811 W 145,811 W ~ 0 W -62 % 293,836 W 2 Stock price rise probability score A Sector 46.4 44.9 50.1 52.3 45.7 49.7 45.2 B Sector 37.1 26.7 33.8 52.3 16.3 57.5 Total average 2023.04.19 2023.05.19 2023.06.20 2023.07.18 2023.08.16 2023.09.13 41.7 35.8 41.9 38.3 31.0 53.6 -24 % 42 % 2023.05.19 2023.06.20 2023.07.18 2023.08.16 2023.09.13 Total of increase rate Total score A Sector -3 % 10 % 4 % -14 % 8 % 1 % 49.3 B Sector -39 % 21 % 35 % -222 % 72 % Total average -17 % 15 % -9 % 46 45 50 52 46 50 37 27 34 52 16 58 42 36 42 38 31 54 0 10 20 30 40 50 60 70 2023.04.19 2023.05.19 2023.06.20 2023.07.18 2023.08.16 2023.09.13 Stock price rise probability score A sector B sector Total average -3% 10% 4% -14% 8% -39% 21% 35% -222% 72% -17% 15% -9% -24% 42% -250% -200% -150% -100% -50% 0% 50% 100% 2023.05.19 2023.06.20 2023.07.18 2023.08.16 2023.09.13 Increase rate of stock price rise A sector B sector Total average posco futurem
- 3. 정보와 완전 정보 결 투자판단 있습니 위배 무단으 숙지하 Compliance notice ① The information provided by The Algorithm Company Analysis Consulting is obtained through reliable data and information and The Algorithm Company Analysis Program (TACAP), but its accuracy or completeness are not guaranteed. Furthermore, it may change over time.Therefore, we are not legally responsible for the results of the data provided by The Algorithm Company Analysis Consulting because of information errors or omissions. ② The Algorithm Company Analysis Consulting and all the information provided on it site are reference materials for investment decisions and the final responsibility of investment is up to users utilizing this information. ③ The Algorithm Company Analysis Consulting and its site do not do anything that violates the related laws such as discretionary transaction. ④ Users can not reallocate and recycle the information provided by The Algorithm Company Analysis Consulting firm let alone the information provided by its Site. ⑤ Be sure to know about application period of this algorithm analysis report in order to improve its accuracy. Tel : 070 - 4667 - 5009 Email : tacac@tacac.co.kr Homepage : tacac.co.kr Blog : tacac.blog.me SERVICES M&A, IPO, RECOVER, CORPORATE RESTRUCTURING, MANAGEMENT OF TECHNOLOGY, BUSINESS STRATEGY, FAMILY BUSINESS Request : http://tacac.co.kr/?page_id=1374 ① Consulting is o The Algorithm accuracy or com change over tim results of the d Consulting bec ② information pr investment dec up ③ do anything th transaction. ④ The Algorithm information pr ⑤ analysis report