Ncsoft 036570-Algorithm Analysis Report
•
1 like•138 views

This document provides a summary of financial performance and stock analysis for a company called Algorithm over several periods between 2014-2017. It includes tables with metrics like sales, operating profit, net income, debt ratios, EPS and stock prices. There are also charts showing the company's stock price rise probability scores and increase rates over time compared to sector averages. The document concludes with a compliance notice stating the information is for reference only and the analysis firm is not responsible for investment outcomes.
![[Price for scheduled purchasing]
Arbitrarily made
알기컨 >
tacac.co.kr
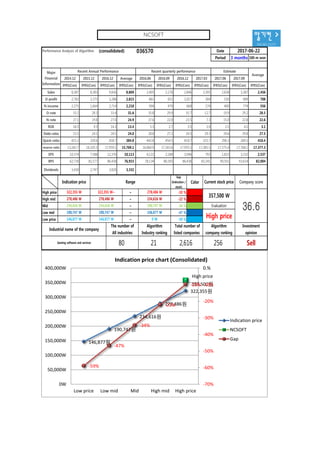
Algorithm stocks Trading Strategies (consolidated) 036570 Date
Period
Gap
(Indication /
stock)
Color
2017-06-22
3 months
Current stock price Evaluation
Stock price rise
probability score
Investment opinion Prospective purchase amount
357,500 W High price 31.8 Sell 2,500,000 W
Suggested Purchase
Amount 576,090 W
Number of stocks
purchased 2
Indication price Range Buying / Selling Buying / Selling [Stocks]
High price 322,355 W 322,355 W~ ~ 278,486 W -10 % 56,634 W 0
High mid 278,486 W 278,486 W ~ 234,616 W -22 % 127,327 W 0
Mid 234,616 W 234,616 W ~ 190,747 W -34 % 198,020 W 1
Low mid 190,747 W 190,747 W ~ 146,877 W -47 % 268,713 W 1
low price 146,877 W 146,877 W ~ 0 W -59 % 339,407 W 2
Stock price rise
probability score
A Sector 51.8 42.1 43.9 47.2 50.4 42.7
31.8B Sector 50.8 42.5 38.3 47.2 39.2 61.3
Total average
2017.01.20 2017.02.21 2017.03.22 2017.04.19 2017.05.23 2017.06.21
51.3 42.3 41.1 30.0 44.8 52.0
33 % 14 %
2017.02.21 2017.03.22 2017.04.19 2017.05.23 2017.06.21
Total of
increase rate
Total score
A Sector -23 % 4 % 7 % 6 % -18 %
-3 % 45.0B Sector -20 % -11 % 19 % -20 % 36 %
Total average -21 % -3 % -37 %
52
42 44
47
50
43
51
43
38
47
39
61
51
42 41
30
45
52
0
10
20
30
40
50
60
70
2017.01.20 2017.02.21 2017.03.22 2017.04.19 2017.05.23 2017.06.21
Stock price rise probability score
A sector
B sector
Total average
-23%
4% 7% 6%
-18%-20%
-11%
19%
-20%
36%
-21%
-3%
-37%
33%
14%
-60%
-40%
-20%
0%
20%
40%
2017.02.21 2017.03.22 2017.04.19 2017.05.23 2017.06.21
Increase rate of stock price rise
A sector
B sector
Total average
NCSOFT](data:image/gif;base64,R0lGODlhAQABAIAAAAAAAP///yH5BAEAAAAALAAAAAABAAEAAAIBRAA7)
Recommended
Recommended
More Related Content
What's hot
What's hot (20)
Similar to Ncsoft 036570-Algorithm Analysis Report
Similar to Ncsoft 036570-Algorithm Analysis Report (20)
More from 알고리즘 기업분석 컨설팅-알기컨,algikeon
More from 알고리즘 기업분석 컨설팅-알기컨,algikeon (20)
Recently uploaded
Recently uploaded (8)
Ncsoft 036570-Algorithm Analysis Report
- 1. 알기컨 > tacac.co.kr Performance Analysis of Algorithm (consolidated) 036570 Date Period 3 months 100-m won 2014.12 2015.12 2016.12 Average 2016.06 2016.09 2016.12 2017.03 2017.06 2017.09 IFRS(Con) IFRS(Con) IFRS(Con) IFRS(Con) IFRS(Con) IFRS(Con) IFRS(Con) IFRS(Con) IFRS(Con) IFRS(Con) IFRS(Con) Sales 8,387 8,383 9,836 8,869 2,405 2,176 2,846 2,395 2,658 3,387 2,456 O-profit 2,782 2,375 3,288 2,815 861 651 1,017 304 530 989 708 N-income 2,275 1,664 2,714 2,218 904 479 668 174 400 774 556 O-rate 33.2 28.3 33.4 31.6 35.8 29.9 35.7 12.7 19.9 29.2 28.5 N-rate 27.1 19.8 27.6 24.9 37.6 22.0 23.5 7.3 15.0 22.8 22.6 ROE 16.5 9.3 14.3 13.4 5.3 2.7 3.5 1.0 2.1 4.1 3.1 Debt-ratio 23.5 24.1 24.5 24.0 28.8 27.2 24.5 29.3 29.6 29.8 27.5 Quick-ratio 415.2 320.6 418.7 384.8 442.8 454.5 418.7 325.7 296.3 269.5 410.4 reserve-ratio 13,242.7 16,105.5 17,959.1 15,769.1 16,860.9 17,303.6 17,959.1 17,385.5 17,575.4 17,768.1 17,377.3 EPS 10,374 7,588 12,376 10,113 4,122 2,184 3,046 793 1,823 3,232 2,537 BPS 62,730 81,577 86,438 76,915 78,134 80,305 86,438 83,141 90,501 93,614 82,004 Dividends 3,430 2,747 3,820 3,332 2017-06-22 Major Financial Information Recent Annual Performance Recent quarterly performance Estimate Average Gap (Indication / stock) Color High price ~ -10 % High mid ~ -22 % Mid ~ -34 % Low mid ~ -47 % Low price ~ -59 % Indication price Range Current stock price Company score 278,486 W 278,486 W 234,616 W 234,616 W 234,616 W 190,747 W Evaluation 322,355 W 322,355 W~ 278,486 W 357,500 W 36.6190,747 W 190,747 W 146,877 W High price Sell 146,877 W 146,877 W 0 W Industrial name of the company The number of All industries Algorithm Industry ranking Total number of listed companies Algorithm company ranking Investment opinion Gaming software and services 80 21 2,616 256 146,877원 190,747원 234,616원 278,486원 322,355원 High price 357,500원 -59% -47% -34% -22% -10% -70% -60% -50% -40% -30% -20% -10% 0.% 0W 50,000W 100,000W 150,000W 200,000W 250,000W 300,000W 350,000W 400,000W Low price Low mid Mid High mid High price Indication price chart (Consolidated) Indication price NCSOFT Gap NCSOFT
- 2. [Price for scheduled purchasing] Arbitrarily made 알기컨 > tacac.co.kr Algorithm stocks Trading Strategies (consolidated) 036570 Date Period Gap (Indication / stock) Color 2017-06-22 3 months Current stock price Evaluation Stock price rise probability score Investment opinion Prospective purchase amount 357,500 W High price 31.8 Sell 2,500,000 W Suggested Purchase Amount 576,090 W Number of stocks purchased 2 Indication price Range Buying / Selling Buying / Selling [Stocks] High price 322,355 W 322,355 W~ ~ 278,486 W -10 % 56,634 W 0 High mid 278,486 W 278,486 W ~ 234,616 W -22 % 127,327 W 0 Mid 234,616 W 234,616 W ~ 190,747 W -34 % 198,020 W 1 Low mid 190,747 W 190,747 W ~ 146,877 W -47 % 268,713 W 1 low price 146,877 W 146,877 W ~ 0 W -59 % 339,407 W 2 Stock price rise probability score A Sector 51.8 42.1 43.9 47.2 50.4 42.7 31.8B Sector 50.8 42.5 38.3 47.2 39.2 61.3 Total average 2017.01.20 2017.02.21 2017.03.22 2017.04.19 2017.05.23 2017.06.21 51.3 42.3 41.1 30.0 44.8 52.0 33 % 14 % 2017.02.21 2017.03.22 2017.04.19 2017.05.23 2017.06.21 Total of increase rate Total score A Sector -23 % 4 % 7 % 6 % -18 % -3 % 45.0B Sector -20 % -11 % 19 % -20 % 36 % Total average -21 % -3 % -37 % 52 42 44 47 50 43 51 43 38 47 39 61 51 42 41 30 45 52 0 10 20 30 40 50 60 70 2017.01.20 2017.02.21 2017.03.22 2017.04.19 2017.05.23 2017.06.21 Stock price rise probability score A sector B sector Total average -23% 4% 7% 6% -18%-20% -11% 19% -20% 36% -21% -3% -37% 33% 14% -60% -40% -20% 0% 20% 40% 2017.02.21 2017.03.22 2017.04.19 2017.05.23 2017.06.21 Increase rate of stock price rise A sector B sector Total average NCSOFT
- 3. 알기컨 > tacac.co.kr 정보와 완전 정보 결 투자판단 있습니 위배 무단으 숙지하 Compliance notice ① The information provided by The Algorithm Company Analysis Consulting is obtained through reliable data and information and The Algorithm Company Analysis Program (TACAP), but its accuracy or completeness are not guaranteed. Furthermore, it may change over time.Therefore, we are not legally responsible for the results of the data provided by The Algorithm Company Analysis Consulting because of information errors or omissions. ② The Algorithm Company Analysis Consulting and all the information provided on it site are reference materials for investment decisions and the final responsibility of investment is up to users utilizing this information. ③ The Algorithm Company Analysis Consulting and its site do not do anything that violates the related laws such as discretionary transaction. ④ Users can not reallocate and recycle the information provided by The Algorithm Company Analysis Consulting firm let alone the information provided by its Site. ⑤ Be sure to know about application period of this algorithm analysis report in order to improve its accuracy. Tel : 070 - 4667 - 5009 Email : tacac@tacac.co.kr Homepage : tacac.co.kr Blog : tacac.blog.me Request : http://tacac.co.kr/?page_id=1374 ① Consulting The Algori accuracy o change ove results of Consulting ② informatio investmen up ③ do anythin transaction ④ The Algori informatio ⑤ analysis re