Download as PDF, PPTX
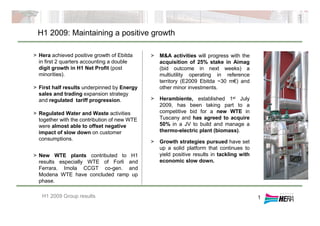
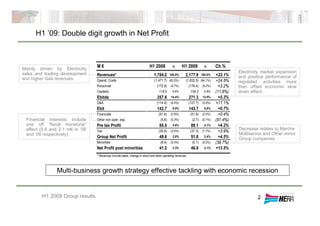

Hera achieved double digit growth in net profit in the first half of 2009, driven by expansion in electricity sales and trading as well as regulated tariff increases. Earnings were also supported by contributions from new waste-to-energy plants. Capex was on schedule to support growth strategies, while debt increased due to dividends, acquisitions, and working capital needs from higher sales. The company aims to continue profitable growth by leveraging its regulated utilities and pursuing new opportunities in waste and energy.


