Download as PDF, PPTX
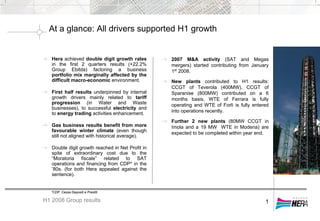
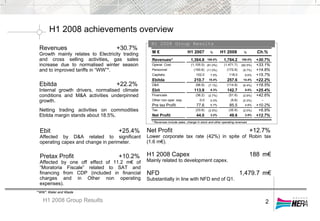
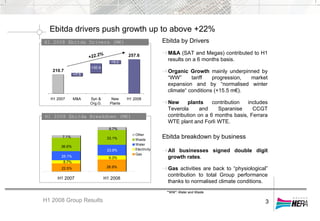
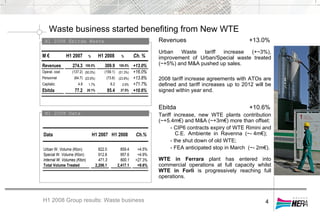
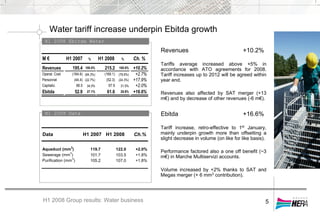
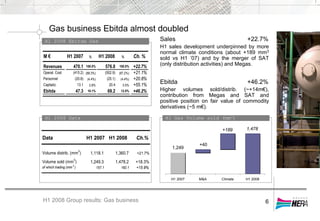
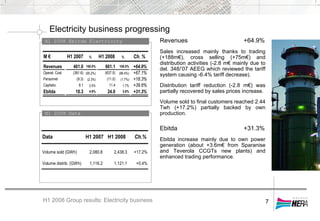
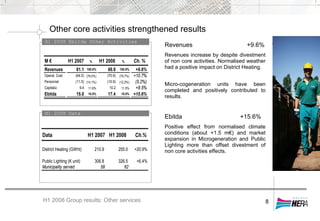
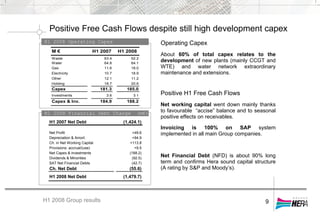

H1 2008 results saw double digit growth rates for Hera Group, with EBITDA up 22.2%. Growth was underpinned by internal drivers like tariff increases and new plants coming online, as well as M&A activity. All business lines experienced growth, with gas returning to normal contributions after a mild winter. Operating capex was high but still allowed for positive free cash flow. Net financial debt was substantially in line with Q1 levels.


