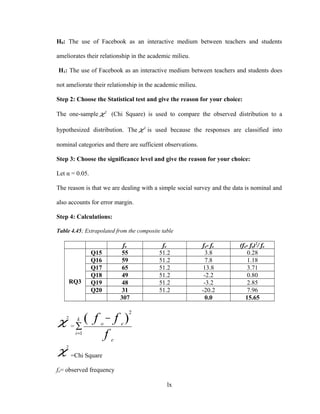
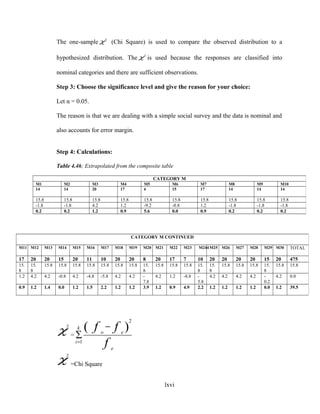
Download to read offline


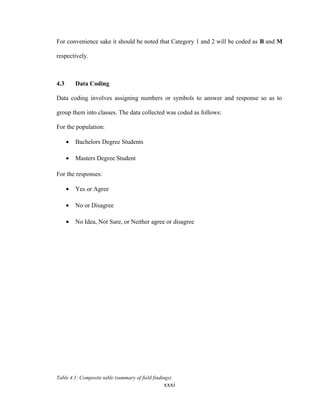
![Degree Students with an equal percentage. The option of answers given to respondents
was also classified into three groups. According to their degree of importance as follows:
- First class answers (Yes, Agree)
- Second class answers (No, Disagree)
- Third class answers (No idea, not sure or neither agree or disagree)
Therefore according to the data collected the test statistics requires the Goodness of fit
and the chi square distribution X2
to compare an observed set of frequencies to expected
set of frequencies.
(fo – fe)2
X2
= ∑ [ ]
fe
3.13.1 Descriptive Statistics
A descriptive statistical method is used to analyze data collected from the field. This is
because the study seeks to investigate, identify and to recommend the use of security best
practices in commercial communication companies in Cameroon.
After administering the questionnaires, descriptive statistics is applied for better
understanding of the data coding. This classifies the answers into three groups of
importance.
3.13.2 Inferential Statistics
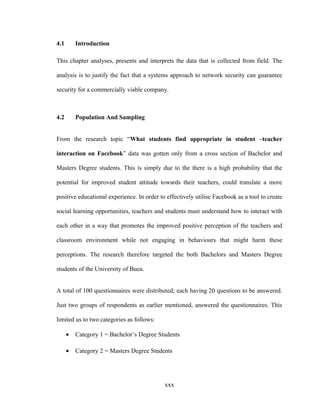
A sample population of 100 students of the University of Buea will serve as respondents
for the questionnaires.
CHAPTER FOUR
DATA ANALYSIS AND PRESENTATION
xxix](https://image.slidesharecdn.com/094ddf30-0f03-4514-931a-8938d803e9fa-150703090405-lva1-app6892/85/FUH-SHARON-RESEARCH-PROJECT-29-320.jpg)


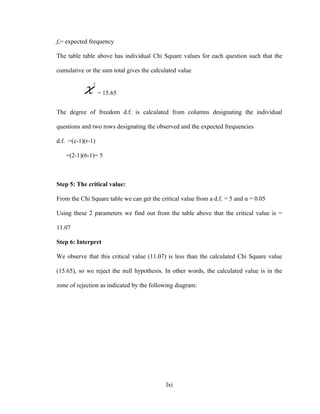
![]
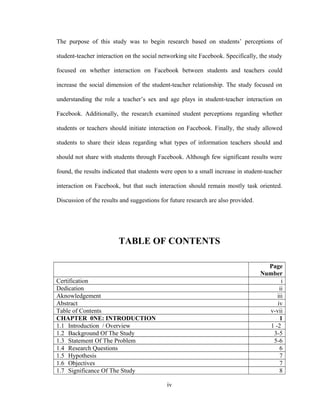
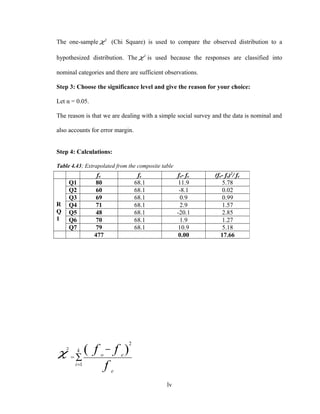
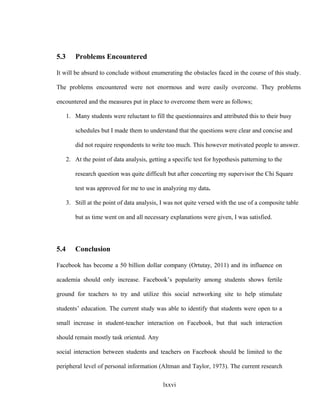
Figure 4.41: One-tailed test α = 0.05 for the inferential data analysis based on set of questions
The calculated value 51.29, is greater than the critical value of 30.14 and is in the zone of
rejection, therefore we reject the null hypothesis.
4.5.2 Inferential Data Analysis Based on Set of Respondents
Step 1: State the hypothesis
H0: The use of Facebook as an interactive medium between teachers and students
ameliorates their relationship in the academic milieu.
H1: The use of Facebook as an interactive medium between teachers and students does
not ameliorate their relationship in the academic milieu.
Step 2: Choose the Statistical test and give the reason for your choice:
The one-sample 2
χ (Chi Square) is used to compare the observed distribution to a
hypothesized distribution. The 2
χ is used because the responses are classified into
nominal categories and there are sufficient observations.
Step 3: Choose the significance level and give the reason for your choice:
Let α = 0.05.
li
Calculated Value=51.29Critical Value=30.14
α = 0.05
Zone of Rejection](https://image.slidesharecdn.com/094ddf30-0f03-4514-931a-8938d803e9fa-150703090405-lva1-app6892/85/FUH-SHARON-RESEARCH-PROJECT-51-320.jpg)


This document provides certification that the research project was completed solely by the student, Fuh Sharon Bih, for their Bachelor's degree. It includes a dedication to God and the student's mother for their support. The acknowledgements section thanks the student's supervisor and others for their assistance. The abstract summarizes that the study examined student perceptions of interaction between students and teachers on Facebook, specifically regarding the role of teacher characteristics and what types of information sharing are appropriate. It aimed to understand if such interaction could enhance the social dimension of the student-teacher relationship.


