The Global Compound Feed Market in Numbers
•
0 likes•361 views

Livestock production trends show that growth varies by geography. Estimates indicate that global compound feed production is approaching one billion metric tons.

Recommended
Recommended
More Related Content
What's hot
What's hot (19)
Viewers also liked
Similar to The Global Compound Feed Market in Numbers
Similar to The Global Compound Feed Market in Numbers (20)
More from Milling and Grain magazine
More from Milling and Grain magazine (20)
The Global Compound Feed Market in Numbers
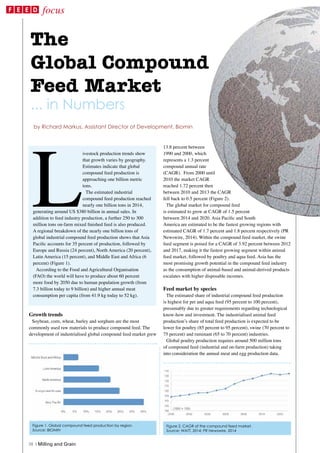
- 1. Growth trends Soybean, corn, wheat, barley and sorghum are the most commonly used raw materials to produce compound feed. The development of industrialised global compound feed market grew 13.8 percent between 1990 and 2000, which represents a 1.3 percent compound annual rate (CAGR). From 2000 until 2010 the market CAGR reached 1.72 percent then between 2010 and 2013 the CAGR fell back to 0.5 percent (Figure 2). The global market for compound feed is estimated to grow at CAGR of 1.5 percent between 2014 and 2020. Asia Pacific and South America are estimated to be the fastest growing regions with estimated CAGR of 1.7 percent and 1.8 percent respectively (PR Newswire, 2014). Within the compound feed market, the swine feed segment is poised for a CAGR of 3.92 percent between 2012 and 2017, making it the fastest growing segment within animal feed market, followed by poultry and aqua feed. Asia has the most promising growth potential in the compound feed industry as the consumption of animal-based and animal-derived products escalates with higher disposable incomes. Feed market by species The estimated share of industrial compound feed production is highest for pet and aqua feed (95 percent to 100 percent), presumably due to greater requirements regarding technological know-how and investment. The industrialised animal feed production’s share of total feed production is expected to be lower for poultry (85 percent to 95 percent), swine (70 percent to 75 percent) and ruminant (65 to 70 percent) industries. Global poultry production requires around 500 million tons of compound feed (industrial and on-farm production) taking into consideration the annual meat and egg production data. The Global Compound Feed Market ... in Numbers by Richard Markus, Assistant Director of Development, Biomin Figure 1. Global compound feed production by region. Source: BIOMIN Figure 2. CAGR of the compound feed market. Source: WATT, 2014; PR Newswire, 2014 L ivestock production trends show that growth varies by geography. Estimates indicate that global compound feed production is approaching one billion metric tons. The estimated industrial compound feed production reached nearly one billion tons in 2014, generating around US $380 billion in annual sales. In addition to feed industry production, a further 250 to 300 million tons on-farm mixed finished feed is also produced. A regional breakdown of the nearly one billion tons of global industrial compound feed production shows that Asia Pacific accounts for 35 percent of production, followed by Europe and Russia (24 percent), North America (20 percent), Latin America (15 percent), and Middle East and Africa (6 percent) (Figure 1). According to the Food and Agricultural Organisation (FAO) the world will have to produce about 60 percent more food by 2050 due to human population growth (from 7.3 billion today to 9 billion) and higher annual meat consumption per capita (from 41.9 kg today to 52 kg). 38 | Milling and Grain F E E D focus
- 2. The industrial feed production accounts for roughly 430 out of 500 million tons. Annual broiler meat production reached nearly 92 million tons in 2014, which is around 12 percent less than global pork production. Global egg production is estimated at about 1250 billion eggs (Figure 4). Considering average feed consumption for broilers and layers/breeders and average yearly egg production of layers and breeders, the estimated total poultry feed consumption (industrialised and on-farm), including turkey and duck production is around 500 million tons. Poultry production is expected to grow intensively further. In broiler meat production the highest growth is estimated in Qatar, Kazakhstan, Ghana, Jordan and Saudi Arabia with 30 percent; 11.5 percent, 11 percent; 9.3 percent, 9.3 percent besides Russia, USA, Brazil, EU and Mexico is expected to grow between 2.5- 4.5 percent in the following years. In China the growth rate of broiler meat seems to be more flat. Swine The world second biggest feed market is the swine industry, which consumes around 354 million tons of feed (industrialised and on-farm) based on meat production, animal number and feed consumption data. World swine livestock is already above 1.2 billion tons, of which more than 55 percent belongs to China, 20 percent to the EU and 10 percent to the US (Figure 6). Altogether those regions are giving more than 85 percent of the total swine production. The CAGR in swine production is predicted to be the highest in Figure 4. Global egg production Source: Watt media, 2014 Figure 3. Compound feed consumption by species, worldwide Source: Watt media (2014), FAO (2015), BIOMIN Turnkey Feed Mill Systems www.yemtar.com 600 Evler Mah. Balikesir Asfaltı Sol Taraf Cad. No:65 BANDIRMA / BALIKESİR / TURKEY P(+90)266 733 85 50 | F(+90)266 733 85 54 G e a r D r i v e n P e l l e t M i l l July 2015 | 39 F
- 3. Belarus, South Korea, US, Canada and Brazil (8.89 percent; 4.69 percent, 4.29 percent, 1.77 percent; 1.51 percent respectively). The estimated growth in EU, Russia and Mexico is slightly above 0.5 percent. In China a more than six percent reduction is expected (Figure 7). Ruminants Ruminants make up the third largest segment of the total global feed industry, consuming more than 280 million tons. Since intensification within the ruminant sector is highly variable the calculation is based on animal numbers and production stage (dairy, heifer, beef cattle), and on production intensification (extensive, semi-intensive, and intensive production). India, Brazil, China, USA and EU, the five biggest players in the dairy industry, account for 80 percent of total dairy livestock. India has more than 20 percent of the total dairy livestock. The biggest growth (1-2 percent) concerning dairy livestock is expected in China, India, Mexico, US and Brazil. In the EU the expected growth is around 0.5 percent. Russian market estimated to narrow by 3 percent (Figure 8). In case of beef production the biggest growth is expected from Belarus, India and from Central and South America contrary to China and Russia where markets are projected to narrow. North America and EU market estimated to grow only slightly in the following years (Figure 9). With human population growth and meat and dairy consumption all rising, livestock and compound feed production follow in turn. On a global level, meat and dairy production appears set to increase further in the coming years, though geographical differences mean that some markets will experience stronger growth than others. Table 1. Regional industrial compound feed (CPF) production, 2014 Region High estimate [million metric tons] Low estimate [million metric tons] Europe & Russia 233.0 225.6 North America 206.4 193.0 Asia Pacific 350.0 326.4 Middle East & Africa 59.0 54.7 Latin America 146.8 145.0 TOTAL 995 945 Source: Watt media (2014), FAO (2015), BIOMIN Table 2. Breakdown of industrialised animal feed consumption Animal species High estimate [million mton] Low estimate [million mton] Total animal feed consumption (industrial + on-farm) [million mton] Industrial CPF share of total consumption [%] Poultry 439 426 500 85-90 Swine 256 248 354 70-75 Ruminants 196 194 283 65-70 Aqua 43 41 41 95-100 Pet 22 - 22 95-100 Equine 11 - - - Total 967 909 1200 - Source: Watt media (2014), FAO (2015), BIOMIN Figure 5. Estimated growth in broiler meat production (%) Source: USDA, 2015; Index Mundi, 2015 Figure 6. Distribution of swine production by country (%) Source: USDA, 2015; Index Mundi, 2015 Figure 7. Swine production annual growth rate (%) Source: Index Mundi estimates, 2015, based on USDA data, 2015 Figure 8. Estimated growth in dairy cow stock (%) Source: USDA, 2015; Index Mundi, 2015 Figure 9. Estimated growth in beef production (%) Source: USDA, 2015; Index Mundi, 2015 Want more in-depth features? Visit our website for a full archive of past online issues that can be viewed for FREE! www.millingandgrain.com 40 | Milling and Grain F E E D focus