Monthly Viewpoint: April 2017
•
1 like•567 views

The ACPI Monthly Viewpoint for April from our CIO, Marco Pabst: "Reality Check"

Recommended
Recommended
More Related Content
What's hot
What's hot (20)
Similar to Monthly Viewpoint: April 2017
Similar to Monthly Viewpoint: April 2017 (20)
Recently uploaded
Recently uploaded (14)
Monthly Viewpoint: April 2017
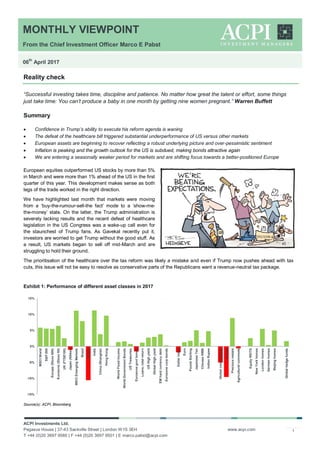
- 1. MONTHLY VIEWPOINT From the Chief Investment Officer Marco E Pabst 06 th April 2017 ACPI Investments Ltd. Pegasus House | 37-43 Sackville Street | London W1S 3EH T +44 (0)20 3697 9580 | F +44 (0)20 3697 9501 | E marco.pabst@acpi.com www.acpi.com 1 Reality check “Successful investing takes time, discipline and patience. No matter how great the talent or effort, some things just take time: You can’t produce a baby in one month by getting nine women pregnant.” Warren Buffett Summary Confidence in Trump’s ability to execute his reform agenda is waning The defeat of the healthcare bill triggered substantial underperformance of US versus other markets European assets are beginning to recover reflecting a robust underlying picture and over-pessimistic sentiment Inflation is peaking and the growth outlook for the US is subdued, making bonds attractive again We are entering a seasonally weaker period for markets and are shifting focus towards a better-positioned Europe European equities outperformed US stocks by more than 5% in March and were more than 1% ahead of the US in the first quarter of this year. This development makes sense as both legs of the trade worked in the right direction. We have highlighted last month that markets were moving from a ‘buy-the-rumour-sell-the fact’ mode to a ‘show-me- the-money’ state. On the latter, the Trump administration is severely lacking results and the recent defeat of healthcare legislation in the US Congress was a wake-up call even for the staunchest of Trump fans. As Gavekal recently put it, investors are worried to get Trump without the good stuff. As a result, US markets began to sell off mid-March and are struggling to hold their ground. The prioritisation of the healthcare over the tax reform was likely a mistake and even if Trump now pushes ahead with tax cuts, this issue will not be easy to resolve as conservative parts of the Republicans want a revenue-neutral tax package. Exhibit 1: Performance of different asset classes in 2017 Source(s): ACPI, Bloomberg -15% -10% -5% 0% 5% 10% 15% MSCIWorld S&P500 Europe(Stoxx600) Eurozone(Stoxx50) UK(FTSE100) Japan(Nikkei) MSCIEmergingMarkets Brasil Russia India China(Shanghai) HongKong WorldFixedIncome WorldGovernmentBonds USTreasuries Eurozonegovtbonds Loans,totalreturn USHighyield GlobalHighyield EMhardcurrencydebt Eurozonecorpbonds Dollarindex Euro PoundSterling JapaneseYen ChineseRMB IndianRupee Globalcommodities Energy Preciousmetals Agriculturalcommods EquityREITS NewYorkhomes Londonhomes Germanhomes Beijinghomes Globalhedgefunds
- 2. MONTHLY VIEWPOINT From the Chief Investment Officer Marco E Pabst 06 th April 2017 ACPI Investments Ltd. Pegasus House | 37-43 Sackville Street | London W1S 3EH T +44 (0)20 3697 9580 | F +44 (0)20 3697 9501 | E marco.pabst@acpi.com www.acpi.com 2 The problem is that hard economic data are not strong enough yet to bridge the gap between current implied valuations and realistic future earnings expectations. As always, the risk is that when this gap spans significantly more than six months’ time, and this is the case today, markets can quickly run out of patience and demand results or else. Exhibit 2: Divergence of soft (survey-based expectations) and hard economic data in the US Source(s): Bloomberg Despite relatively robust headline numbers for DM equities and US stocks, the Trump retracement has been in full swing for the past weeks. Thus, infrastructure stocks lost more than 12% from their peak, companies that would benefit the most from deregulation are down 15% from their recent tops and sectors that benefit from reflation lost more than 11% from their highs. These losses reduced the gains made in these areas since the elections by between 50% and 90% on a relative basis to the S&P500. Exhibit 3: US Treasury and German Bund yields and 10-year inflation expectations Source(s): Bloomberg, ACPI
- 3. MONTHLY VIEWPOINT From the Chief Investment Officer Marco E Pabst 06 th April 2017 ACPI Investments Ltd. Pegasus House | 37-43 Sackville Street | London W1S 3EH T +44 (0)20 3697 9580 | F +44 (0)20 3697 9501 | E marco.pabst@acpi.com www.acpi.com 3 Consistent with this slight retracement of the Trump trade, bond markets have been consolidating for most of this year and the 10-year bond yield remains in a fairly narrow range, currently trading closer to the lower bounds of this range. This indicates that the market, correctly in our view, is looking through the energy base effect-induced rise in inflation that is now coming back down slightly in terms of core inflation. More importantly, inflation expectations in the US have fallen by more than 15bps over the last weeks indicating a potential end to the inflation scare. Rate markets performed better as a result and credit is benefitting from this development thanks to its attractive carry. We continue to believe that barring a meaningful tax reform, actual US GDP growth and inflation will be rather contained in the foreseeable future, as will be earnings growth. The AtlantaFed GDPNow estimate of 1.2% GDP growth for the first quarter of this year reflects this view of subdued hard data versus survey-based expectations. March PMI numbers for the US came in weaker than expected and, according to Markit, is consistent with GDP expanding by 1.7% in the first quarter. Generally, it appears that growth has peaked in January, sliding to a six-month low in March. This should support a benign rate picture, a well-behaved central bank and a probably somewhat more volatile equity market. The prospect of a successful tax reform is clearly the one factor supporting markets at the moment as its potential impact on corporate earnings cannot be dismissed easily. Depending on the various possible outcomes, EPS upside in terms of US large caps could be close to 10% and in terms of small and mid-sized companies substantially more. Exhibit 4: Tax reform scenarios, impact on the S&P500 Source(s): JP Morgan This could ease some of the concerns around valuations, where we currently have the US S&P500 trading at 25x trailing GAAP earnings. Unfortunately, even including the effects of the tax reform, markets would not look cheap in absolute terms but it the momentum of revisions that is important in this context. In terms of credibility, Trump certainly lost a lot of brownie points with markets over the past weeks as currently only 9% of institutional investors believe that a meaningful healthcare reform will be implemented, according to Credit Suisse. Only 23% and 21% believe that the administration will be successful on their immigration and trade agenda, respectively, whilst 61% still think that the corporate tax reform will be agreed on. The weakish performance of the economy should call into question the consensus view of another two to three rate hikes this year by the Fed. We would rather assume that the Fed will begin to focus on their balance as was underlined in its latest minutes. This would be in-line with Draghi’s comments about tapering asset purchases and reviewing the size of the ECB’s balance sheet. Specifically, the participants in the Fed meeting stated that they “generally preferred to phase out or cease reinvestments of both Treasury securities and agency MBS” in a move that could potentially see the size of the balance sheet shrink substantially over the next few years. As a result, the probability of three or more rate hikes in 2017 fell back to 50%. Overall, we believe a reduction in the Fed’s balance would be less disruptive but send the same signal to markets in terms of gradually tightening monetary conditions.
- 4. MONTHLY VIEWPOINT From the Chief Investment Officer Marco E Pabst 06 th April 2017 ACPI Investments Ltd. Pegasus House | 37-43 Sackville Street | London W1S 3EH T +44 (0)20 3697 9580 | F +44 (0)20 3697 9501 | E marco.pabst@acpi.com www.acpi.com 4 Thus, any further signs of slipping timelines for the various reform packages would be bullish for US treasuries and could send yields lower in the US. As the Fed appears undeterred in the short term, this would help flatten the yield curve more. Purely from a curve perspective, the Trump reflation trade was over shortly after the election and not only in the US. Exhibit 5: International 10year-2year yield curves Source(s): ACPI, Bloomberg As for US inflationary pressures, we have always believed that the spike in the first quarter would be temporary in nature due to energy price base effect. In addition, there are signs that the largest component in the US inflation basket, the shelter component, is beginning to roll over. Exhibit 6: US utilities versus Treasury bonds Source(s): ACPI, Bloomberg
- 5. MONTHLY VIEWPOINT From the Chief Investment Officer Marco E Pabst 06 th April 2017 ACPI Investments Ltd. Pegasus House | 37-43 Sackville Street | London W1S 3EH T +44 (0)20 3697 9580 | F +44 (0)20 3697 9501 | E marco.pabst@acpi.com www.acpi.com 5 Thus, month-on-month rent growth is now down to 1% from as high as 7% in 2015, according to the Zillow rent index. As shelter accounts for ~42% of core CPI, stale rental growth will provide a material headwind for inflation bulls. Core CPI excluding shelter costs reached 1.3% year-on-year in February. Interestingly, rate-sensitive sectors in the US such as utilities seem to have implicitly priced in a less inflationary scenario than widely feared. Typically, the performance of utility stocks is very closely correlated to interest rates and this relationship appears to have broken with the US elections. Whilst government bonds slumped and yields rose, utilities held steady implying that rates might not rise as much. Should, unusually, equities are correct this time, this implies that 10-year bonds are approximately 75bp cheap in yield terms. As far as European markets are concerned, the benign and unexpected outcome of the Dutch elections as well as recent polling trends in France supported the positive performance of European equities and the common currency. In our view, this move is largely driven by a normalisation in positioning of investors where sentiment towards Europe relative to the US has hit new lows earlier this year. In addition, what is broadly ignored is the fact that the European economy grew faster than the US last year at 1.7% versus 1.6%, respectively. We used this backdrop of a more positive momentum in Europe to increase our exposure to European equities, namely Italian financials. There is currently no reason to suggest that this trend is over with the latest numbers from Spain and Germany indicating renewed momentum in economic activity and inflation. As outlined last month, we expect monetary conditions in Europe to normalise and would therefore avoid expensive EUR bonds at this juncture. Exhibit 7: German composite PMI and Markit Spain services PMI Source(s): Markit, WSJ From our current perspective we believe that French elections will turn out to be unspectacular, barring any unexpected events impacting them in the short term. Thus, Macron is likely to win the final round in May. With regards to German elections, it appears that momentum is waning for social-democratic candidate Martin Schulz whilst Christian democrats and Merkel are improving in latest polls. Such a combined outcome should bode well for stability across the Eurozone and cause fewer disturbances for markets going forward. The Gold rally back from USD1,200 to 1250 and above is consistent with the risk off move in the US. Although we are bullish on precious metals from a fundamental as well as hedging perspective, we would note that the metal is still trading within a fairly established trading range. A move higher towards USD1,300 would imply an even more negative view on the US outlook. Thus, the performance of equities over the summer months will largely hinge on more visible progress towards execution of the US tax as well as healthcare reforms. Furthermore, from a seasonal perspective, April is the last month of the traditionally very profitable Nov-Apr window whereas equity performance has been positive in April during the last eleven years.
- 6. MONTHLY VIEWPOINT From the Chief Investment Officer Marco E Pabst 06 th April 2017 ACPI Investments Ltd. Pegasus House | 37-43 Sackville Street | London W1S 3EH T +44 (0)20 3697 9580 | F +44 (0)20 3697 9501 | E marco.pabst@acpi.com www.acpi.com 6 Global economic monitor Source(s): ACPI, Bloomberg Oct Nov Dec Jan Feb Mar Trend Citi Economic Surprise US -8.1 17.8 23.3 31.8 34.7 48.0 Citi Economic Surprise G10 14.5 31.4 33.0 36.9 41.9 41.8 Citi Economic Surprise Europe 40.8 56.9 53.1 55.3 71.1 54.1 Citi Economic Surprise EM -13.9 -4.4 18.1 37.1 46.6 34.4 Citi Economic Surprise UK 75.0 46.3 49.6 69.8 92.3 60.8 ISM manufacturing 52.0 53.5 54.5 56.0 57.7 57.2 ISM new orders 55.9 56.1 60.5 59.5 63.15 61.7 Global manufacturing PMI 53.1 53.2 53.6 53.9 53.4 53.8 China manufacturing PMI 51.2 51.7 51.4 51.3 51.6 51.8 Japan manufacturing PMI 51.4 51.3 52.4 52.7 53.3 52.4 US durable goods orders 5.0 -4.7 -0.9 2.4 1.8 US initial jobless claims 261 262 241 250 227 258 US Industrial production 0.2 -0.2 0.7 -0.1 0.1 Euro Industrial production 0.2 1.5 -1.2 0.9 Japan Industrial production 0.0 1.5 0.7 -0.4 2.0 US retail sales 0.7 0.2 1.0 0.6 0.1 Euro retail sales 1.2 -0.2 -0.3 0.1 0.7 Japan retail sales -0.2 1.7 0.7 1.0 0.1 China retail sales 10.0 10.8 10.9 US consumer confidence 100.8 109.4 113.3 111.6 116.1 125.6 Euro consumer confidence -8.0 -6.2 -5.1 -4.8 -6.2 -5.0 ifo German business expectations 106.0 105.4 105.6 103.2 104.2 105.7 China export trade -7.9 -1.5 -6.2 7.9 -1.3 South Korea export trade -3.2 2.5 6.4 11.2 20.2 13.7 German export trade 1.9 4.3 3.3 5.7 China monthly money supply 11.6 11.4 11.3 11.3 11.1 US personal income 0.4 0.2 0.3 0.5 0.4
- 7. MONTHLY VIEWPOINT From the Chief Investment Officer Marco E Pabst 06 th April 2017 ACPI Investments Ltd. Pegasus House | 37-43 Sackville Street | London W1S 3EH T +44 (0)20 3697 9580 | F +44 (0)20 3697 9501 | E marco.pabst@acpi.com www.acpi.com 7 The Global PMI heatmap Source(s): ACPI, Bloomberg Country/RegionCategory/SectorMar-2017Feb-2017Jan-2017Dec-2016Nov-2016Oct-2016Sep-2016Aug-2016Jul-2016Jun-2016May-2016Apr-2016Mar-2016Feb-2016Jan-2016Dec-2015Nov-2015Oct-2015Sep-2015Aug-2015Jul-2015Jun-2015May-2015Apr-2015Mar-2015 AustriaManufacturing56.857.257.356.355.453.953.552.153.454.552.052.052.851.951.250.651.453.052.550.552.451.250.350.147.7 BrazilComposite48.746.644.745.245.344.946.144.446.442.338.339.040.839.045.143.944.542.742.744.840.841.042.944.247.0 BrazilManufacturing49.646.944.045.246.246.346.045.746.043.241.642.646.044.547.445.643.844.147.045.847.246.545.946.046.2 BrazilServices47.746.445.145.144.443.945.342.745.641.437.337.438.636.944.443.545.543.041.744.839.139.942.544.647.9 CanadaManufacturing55.554.753.551.851.551.150.351.151.951.852.152.251.549.449.347.548.648.048.649.450.851.349.849.048.9 ChinaComposite#N/A52.652.253.552.952.951.451.851.950.350.550.851.349.450.149.450.549.948.048.850.250.651.251.351.8 ChinaManufacturing51.251.751.051.950.951.250.150.050.648.649.249.449.748.048.448.248.648.347.247.347.849.449.248.949.6 ChinaServices#N/A52.653.153.453.152.452.052.151.752.751.251.852.251.252.450.251.252.050.551.553.851.853.552.952.3 CzechRepublicManufacturing57.557.655.753.852.253.352.050.149.351.853.353.654.355.556.955.654.254.055.556.657.556.955.554.756.1 DevelopedMarketsManufacturing53.954.154.253.752.952.651.551.251.451.250.350.550.950.852.152.052.352.651.751.952.151.852.151.952.7 DevelopedMarketsServices53.953.654.553.854.053.651.751.551.351.551.852.351.751.253.353.954.854.253.955.254.754.454.855.756.0 DevelopedMarketsComposite54.154.054.654.154.053.751.951.751.551.451.451.951.751.253.253.754.654.053.654.654.453.954.455.055.7 EgyptWholeEconomy45.946.743.342.841.842.046.347.048.947.547.646.944.548.148.048.245.047.250.251.249.250.249.949.849.6 EmergingMarketsComposite#N/A52.151.951.951.451.851.151.351.549.949.549.950.549.050.149.450.249.749.049.850.250.050.851.251.6 EmergingMarketsManufacturing51.651.350.851.050.751.050.350.150.349.249.549.650.248.949.449.049.249.048.548.649.149.949.849.650.0 EmergingMarketsServices#N/A52.052.151.550.951.051.051.251.550.549.149.950.148.950.849.550.250.449.950.751.249.751.351.852.0 EuropeanUnionComposite56.155.654.654.954.253.652.953.051.853.053.152.853.353.054.054.554.554.253.554.554.554.954.154.955.1 EuropeanUnionManufacturing55.955.355.355.053.553.452.951.951.452.751.451.551.751.452.453.052.852.652.052.352.652.652.352.252.6 EuropeanUnionServices55.755.053.954.454.153.352.352.851.552.753.452.953.353.254.154.554.654.353.654.754.855.454.455.455.3 EurozoneComposite56.456.054.454.453.953.352.652.953.253.153.153.053.153.053.654.354.253.953.654.353.954.253.653.954.0 EurozoneManufacturing56.255.455.254.953.753.552.651.752.052.851.551.751.651.252.353.252.852.352.052.352.452.552.252.052.2 EurozoneRetail#N/A49.950.150.448.648.649.651.048.948.550.647.949.250.148.949.048.551.351.951.454.250.451.449.548.6 EurozoneServices56.055.553.753.753.852.852.252.852.952.853.353.153.153.353.654.254.254.153.754.454.054.453.854.154.2 EurozoneConstruction#N/A52.250.752.351.449.449.148.648.346.548.447.549.051.350.349.448.747.848.847.247.146.047.246.247.1 FranceComposite56.855.954.153.151.451.652.751.950.149.650.950.250.049.350.250.151.052.651.950.251.553.352.050.651.5 FranceManufacturing53.352.253.653.551.751.849.748.348.648.348.448.049.650.250.051.450.650.650.648.349.650.749.448.048.8 FranceRetail#N/A51.753.150.447.347.549.153.051.651.050.648.245.548.148.946.647.851.949.649.552.948.948.746.245.7 FranceServices57.556.454.152.951.651.453.352.350.549.951.650.649.949.250.349.851.052.751.950.652.054.152.851.452.4 FranceConstruction53.251.550.150.650.347.547.845.344.842.343.841.642.744.643.042.244.843.844.242.340.638.440.037.735.9 GermanyComposite57.156.154.855.255.055.152.853.355.354.454.553.654.054.154.555.555.254.254.155.053.753.752.654.155.4 GermanyManufacturing58.356.856.455.654.355.054.353.653.854.552.151.850.750.552.353.252.952.152.353.351.851.951.152.152.8 GermanyRetail#N/A51.250.352.049.651.053.054.152.051.654.051.054.152.549.550.549.652.454.054.757.754.055.852.653.0 GermanyServices55.654.453.454.355.154.250.951.754.453.755.254.555.155.355.056.055.654.554.154.953.853.853.054.055.4 GermanyConstruction#N/A54.152.054.953.952.952.451.651.650.452.753.455.859.657.955.552.551.852.450.350.650.750.851.053.3 GreeceManufacturing46.747.746.649.348.348.649.250.448.750.448.449.749.048.450.050.248.147.343.339.130.246.948.046.548.9 HongKongWholeEconomy#N/A49.649.950.349.548.249.349.047.245.447.245.345.546.446.146.446.646.645.744.448.249.247.648.649.6 IndiaComposite#N/A50.749.447.649.155.452.454.652.451.150.952.854.351.253.351.650.252.651.552.652.049.251.252.553.2 IndiaManufacturing52.550.750.449.652.354.452.152.651.851.750.750.552.451.151.149.150.350.751.252.352.751.352.651.352.1 IndiaServices#N/A50.348.746.846.754.552.054.751.950.351.053.754.351.454.353.650.153.251.351.850.847.749.652.453.0 IndonesiaManufacturing50.549.350.449.049.748.750.950.448.451.950.650.950.648.748.947.846.947.847.448.447.347.847.146.746.4 IrelandComposite56.957.859.358.455.554.054.856.956.559.259.158.160.759.561.159.260.257.759.559.761.860.960.859.759.8 IrelandManufacturing53.653.855.555.753.752.151.351.750.253.051.552.654.952.954.354.253.353.653.853.656.754.657.155.856.8 IrelandServices59.160.661.059.156.054.656.259.759.561.261.759.862.862.164.061.863.660.162.462.163.463.361.460.660.9 IrelandConstruction#N/A57.955.758.959.862.358.758.461.059.755.956.462.368.863.658.655.556.355.856.559.165.763.357.252.9 ItalyComposite54.254.852.852.953.451.151.151.952.252.650.853.152.453.753.856.054.353.953.455.053.554.053.753.952.4 ItalyManufacturing55.755.053.053.252.250.951.049.851.253.552.453.953.552.253.255.654.954.152.753.855.354.154.853.853.3 ItalyRetail#N/A45.545.647.948.846.545.043.240.340.245.242.646.649.447.950.247.748.851.748.750.746.748.349.045.7 ItalyServices52.954.152.452.353.351.050.752.352.051.949.852.151.253.853.655.353.453.453.354.652.053.452.553.151.6 ItalyConstruction49.049.949.250.248.545.945.147.746.944.947.245.345.846.147.248.647.346.448.548.049.247.049.348.451.1 JapanComposite52.952.252.352.852.051.348.949.850.149.049.248.949.951.052.652.252.352.351.252.951.551.551.650.749.4 JapanManufacturing52.453.352.752.451.351.450.449.549.348.147.748.249.150.152.352.652.652.451.051.751.250.150.949.950.3 JapanServices52.951.351.952.351.850.548.249.650.449.450.449.350.051.252.451.551.652.251.453.751.251.851.551.348.4 LebanonWholeEconomy46.947.747.747.046.943.845.145.045.544.444.844.145.047.449.147.946.947.148.147.849.349.348.049.048.9 MexicoManufacturing51.550.650.850.251.151.851.950.950.651.153.652.453.253.152.252.453.053.052.152.452.952.053.353.853.8 NetherlandsManufacturing57.858.356.557.357.055.753.453.553.252.052.752.653.651.752.453.453.553.753.053.956.056.255.554.052.5 PolandManufacturing53.554.254.854.351.950.252.251.550.351.852.151.053.852.850.952.152.152.250.951.154.554.352.454.054.8 RussiaComposite56.355.458.356.655.853.753.152.953.553.551.251.350.850.648.447.850.549.050.949.350.949.551.650.846.8 RussiaManufacturing52.452.554.753.753.652.451.150.849.551.549.648.048.349.349.848.750.150.249.147.948.348.747.648.948.1 SaudiArabiaWholeEconomy56.457.056.755.555.053.255.356.656.054.454.854.254.554.453.954.456.355.756.558.757.756.157.058.360.1 SouthAfricaWholeEconomy50.750.551.351.650.850.550.749.849.949.650.247.947.049.149.649.149.647.547.949.348.949.250.151.551.6 SouthKoreaManufacturing48.449.249.049.448.048.047.648.650.150.550.150.049.548.749.550.749.149.149.247.947.646.147.848.849.2 SpainComposite56.857.054.755.555.254.454.154.853.755.754.855.255.154.555.355.256.255.054.658.858.355.858.359.156.9 SpainManufacturing53.954.855.655.354.553.352.351.051.052.251.853.553.454.155.453.053.151.351.753.253.654.555.854.254.3 SpainServices57.457.754.255.055.154.654.756.054.156.055.455.155.354.154.655.156.755.955.159.659.756.158.460.357.3 TaiwanManufacturing56.254.555.656.254.752.752.251.851.050.548.549.751.149.450.651.749.547.846.946.147.146.349.349.251.0 TurkeyManufacturing52.349.748.747.748.849.848.347.047.647.449.448.949.250.350.952.250.949.548.849.350.149.050.248.548.0 UnitedArabEmiratesWholeEconomy56.256.055.355.054.253.354.154.755.353.454.052.854.553.152.753.354.554.056.057.155.854.756.456.856.3 UnitedKingdomComposite54.953.855.256.755.354.853.753.547.452.653.252.053.752.755.855.255.855.253.255.356.857.556.058.558.6 UnitedKingdomManufacturing54.254.555.456.053.554.655.253.548.252.550.749.751.250.952.351.352.554.951.351.852.351.552.252.354.0 UnitedKingdomServices55.053.354.556.255.254.552.652.947.452.353.552.353.752.755.655.555.954.953.355.657.458.556.559.558.9 UnitedKingdomConstruction52.252.552.254.252.852.652.349.245.946.051.252.054.254.255.057.855.358.859.957.357.158.155.954.257.8 UnitedStatesManufacturing53.354.255.054.354.153.451.552.052.951.350.750.851.551.352.451.252.854.153.153.053.853.654.054.155.7 UnitedStatesServices52.853.855.653.954.654.852.351.051.451.451.352.851.349.753.254.356.154.855.156.155.754.856.257.459.2 UnitedStatesComposite53.054.155.854.154.954.952.351.551.851.250.952.451.350.053.254.055.955.055.055.755.754.656.057.059.2 VietnamManufacturing54.654.251.952.454.051.752.952.251.952.652.752.350.750.351.551.349.450.149.551.352.652.254.853.550.7 WorldComposite53.853.453.953.653.253.151.751.551.751.150.951.451.450.752.352.353.252.752.453.453.352.853.253.854.4 WorldManufacturing53.053.052.752.752.051.951.050.751.050.450.150.250.750.050.950.751.051.050.450.550.850.951.150.851.5 WorldServices53.653.154.053.553.152.951.651.251.651.351.251.751.350.852.752.653.653.253.154.454.053.353.854.655.0 The table shows monthly PMI statistics across countries and different sectors per country for the past two years. The latest data is next to the country/sector name at the bottom of the page. 2012 Eurozone crisis Brazil in recession Italy’s permanent recession Improving picture in the UK and US EM recovery
- 8. MONTHLY VIEWPOINT From the Chief Investment Officer Marco E Pabst 06 th April 2017 ACPI Investments Ltd. Pegasus House | 37-43 Sackville Street | London W1S 3EH T +44 (0)20 3697 9580 | F +44 (0)20 3697 9501 | E marco.pabst@acpi.com www.acpi.com 8 The World in Numbers Source(s): ACPI, Bloomberg Date PMI CPI (%) Disc rate % Ind Prodyoy% Exports ($M) Imports ($M) Trade bal ($M) M2 ($bn) M2 mom% Unempl % Date GDP yoy% 30/09/2016 54 1.5 0.5 -1.17 125,699 187,667 -61,968 13,016 4.9 31/03/2016 1.6 31/10/2016 51.8 1.60 0.50 -0.76 128,950 193,874 -64,924 13,071 0.4% 4.8 30/06/2016 1.3 30/11/2016 57.2 1.7 0.5 -0.35 124,050 193,186 -69,136 13,148 0.6% 4.6 30/09/2016 1.7 31/12/2016 53.9 2.1 0.75 0.82 126,945 185,608 -58,663 13,185 0.3% 4.7 31/12/2016 2 31/01/2017 50.3 2.5 0.75 0.13 118,802 187,628 -68,826 13,268 0.6% 4.8 28/02/2017 57.4 2.7 0.75 0.45 119,958 170,931 -50,973 13,311 0.3% 4.7 31/03/2017 57.7 1.00 Date PMI CPI (%) Disc rate % Ind Prodyoy% Exports ($bn) Imports ($bn) Trade bal ($bn) M2 (RMBbn) M2 mom% Date GDP yoy% 30/09/2016 50.4 1.9 1.50 6.1 183.61 142.98 40.6 151,636 31/03/2016 6.7 31/10/2016 51.2 2.1 1.50 6.1 177.09 128.8 48.3 151,949 0.2% 30/06/2016 6.7 30/11/2016 51.7 2.3 1.50 6.2 193.62 150.42 43.2 153,043 0.7% 30/09/2016 6.7 31/12/2016 51.4 2.1 1.50 6.0 209.31 168.6 40.7 155,007 1.3% 31/12/2016 6.8 31/01/2017 51.3 2.5 1.50 182.73 131.46 51.3 157,595 1.7% 28/02/2017 51.6 0.8 1.50 120.08 129.23 -9.1 158,291 0.4% 31/03/2017 51.8 1.50 Date PMI CPI (%) Disc rate % Ind Prodyoy% Exports (€bn) Imports (€bn) Trade bal (€bn) M2 EZ (€bn) M2 EZ mom% Unempl % Date GDP yoy% 30/09/2016 54.3 0.7 0.00 1.4 100.01 79.1 20.9 10,552,683 6.1 31/03/2016 1.9 31/10/2016 55 0.8 0.00 1.6 100.51 80.01 20.5 10,568,187 0.1% 6.0 30/06/2016 1.8 30/11/2016 54.3 0.8 0.00 2.3 104.01 82.73 21.3 10,659,566 0.9% 6.0 30/09/2016 1.7 31/12/2016 55.6 1.7 0.00 -0.1 101.12 82.8 18.3 10,732,768 0.7% 6.0 31/12/2016 1.7 31/01/2017 56.4 1.9 0.00 0.0 103.72 85.14 18.6 10,732,383 0.0% 5.9 28/02/2017 56.8 2.2 0.00 10,768,469 0.3% 5.9 31/03/2017 58.3 1.6 0.00 5.8 Date PMI CPI (%) Disc rate % Ind Prodyoy% Exports,GBPM Imports,GBPM Trade bal (GBPM) M2 (GBPM) M2 mom% Unempl % Date GDP yoy% 30/09/2016 55.2 1 0.25 0.5 45,127 50,563 -5,436 1,619,462 4.8 31/03/2016 1.6 31/10/2016 54.6 0.9 0.25 -0.8 47,440 48,025 -585 1,622,800 0.2% 4.8 30/06/2016 1.7 30/11/2016 53.5 1.2 0.25 2.3 48,316 50,738 -2,422 1,626,084 0.2% 4.8 30/09/2016 2.0 31/12/2016 56 1.6 0.25 4.3 49,022 51,048 -2,026 1,638,956 0.8% 4.8 31/12/2016 1.9 31/01/2017 55.4 1.8 0.25 3.2 49,404 51,370 -1,966 1,618,534 -1.2% 4.7 28/02/2017 54.5 2.3 0.25 1,618,965 0.0% 31/03/2017 54.2 0.25 Date CPI (%) Disc rate % Ind Prodyoy% Exports,JPYbn Imports,JPYbn Trade bal (JPYbn) M2 (JPY TRN) M2 mom% Unempl % Date GDP yoy% 30/09/2016 -0.5 1.5 5,969 5,482 487 943 3.0 31/03/2016 0.4 31/10/2016 0.1 -1.4 5,870 5,389 481 945 0.2% 3 30/06/2016 0.9 30/11/2016 0.5 4.6 5,956 5,810 147 951 0.7% 3.1 30/09/2016 1.1 31/12/2016 0.3 3.2 6,679 6,043 636 959 0.8% 3.1 31/12/2016 1.6 31/01/2017 0.4 3.7 5,422 6,514 -1,092 961 0.3% 3 28/02/2017 0.3 4.8 6,347 5,534 814 958 -0.3% 2.8 00/01/1900 4.5 Date CPI (%) Disc rate % Ind Prodyoy% Exports ($M) Imports ($M) Trade bal ($M) M3 (INR 10M) M2 mom% Date GDP yoy% 30/09/2016 4.3 6.50 0.7 22,881 31,220 -8,340 12,530,540 31/03/2016 8.2 31/10/2016 4.2 6.25 -1.9 23,513 33,674 -10,161 12,415,090 -0.9% 30/06/2016 6.9 30/11/2016 3.6 6.25 5.7 20,010 33,018 -13,009 12,175,870 -1.9% 30/09/2016 6.7 30/12/2016 3.4 6.25 -0.1 23,885 34,254 -10,369 12,044,950 -1.1% 31/12/2016 6.6 31/01/2017 3.2 6.25 2.7 22,115 31,956 -9,841 12,156,100 0.9% 28/02/2017 3.7 6.25 24,490 33,387 -8,896 12,308,280 1.3% 31/03/2017 6.25 12,509,890 1.6% INDIA US CHINA GERMANY UK JAPAN
- 9. MONTHLY VIEWPOINT From the Chief Investment Officer Marco E Pabst 06 th April 2017 ACPI Investments Ltd. Pegasus House | 37-43 Sackville Street | London W1S 3EH T +44 (0)20 3697 9580 | F +44 (0)20 3697 9501 | E marco.pabst@acpi.com www.acpi.com 9 Performance of different asset classes Source(s): ACPI, Bloomberg EQUITIES Currency MARCH 2017 2016 2015 2014 2013 2012 2011 MSCI World USD 1,853.7 0.8% 5.9% 5.3% -2.7% 2.9% 24.1% 13.2% -7.6% MSCI World (EUR hedged) EUR 144.6 0.6% 4.6% 5.6% -0.2% 7.4% 25.4% 12.0% -7.8% MSCI World (GBP hedged) GBP 745.0 0.7% 4.8% 6.0% -0.1% 7.9% 26.5% 12.6% -7.9% MSCI World (USD hedged) USD 495.0 0.8% 5.0% 7.2% 0.1% 7.6% 26.1% 13.1% -23.3% MSCI World local Local 526.3 0.8% 5.2% 6.8% -0.7% 7.2% 22.9% 13.2% -8.5% US (S&P500) USD 2,362.7 -0.0% 5.5% 9.5% -0.7% 11.4% 29.6% 13.4% 0.0% Europe (Stoxx 600) EUR 381.1 2.9% 5.5% -1.2% 6.8% 4.4% 17.4% 14.4% -11.3% Eurozone (Euro Stoxx 50) EUR 3,500.9 5.5% 6.4% 0.7% 3.8% 1.2% 17.9% 13.8% -17.0% Germany (DAX30) EUR 12,312.9 4.0% 7.2% 6.9% 9.6% 2.7% 25.5% 29.0% -14.7% UK (FTSE 100) GBP 7,322.9 0.8% 2.5% 14.4% -4.9% -2.7% 14.4% 5.8% -5.5% France (CAC40) EUR 5,122.5 5.4% 5.4% 4.9% 8.5% -0.5% 18.0% 15.2% -16.9% Greece (ASE) EUR 666.1 3.1% 3.5% 1.9% -23.6% -28.9% 28.0% 33.4% -51.9% Spain (IBEX) EUR 10,462.9 9.5% 11.9% -2.0% -7.2% 3.7% 21.4% -4.7% -13.1% Italy (MIB) EUR 20,492.9 8.4% 6.5% -10.2% 12.7% 0.2% 16.6% 7.8% -25.2% Japan (Nikkei 225) JPY 18,909.3 -1.1% -1.1% 0.4% 9.1% 7.1% 56.7% 22.9% -17.9% MSCI Emerging Markets USD 958.4 2.3% 11.1% 8.6% -17.0% -4.6% -5.0% 15.1% -20.4% MSCI Emerging Markets local Local 51,212.1 1.8% 7.5% 7.1% -8.0% 2.5% 0.9% 13.9% -14.9% MSCI Asia ex Japan USD 582.0 3.1% 13.2% 2.9% -11.3% 2.2% 0.7% 19.4% -19.2% MSCI Eastern Europe USD 146.8 1.7% 0.1% 33.0% -8.1% -40.0% -2.9% 13.2% -23.3% MSCI Latin America USD 2,611.1 0.4% 11.6% 27.9% -32.9% -14.8% -15.7% 5.4% -21.9% Russia (MICEX) RUB 1,995.9 -2.0% -10.6% 26.8% 26.1% -7.1% 2.0% 5.2% -16.9% India (Sensex) INR 29,620.5 3.1% 11.2% 1.9% -5.0% 29.9% 9.0% 25.7% -24.6% Brasil (Bovespa) BRL 64,984.1 -2.5% 7.9% 38.9% -13.3% -2.9% -15.5% 7.4% -18.1% Hong Kong (Hang Seng) HKD 24,111.6 1.6% 9.6% 0.4% -7.2% 1.3% 2.9% 22.9% -20.0% China (Shanghai Comp) CNY 3,222.5 -0.6% 3.8% -12.3% 9.4% 52.9% -6.8% 3.2% -21.7% South Korea (Kospi) KRW 2,160.2 3.3% 6.6% 3.3% 2.4% -4.8% 0.7% 9.4% -11.0% Israel (TA 25) ILS 1,397.4 -1.8% -5.0% -3.8% 4.4% 10.2% 12.1% 9.2% -18.2% South Africa (Top 40) ZAR 45,167.2 2.3% 2.9% -4.1% 4.2% 6.0% 19.2% 22.2% -0.6% FIXED INCOME MARCH 2017 2016 2015 2014 2013 2012 2011 Citigroup WorldBig USD 210.8 0.1% 1.3% 1.9% -3.2% 0.8% 24.1% 13.2% -7.6% Citigroup WorldBig local Local 219.1 -0.2% 0.2% 3.3% 0.9% 7.9% -0.1% 5.6% 5.7% Citigroup WorldBig (EUR hedged) EUR 219.6 -0.2% -0.1% 2.4% 0.6% 7.8% -0.2% 5.5% 6.2% Citigroup WorldBig (GBP hedged) GBP 269.3 -0.2% 0.1% 3.6% 1.3% 8.2% 0.1% 5.8% 5.9% Citigroup WorldBig (USD hedged) USD 236.7 -0.1% 0.3% 3.9% 0.9% 7.8% -0.1% 5.6% 5.5% World government bonds (Citi) USD 897.7 0.1% 1.6% 1.6% -3.6% -0.5% -4.0% 1.7% 6.4% US Treasuries, total return USD 220.8 -0.1% 0.8% 1.1% 0.8% 6.1% -3.4% 2.1% 9.9% US 10-year yield USD 2.39% -0.00 -0.06 0.17 0.10 -0.86 1.27 -0.12 -1.42 US 10-year bond USD 124.6 -0.4% 0.2% -1.3% -0.7% 3.0% -7.3% 1.3% 8.9% US 5y/5y forward inflation expectation USD 2.12% -0.01 0.07 0.24 -0.33 -0.51 -0.32 0.58 -0.39 Eurozone government debt EUR 229.0 -0.6% -1.6% 3.3% 1.6% 13.1% 2.2% 11.0% 3.4% Eurozone corporate bonds EUR 221.8 -0.3% 0.3% 4.7% -0.7% 8.2% 2.2% 13.6% 1.7% EU high yield (BofAML) USD 290.0 -0.0% 1.7% 9.1% 0.8% -7.4% 15.0% 29.2% -5.6% Germany 10-year yield EUR 0.33% 0.12 0.12 -0.42 0.09 -1.39 0.61 -0.51 -1.14 Germany 10-year bond EUR 161.4 -2.8% -1.7% 3.9% 1.3% 12.0% -4.4% 4.8% 11.0% UK 10-year yield GBP 1.14% -0.01 -0.10 -0.72 0.20 -1.27 1.19 -0.15 -1.42 Japan 10-year yield JPY 0.07% 0.01 0.02 -0.22 -0.06 -0.41 -0.05 -0.20 -0.14 China 10-year yield CNY 3.29% -0.03 0.23 0.20 -0.79 -0.97 1.03 0.15 -0.47 India 10-year yield INR 6.68% -0.19 0.17 -1.25 -0.10 -0.97 0.78 -0.52 0.65 Russia 10-year yield RUB 7.87% -0.33 -0.42 -1.10 -4.13 5.98 0.89 -1.65 0.61 Loans, total return (S&P LSTA) USD 2,720.7 0.1% 1.1% 10.2% -0.7% 1.6% 5.3% 9.7% 1.5% US High yield (BofAML) USD 1,206.1 -0.2% 2.7% 17.5% -4.6% 2.5% 7.4% 15.6% 4.4% US investment grade (BofAML) USD 2,771.5 -0.1% 1.4% 6.0% -0.6% 7.5% -1.5% 10.4% 7.5% US mortgages (BofAML) USD 2,032.5 0.0% 0.5% 1.7% 1.5% 6.1% -1.4% 2.6% 6.1% US municipals (BofAML) USD 534.1 0.2% 1.4% 0.4% 3.6% 9.8% -2.9% 7.3% 11.2% Global high yield (BBG) USD 164.9 -0.0% 3.0% 14.8% -4.7% -0.3% 7.6% 18.6% 2.7% EM hard-currency debt (JPM EMBI+) USD 801.3 0.3% 3.8% 9.6% 1.8% 6.2% -8.3% 18.0% 9.2% EM external government debt (BofAML) USD 1,081.1 0.5% 3.8% 7.6% -1.0% 5.2% -3.3% 17.6% 5.8% EM investment grade (BofAML) USD 356.3 0.3% 2.4% 5.5% -1.0% 3.9% -1.3% 13.2% 5.6% Emerging market spreads USD 245.0 -0.02 -41.79 -218.44 81.55 113.54 43.24 US Investment-grade spreads USD 113.5 3.15 -10.13 -44.55 49.98 22.95 -31.46 US high-yield spreads USD 396.4 17.74 -33.33 -289.20 187.09 180.41 -74.78 CURRENCIES MARCH 2017 2016 2015 2014 2013 2012 2011 Dollar index 100.4 -0.8% -1.8% 3.6% 9.3% 12.8% 0.3% -0.5% 1.5% Euro 1.1 0.7% 1.3% -3.2% -10.2% -12.0% 4.2% 1.8% -3.2% Pound Sterling 1.3 1.4% 1.7% -16.3% -5.4% -5.9% 1.9% 4.6% -0.4% Swiss Franc 1.0 0.3% 1.6% -1.6% -0.8% -10.2% 2.5% 2.6% -0.4% Japanese Yen 111.4 1.2% 5.0% 2.8% -0.5% -12.1% -17.6% -11.3% 5.5% Renminbi 6.9 -0.2% 1.0% -6.6% -4.4% -2.4% 2.9% 1.1% 4.8% Won 1,118.5 1.7% 8.1% -2.6% -7.0% -3.8% 1.0% 9.1% -3.2% Brasilian Real 3.1 -0.3% 4.2% 21.7% -33.0% -11.1% -13.2% -9.1% -11.0% Indian Rupee 64.9 3.0% 4.7% -2.6% -4.5% -2.0% -11.0% -3.1% -15.8% USD real effective exchange rate (Barclays) 136.2 -1.3% -3.0% 4.2% 7.9% 7.7% 1.4% -2.7% 1.7% EUR real effective exchange rate (Barclays) 68.5 1.8% -1.2% -1.2% -4.9% -3.8% 4.4% -1.9% -1.2% JPY real effective exchange rate (Barclays) 129.2 0.3% 1.5% 3.6% 4.9% -7.1% -17.5% -15.1% 2.5% COMMODITIES MARCH 2017 2016 2015 2014 2013 2012 2011 Global commodities, total return (S&P GSCI) USD 2,295.2 -3.9% -5.1% 11.4% -32.9% -33.1% -1.2% 0.1% -1.2% Agriculture, spot return USD 289.1 -5.2% -0.6% 2.6% -12.1% -8.3% -22.1% 3.9% -14.9% Energy, total return USD 393.1 -4.9% -9.6% 18.1% -41.5% -44.1% 5.1% -1.4% 4.9% Crude oil USD 423.2 -7.3% -9.1% 8.0% -45.3% -42.6% 6.0% -11.5% -1.3% Industrial metals, total return USD 1,226.2 -0.9% 9.2% 17.6% -24.5% -7.4% -12.9% 1.4% -22.3% Copper USD 3,564.6 -2.3% 5.3% 17.3% -24.9% -12.7% -7.9% 4.3% -21.5% Livestock, total return USD 1,815.0 1.2% 1.3% -7.3% -18.3% 14.2% -3.6% -4.0% -1.2% Precious metals USD 1,533.2 -0.5% 8.9% 8.4% -11.1% -4.1% -29.8% 6.2% 6.6% Gold, total return USD 667.2 -0.4% 8.2% 7.7% -10.9% -1.7% -28.7% 6.1% 9.6% REAL ESTATE MARCH 2017 2016 2015 2014 2013 2012 2011 All Equity REITS total returns (FTSE NAREIT) USD 16,320.1 -1.6% 2.5% 8.6% 2.8% 28.0% 2.9% 19.7% 8.3% FTSE EPRA NAREIT developed markets, total return USD 4,576.8 -1.4% 2.3% 5.0% 0.1% 15.9% 4.4% 28.7% -5.8% FTSE EPRA NAREIT emerging markets USD 2,213.9 2.0% 12.4% 0.2% 2.5% 15.1% -20.0% 36.1% -28.9% New York home prices USD 185.2 0.0% 0.3% 2.8% 3.7% 2.8% 6.2% -0.3% -3.3% Greater London house price (£) GBP 649,772.0 1.4% 5.5% -0.1% 9.9% 11.7% 10.6% 6.8% 6.4% German house prices EUR 116.5 0.0% 0.4% 8.7% 1.7% 6.6% 3.5% 5.0% 8.4% Moscow prop prices (US$/sqm) USD 2,884.0 1.3% 6.8% 3.6% -32.7% -24.8% -2.6% 6.0% 9.5% Beijing property prices (RMB/sqm) RMB 41,249.0 0.0% 4.9% 32.6% 14.7% -3.2% 30.7% -7.9% 7.9% HEDGE FUNDS MARCH 2017 2016 2015 2014 2013 2012 2011 Global hedge funds USD 1,223.4 0.0% 1.7% 2.5% -3.6% -0.6% 6.7% 3.5% -8.9% Equity hedge funds USD 1,186.6 0.7% 2.7% 0.1% -2.3% 1.4% 11.1% 4.8% -19.1% Event-driven hedge funds USD 1,610.7 0.3% 3.0% 11.1% -6.9% -4.1% 13.9% 6.0% -4.9% CTA funds USD 1,126.8 -1.0% -0.8% -2.9% -2.0% 5.2% -1.8% -1.0% -4.9% Credit hedge funds USD 1,996.2 -0.2% 1.2% 5.0% -4.4% -1.8% 6.9% 7.7% -3.6% Activist hedge funds USD 2,348.7 0.0% 1.9% 9.1% 0.2% 8.5% 19.2% 9.3% -16.9%
- 10. MONTHLY VIEWPOINT From the Chief Investment Officer Marco E Pabst 06 th April 2017 ACPI Investments Ltd. Pegasus House | 37-43 Sackville Street | London W1S 3EH T +44 (0)20 3697 9580 | F +44 (0)20 3697 9501 | E marco.pabst@acpi.com www.acpi.com 10 Performance and valuations of international equity markets Year to Market Rolling 1-yr Rolling 2-yr Rolling 3-yr EPS growth Country date Cap (USDbn)* change change change 2016E 2017E 2017E 2016E 2017E WORLD All Country MSCI MXWD Index 6.1% 49,147 14.6% 4.7% 8.7% 16.3 14.7 11.0% 2.6% 2.7% Developed World MXWO Index 5.4% 40,673 14.1% 5.5% 10.1% 17.0 15.3 10.9% 2.5% 2.7% Emerging World MXEF Index 12.4% 8,474 19.2% -2.5% -3.3% 12.5 11.2 11.5% 2.7% 3.0% AMERICAS US (S&P500) SPX Index 5.1% 21,100 13.9% 13.1% 26.2% 18.2 16.2 12.3% 2.1% 2.2% US (Dow Jones Industrial) INDU Index 4.5% 5,919 16.6% 15.5% 25.8% 17.2 15.6 10.5% 2.5% 2.6% US mid/small cap RTY Index -0.4% 2,255 21.9% 7.3% 17.2% 26.9 21.0 27.9% 1.3% 1.4% Canada SPTSX Index 2.3% 1,746 17.2% 3.6% 8.7% 17.1 15.1 13.3% 2.9% 3.2% Mexico MEXBOL Index 7.8% 299 8.7% 9.7% 21.2% 18.5 15.9 15.8% 2.1% 2.2% Argentina MERVAL Index 22.3% 102 68.7% 80.8% 223.8% 9.1 8.2 11.5% 1.2% Brazil IBOV Index 7.6% 649 32.0% 21.9% 26.8% 12.1 10.9 11.0% 3.6% 4.3% EUROPE Europe SXXP Index 5.2% 10,733 15.0% -4.5% 12.1% 15.5 14.1 9.8% 3.5% 3.7% Germany DAX Index 6.4% 1,245 26.9% 2.1% 26.0% 14.0 12.9 8.6% 2.9% 3.2% France CAC Index 4.7% 1,538 18.8% 0.3% 13.5% 15.0 13.5 11.0% 3.4% 3.6% UK UKX Index 2.6% 2,482 19.0% 7.3% 9.5% 14.8 13.6 8.6% 4.2% 4.5% Spain IBEX Index 11.2% 692 23.9% -10.6% -2.6% 14.8 13.4 10.3% 3.6% 3.9% Italy FTSEMIB Index 5.3% 507 17.5% -13.1% -8.7% 14.0 11.9 17.2% 3.8% 4.2% Switzerland SMI Index 5.1% 1,099 11.2% -5.4% 1.6% 17.4 15.7 10.9% 3.5% 3.7% Norway OBX Index 0.9% 186 24.2% 10.5% 21.4% 15.0 13.1 13.8% 4.4% 4.7% Sweden OMX Index 2.7% 564 15.5% -7.0% 13.8% 16.2 15.0 7.5% 3.8% 4.0% Austria ATX Index 10.2% 83 28.8% 13.3% 11.8% 14.0 12.6 11.2% 3.1% 3.5% Greece ASE Index 4.1% 44 20.9% -13.1% -49.0% 9.3 14.2 -34.9% 8.0% 2.3% EMERGING EUROPE Hungary BUX Index 1.3% 22 23.2% 62.0% 80.1% 11.4 10.5 8.5% 2.8% 3.2% Kazakhstan KZKAK Index 15.7% 13 59.3% 89.2% 49.4% Ukraine PFTS Index 2.7% 1 19.5% -35.7% -30.4% 7.6 Russia RTSI$ Index 0.0% 529 33.5% 18.7% -6.6% 6.3 5.6 12.5% 5.0% 5.7% Poland WIG Index 14.7% 309 25.4% 9.6% 12.7% 12.8 11.8 8.3% 2.5% 3.0% Czech Rep PX Index 6.4% 43 10.9% -6.5% -3.7% 12.6 12.8 -2.2% 4.9% 4.9% Turkey XU100 Index 13.9% 157 9.2% 7.1% 22.7% 8.9 7.5 18.1% 3.3% 3.8% MIDDLE EAST & AFRICA South Africa TOP40 Index 5.1% 576 2.4% 0.2% 6.0% 14.6 13.6 7.1% 3.2% 3.5% Egypt Hermes Index 8.9% 74.8% 52.4% 58.8% 11.5 10.0 15.7% 2.9% 3.8% Namibia FTN098 Index -1.3% 125 11.9% -8.2% -4.0% 9.8 9.9 -0.9% 4.5% 5.0% Nigeria NGSEINDX Index -5.2% 29 0.0% -28.7% -34.2% 21.3% Israel TA-25 Index -4.1% -2.1% -14.1% -0.6% 12.5 11.3 10.2% 1.9% 2.3% Saudi Arabia SASEIDX Index -2.2% 13.5% -18.2% -26.0% 14.5 13.0 11.2% 3.2% 3.5% Qatar DSMIndex 0.3% 4.3% -10.8% -13.5% 13.1 11.5 14.0% 3.8% 4.1% Dubai DFMGI Index 1.2% 6.6% -3.7% -22.1% 10.4 9.2 13.1% 4.3% 4.4% ASIA Asia MXAPEXA Index 14.5% 2,748 26.2% 4.4% 14.7% 12.6 11.4 9.8% 2.5% 2.7% Japan TPX Index -0.9% 5,099 18.7% -3.6% 23.7% 13.7 12.7 8.2% 2.2% 2.3% Japan NKY Index -1.3% 3,028 20.0% -2.8% 25.2% 16.5 15.1 9.6% 1.9% 2.1% Hong Kong HSI Index 10.9% 1,966 20.8% -3.5% 8.4% 12.2 11.1 9.3% 3.4% 3.6% China domestic shashr Index 5.4% 4,397 7.3% -15.4% 58.9% 13.9 12.3 13.6% 2.0% 2.2% China offshore HSCEI Index 10.3% 600 19.6% -18.1% 2.5% 8.3 7.6 9.3% 3.6% 3.9% Taiwan TWSE Index 7.5% 953 16.9% 3.6% 11.9% 13.9 13.1 6.5% 3.9% 4.2% South Korea KOSPI Index 6.6% 1,204 9.6% 5.6% 8.7% 1.7% 1.9% New Zealand NZSE Index 3.8% 78 3.9% 15.5% 26.0% 19.2 17.5 10.2% 4.4% 4.6% Australia AS30 Index 3.4% 1,394 17.7% 0.8% 9.0% 16.4 15.4 6.2% 4.3% 4.4% Pakistan KSE100 Index -0.5% 79 40.2% 49.8% 67.5% 10.9 9.3 18.1% 5.0% 5.6% Thailand SET50 Index 3.7% 286 14.4% -1.7% 5.7% 14.9 13.5 10.2% 3.0% 3.3% Indonesia JCI Index 7.2% 456 16.6% 3.6% 16.9% 16.9 14.9 13.2% 1.9% 2.2% India NIFTY Index 13.2% 997 21.7% 7.0% 38.4% 17.3 14.6 18.3% 1.6% 1.8% Singapore FSSTI Index 10.3% 363 13.0% -8.0% -1.1% 14.6 13.6 7.0% 3.5% 3.6% Malaysia FBMKLCI Index 6.3% 238 1.6% -5.3% -6.0% 16.5 15.5 6.3% 3.2% 3.4% Philippines PCOMP Index 10.9% 176 5.6% -5.8% 15.6% 18.4 16.5 11.2% 1.7% 1.8% Vietnam VNINDEX Index 8.8% 74 27.4% 33.2% 22.0% 14.1 12.1 16.1% 2.6% 2.7% Source(s): ACPI, Bloomberg Data as of: 31-Mar-2017 * Market cap for the main index PER Dividend yield
- 11. MONTHLY VIEWPOINT From the Chief Investment Officer Marco E Pabst 06 th April 2017 ACPI Investments Ltd. Pegasus House | 37-43 Sackville Street | London W1S 3EH T +44 (0)20 3697 9580 | F +44 (0)20 3697 9501 | E marco.pabst@acpi.com www.acpi.com 11 Three-month outlook Highly indebted major World economies are characterised by low GDP growth, low inflation and de-synchronised growth patterns whilst the lack of fiscal stimulus puts the burden on the central banks, keeping interest rates low for a long time to come. Weight Cash We are slightly overweight cash from reductions in fixed income. Equities US Valuations are high but US equities and the dollar serve as safe havens for the time being. Rising wages and the stronger dollar are likely to provide EPS headwinds. Positive sentiment was the missing ingredient to push stocks closer to the tops in this cycle. Europe Whilst valuations are slightly less expensive than in the US, political risks in 2017 are high in Europe with elections in Germany, France and the Netherlands and uncertainties about the Italian banking crisis and Brexit. Japan Japanese equity markets are still amongst the cheapest globally and for as long as yields remain anchored, the market remains attractive, although currency volatility induces substantial equity volatility in the country. China H shares are attractive but local markets are still overvalued with the country undergoing a major transition. The domestic consumer is becoming stronger and savings are rising, helped by pro-growth fiscal support. EM Renewed dollar strength and rising US yields in combination with policy issues (Turkey, India, Brazil,...) are a toxic mix for emerging market investors. Valuations are also not sufficiently cheap in order to justify taking these risks in many countries. Central Banks Central bank policies are now diverging with most CBs still easing whilst the Fed is trying to tighten monetary conditions. This will lead to considerable volatility in equity markets across different regions. FixedIncome DM govt After the correction in DM government bonds in the second half of 2016, yield levels look more attractive than before, especially in the US. In the medium term, yields can rise further as expectations for growth and inflation improve. EM govt The resurgent dollar leads to capital outflows. Dollar bonds of countries with low external debt levels and low/no trade and budget deficits are interesting. The higher the dollar rises, the higher the risk of a crisis in one or more emerging markets. DM credit Spreads have been tightening, supported by recovering commodity prices and a relatively weaker dollar. Spreads in the US are more attractive than in the Eurozone where aggressive ECB action keeps the market at elevated price levels. EM credit We avoid issuers with substantial hard-currency debt relative to the underlying revenue mix. We would stress-test balance sheets against further EM FX deterioration. Spreads for fundamentally strong issuers in hard currency are attractive. Alt FI We like alternative areas of fixed income such as peer-to-peer lending (P2P) and structured credit. P2P lending offers diversified and uncorrelated low double-digit return streams and returns in structured credit are still attractive. Currencies USD It appears unlikely that the Fed will be able to raise policy rates substantially in the near future. Furthermore, the Fed is concerned about excessive dollar strength that caused problems in various areas such as commodities and EM in the past. EUR The ECB is aiming to extend its balance sheet further and to keep rates low for a long time as core economies stagnate. This is EUR negative. The high trade surplus, low inflation and declining ECB impact are EUR positive. Main risks are political in nature. JPY The BoJ has turned less aggressive recently with regards to providing additional monetary stimulus. Growth prospects and inflation are declining. Following recent yen strength we would expect a period of weakness. EM The resurgent dollar and political crises are putting a lid on EM FX performance. Generally speaking, we prefer commodity-rich EM versus commodity importers. We like RUB, MXN and avoid TRY and INR. GBP The GBP cheapened substantially as a result of the Brexit vote. Due to the long timeline of the Brexit process, uncertainty will continue, adding a risk premium to the currency. Commodities Oil The oil market is relatively balanced again and the outlook hinges on demand growth as well as OPEC’s ability to control output. Metals Industrial metals have been supported by the outlook of more reflationary policies and fiscal stimulus, especially in the US. General We believe that after five years of high negative returns, the commodity complex in general could become more attractive again, especially energy and agricultural commodities but also precious metals as a hedge against tail risks.
- 12. MONTHLY VIEWPOINT From the Chief Investment Officer Marco E Pabst 06 th April 2017 ACPI Investments Ltd. Pegasus House | 37-43 Sackville Street | London W1S 3EH T +44 (0)20 3697 9580 | F +44 (0)20 3697 9501 | E marco.pabst@acpi.com www.acpi.com 12 DISCLAIMER This document is provided for informational purposes only. It does not constitute an offer to sell or a solicitation to buy any security or other financial instrument. While based on information believed to be reliable, no guarantee is given that it is accurate or complete. Any investments referred to may not be suitable for the specific investment objectives, financial situation or individual needs of recipients. Reliance should not be placed on the views and information expressed herein when making any individual investment and/or strategic decisions. You should also be aware that the value of investments and any income from them can go down as well as up, and you may not receive back the amount you originally invested. There can be no assurances that appreciation in value of investments will occur, or that currency fluctuations will not affect the outcomes of any investment adversely. Past performance of the index or individual funds is not a guide to future performance. Certain funds invest in emerging markets which by their nature are higher risk and potentially more volatile than those inherent in established markets. This material is for the use of intended recipients only and the contents may not be reproduced, redistributed, or copied in whole or in part for any purpose without the consent of the issuer of this document. Where foreign securities are included in collective investment schemes, there may be additional risks that arise because of events in different jurisdictions. These may include but are not limited to; potential constraints on liquidity and the repatriation of funds, macroeconomic risks, political risks, foreign exchange risks, tax risks, settlement risks and potential limitations on the availability of market information. Issued by ACPI Investment Ltd (Registered in England - Number 03781549, at 37-43 Sackville Street, London, W1S 3EH), which is authorised and regulated by the Financial Conduct Authority (Register Number 192403). Details can be found on the following link www.fca.org.uk/register. © 2017 ACPI Investments Limited. All rights reserved. No part of the website may be reproduced by any means, whether graphically, electronically, mechanically or otherwise howsoever, including without limitation photocopying and recording on magnetic tape, or included in any information store and/or retrieval system without the prior written permission of ACPI Investments Limited. UK – London Pegasus House 37-43 Sackville Street London W1S 3EH United Kingdom T +44 20 3697 9501 Channel Islands – Jersey Third Floor 7 The Esplanade St Helier JE2 3QA T +44 (0)1534 716444 South Africa – Johannesburg 1 st floor Dunkeld Place 12 North Road Dunkeld West 2196 PO Box 411325 Craighall, 2024 T +27 11 771 5315