1. 2016 – Global Market Forces at Play February 2nd
, 2016
Despite… a) continuing weakness in commodities and b) downward revisions to 2016
global growth projections by the IMF, there are reasons to believe that… 1) fears of global
deflation are unwarranted and 2) the major economies remain relatively healthy.
First, supply factors are the main driver behind falling energy and commodity prices,
which in turn have pushed headline inflation lower. However, oil inventories are expected
to have reached a peak, and further rig count decline could occur as marginal suppliers
move offline due to lack of profits. On the demand side, Michael Hasenstab (CIO of
Templeton Global Macro) calls our attention to the fact that “6%+ growth in China still
represent a massive level of global aggregate demand. Together with the new round of
infrastructure investment, it will provide some support to global growth and commodity
markets. Furthermore, China’s sustained wage growth implies that it should gradually
export a more inflationary impulse to the rest of the world.”
Second, profitability measures remain at historically high levels and are likely to persist.
Corporations have enjoyed remarkable flexibility and acted accordingly, with a range of
strategic and shareholder-oriented measures like M&A activity, increased investment and
capital expenditures, dividend growth, and share buybacks. Additionally, input costs are
low (think of the multi-year low energy costs and prices for a wide range of commodities)
and wage price moderate, which are also positive. Global equities should continue to enjoy
tailwinds from easy central bank policies from the ECB and the BOJ.
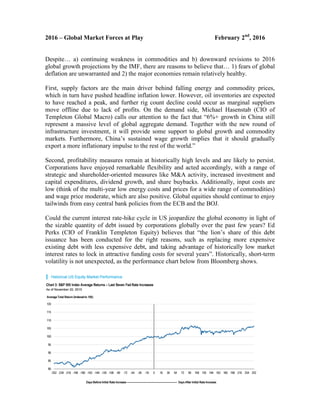
Could the current interest rate-hike cycle in US jeopardize the global economy in light of
the sizable quantity of debt issued by corporations globally over the past few years? Ed
Perks (CIO of Franklin Templeton Equity) believes that “the lion’s share of this debt
issuance has been conducted for the right reasons, such as replacing more expensive
existing debt with less expensive debt, and taking advantage of historically low market
interest rates to lock in attractive funding costs for several years”. Historically, short-term
volatility is not unexpected, as the performance chart below from Bloomberg shows.
2. Today I am more of a numbers person who likes to integrate fundamentals and quantitative
tools into models, but my roots are technical. So, let’s take a look on how the global
picture is unfolding as January of 2016 ends from a technical standpoint.
The most important line in the chart on
right of the FTSE All World Stock Index
is the horizontal line drawn over the 2011
peak near 235. Market corrections often
find support at a prominent peak. In other
words, previous resistance turns into new
support. The 14-week RSI line (top of
chart) is bouncing off oversold territory at
30 for the second time. That slight
"positive divergence" is usually a positive
sign. It may also be significant that the
FAW has retraced half of its 2011-2015
rally. All of which may support more
stabilization in global stocks.
On January 20, the S&P 500 Index hit a new
52-week low. This marked the fourth time
in 15 months that this index has had a major
retest. Here are the exact dates:
- October 15, 2014, at 1820.66.
- August 24, 2015, at 1867.01.
- September 29, 2015, at 1871.91.
- And on January 20, 2016, at 1812.29.
Three of those, including the latest pullback,
were "true retests" given that they occurred
on higher volume. To qualify as a
double/triple bottom, the market needs to
bottom out around the same level. Typically
the final trough shows higher volume, which
creates enough support for a significant
reversal.
Finally, what to make of the chart on the
right? Reuters pointed that Google
searches for "bear market" have just
scored the highest since October 2008. It
is reminiscent of (a modern version of) the
“magazine cover indicator”, a somewhat
irreverent economic indicator and an
interesting sentiment gauge, which usually
means that public interest in a story is
often a contrary indicator.
Marcio Ferracini, CMT