1. Click here for authors’ contact information.
Priced (in USD) as of 10/26/17 market close, EST (unless otherwise stated).
For important disclosures and required non-U.S. analyst disclosures, see page 6.
An old Wall Street adage claims “earnings are the mother’s milk
of stocks.” There is a lot of truth to that, as there is a positive
correlation between the direction of corporate profits and the
stock market.
While over short periods there can be differences between the
two, over the long term the market tends to rally as earnings
advance, and stalls or retreats when earnings do the same.
So with the U.S. stock market drifting higher and higher
almost every day, pushing up against the top of its long-term
bullish trading range, are earnings supporting the advance?
Or is this move merely based on momentum?
We think the data show the market is underpinned by healthy
profit trends.
Another angle
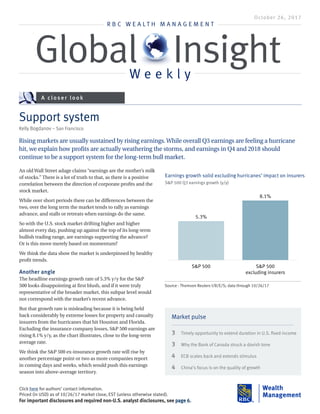
The headline earnings growth rate of 5.3% y/y for the S&P
500 looks disappointing at first blush, and if it were truly
representative of the broader market, this subpar level would
not correspond with the market’s recent advance.
But that growth rate is misleading because it is being held
back considerably by extreme losses for property and casualty
insurers from the hurricanes that hit Houston and Florida.
Excluding the insurance company losses, S&P 500 earnings are
rising 8.1% y/y, as the chart illustrates, close to the long-term
average rate.
We think the S&P 500 ex-insurance growth rate will rise by
another percentage point or two as more companies report
in coming days and weeks, which would push this earnings
season into above-average territory.
Support system
Kelly Bogdanov – San Francisco
October 26, 2017
A closer look
Rising markets are usually sustained by rising earnings.While overall Q3 earnings are feeling a hurricane
hit, we explain how profits are actually weathering the storms, and earnings in Q4 and 2018 should
continue to be a support system for the long-term bull market.
R B C W E A L T H M A N A G E M E N T
Global InsightW e e k l y
Source - Thomson Reuters I/B/E/S; data through 10/26/17
Earnings growth solid excluding hurricanes’ impact on insurers
S&P 500 Q3 earnings growth (y/y)
5.3%
8.1%
S&P 500 S&P 500
excluding insurers
3 Timely opportunity to extend duration in U.S. fixed income
3 Why the Bank of Canada struck a dovish tone
4 ECB scales back and extends stimulus
4 China’s focus is on the quality of growth
Market pulse
2. 2 | Global Insight Weekly
October 26, 2017 | RBC Wealth Management
So far, the Q3 earnings beat rate is in line with the robust
readings of the past four quarters and above the long-term
average. Revenue beats are running well ahead of recent
and longer-term trends—good signs. And S&P 500 revenue
growth, at 4.7% y/y, is pacing close to the GDP growth rate
plus inflation.
On a sector basis, earnings of economically sensitive
companies (cyclicals) have been sturdy. This affirms the
recent pickup in the U.S. and global economies. Management
guidance has been constructive—meaning economic
momentum can persist.
Industrials are a bright spot. For example, Caterpillar, 3M, and
Stanley Black & Decker beat consensus forecasts handily and
issued optimistic forward guidance. Companies so sensitive
to economic gyrations usually don’t post strong quarters
unless the U.S. and global economies are on solid footing.
Banking industry results were good. The top 20 banks posted
median core earnings growth of 14% y/y on 5.6% revenue
growth, modest loan growth, strong credit quality, and a slight
expansion in net interest margins, according to RBC Capital
Markets. Our analysts believe the large banks are actually
overcapitalized—what a turnabout from the financial crisis.
A deluge of Tech earnings reports is about to hit. The Tech
firms that have released results so far, like Texas Instruments,
are signaling it should be a positive reporting season for the
sector.
The framework is in place
The S&P 500 and mid- and small-cap indexes seem well
positioned to grow earnings again in Q4 and 2018 given
the U.S. economy’s durable upswing and synchronized
expansions in other major economies, all of which are
accompanied by low recession risks.
U.S. corporate profits and revenues should continue to rise so
long as the domestic economy expands at least at an average
pace and the Federal Reserve focuses on normalizing interest
rates rather than restricting credit outright.
The S&P 500’s 2018 consensus earnings growth forecast of
11.6% could pull back moderately into the high single digits.
It’s normal at this stage of the cycle for analysts to pare back
estimates toward year end and early in the new year. Even
so, at this stage, we believe the S&P 500 is well positioned to
grow earnings in the high single digits next year, which should
support the long-term bull market. If corporate tax cuts pass,
the 2018 profit growth potential could jump to double digits.
While a consolidation period or pullback would be normal
for the market following such a strong rally, we believe a
Market Weight position in U.S. equities is still warranted as
our positive long-term thesis remains intact. Earnings growth
should continue to be “mother’s milk” for the market.
Source - Thomson Reuters I/B/E/S; data through 10/26/17
Growth is expected to rebound in coming quarters
S&P 500 quarterly earnings growth (y/y) - actual in gray; consensus
estimates in blue
-8%
-4%
0%
4%
8%
12%
16%
Q1
Q2
Q3
Q4
Q1
Q2
Q3
Q4
Q1
Q2
Q3
Q4
Q1
Q2
Q3
Q4
Q1
Q2
2014 2015 2016 2017 2018
Hurricanes holding back
Q3 earnings growth
Source - Thomson Financial, FactSet, Standard & Poor’s, national research
correspondent; data through 10/26/17
Q3 revenues rising at a rate close to GDP growth plus inflation
S&P 500 quarterly revenue growth (y/y) - actual in gray; consensus
estimate in blue
1.8%
-2.7%
-3.3%
-4.5%-4.1%
-2.1%
-0.4%
3.0%
4.5%
7.5%
5.1% 4.7%
Q4
Q1
Q2
Q3
Q4
Q1
Q2
Q3
Q4
Q1
Q2
Q3
2014 2015 2016 2017
Source - Thomson Reuters I/B/E/S; data through 10/26/17
This year, earnings could increase the most since 2011
S&P 500 y/y earnings growth - actual in gray; consensus estimates in blue
14.7%
6.1% 5.7%
8.3%
-1.1%
0.5%
11.1% 11.6%
9.3%
2011 2012 2013 2014 2015 2016 2017E 2018E 2019E
3. 3 | Global Insight Weekly
October 26, 2017 | RBC Wealth Management
at a gradual pace. In past cycles, the 10-year yield has
peaked alongside the peak in the Fed Funds rate, and with
the Fed currently projecting a longer-run Fed Funds rate of
just 2.75%, we see limited upside in yields from here.
• Long-duration bonds tend to outperform when the
Fed raises rates. Over the last four tightening cycles
(2015-to-date included), extending duration has been
a winning trade, with the 7- to 10-year corporate index
outperforming the 3- to 5-year corporate index by an
average of 100 bps. We think that will be the case again as
this gradual tightening cycle progresses.
Canada
Diana Di Luca – Toronto
• As the market expected, the Bank of Canada (BoC) held
its overnight rate unchanged at 1.00%. The statement
accompanying the rate decision and Monetary Policy
Report were more dovish than expected. The economy is
undoubtedly improving and the composition of growth is
trending in the right direction, but the pace at which the
BoC is raising interest rates appears to be much slower
than previously expected. This is due, in part, to the slack
that the BoC currently estimates in the labour market
as well as its expectation that the economy will “remain
close to potential over the next two years,” which is less
inflationary than if the economy was operating in a
significant excess aggregate demand position.
• The BoC also recognizes that there are a number of
potential headwinds to the Canadian economy, none
more so than the impact of rising interest rates on
household balance sheets. The bank stated that NAFTA
renegotiation talks create “substantial uncertainty”
although it is very difficult to plan for the outcome of the
talks. All that said, it appears that the BoC’s tightening
cycle will be slow and gradual and we recommend
remaining focused on shorter and intermediate bond
maturities until material curve steepening occurs in
Canada.
• The TSX Preferred Share Index rose to a fresh year-to-
date high during the week, and is currently trading at its
highest level since July 2015. The preferred share rally has
not kept pace with the move in the 5-year Government
of Canada yield following the September rate hike (up 25
basis points since the July rate hike). If the preferred share
market does catch up with the move higher in rates, we
believe rate-reset issues trading well below their CA$25 par
values will lead the move higher.
United States
Craig Bishop & Sam Renikoff – Minneapolis
Tom Garretson – New York
• After an uneventful summer in the bond market that
saw Treasury market volatility dip to an all-time low, the
10-year yield has finally broken out of its historically
tight seven-month 2.10%–2.40% trading range to around
2.45%. The 10-year yield is now nearly 45 basis points
(bps) higher than the September lows when geopolitical
tensions briefly pushed it near the 2.00% mark. Since then,
hawkish rhetoric by major central banks, rising global
growth, and sturdy U.S. economic data have lifted yields
across the curve.
• We have long targeted the 2.40% mark as a threshold to
extend duration in fixed income portfolios. Therefore, with
the market moving above that level, we are shifting our
view on the yield curve from Neutral to being slightly
long duration, with a specific target of 7–10 years. Based
on current Barclays index levels, extending from 5–7 years
to 7–10 gives investors an extra 30 bps of yield by adding
just 1.33 years of duration. We continue to think the 10-
year Treasury yield’s 2017 high of 2.63% will hold over the
intermediate term.
• While the wave of concern surrounding the removal of
monetary policy accommodation has spooked some
investors and contributed to the rise in yields, we
maintain our view that limited inflationary pressures and
moderate economic growth will keep the Fed and other
major central banks normalizing interest rate policies
Source - RBC Wealth Management, Bloomberg; data through 10/25/17
With 10-year yield above 2.40%, target 7-10Y duration
1.0%
1.2%
1.4%
1.6%
1.8%
2.0%
2.2%
2.4%
2.6%
2.8%
May '16 Aug '16 Nov '16 Feb '17 May '17 Aug '17
Target 7- to 10-yr duration
Target 5- to 7-yr duration
Target 3- to 5-yr duration
10-year yield
4. 4 | Global Insight Weekly
October 26, 2017 | RBC Wealth Management
Europe
Frédérique Carrier & Thomas McGarrity – London
• The European Central Bank (ECB) maintained its dovish
bias as it announced its eagerly anticipated decision on
tapering of quantitative easing (QE) at its Governing
Council meeting. The ECB will continue its asset purchase
programme beyond the end of 2017 at a reduced rate
of €30B per month from January 2018 until the end of
September 2018 “or beyond, if necessary.” The current
monthly purchase pace of €60B will continue until the end
of December 2017.
• The ECB also confirmed it would reinvest maturing
bonds for “as long as necessary” while interest rates will
remain at their present level well past the end of QE, and
until the inflation path has sustainably adjusted towards
its aim (i.e., below, but close to, 2%). While the taper
was broadly in line with the market consensus, the euro
slipped back against other major currencies on the back
of the announcement on the prospect of rates staying at
historically low levels for even longer.
• Euro strength in Q3 had been raised as headwind for
quarterly earnings results in the region. However, while
several companies have flagged forex as a drag on
revenues in Q3, it has not resulted in broad-based misses
so far. This is likely a reflection, in our view, of the strong
underlying domestic and global economic backdrop.
• Although the euro area flash IHS/Markit composite
Purchasing Managers’ Index fell back to 55.9 in October
from 56.7 the previous month, versus consensus
expectations of 56.5, the reading suggests economic
momentum in the region remains robust. Extrapolating
this month’s reading over the quarter, RBC Capital
Markets’ GDP indicator is pointing to growth of 0.6% q/q
in Q4. We maintain a preference for companies exposed to
the domestic European economy.
• The first estimate of U.K. Q3 GDP reported growth of 0.4%
q/q, ahead of the market consensus of 0.3%, helped by an
upward revision to service sector activity in July. This figure
increased market expectations to over 90% for a 25 basis
point hike to the U.K. base rate, from 0.25% to 0.50% in
November.
A sia Paci fi c
Yufei Yang – Hong Kong
• Japanese Prime Minister Shinzo Abe won a majority for
his party in parliamentary elections, sending Japanese
shares to their highest level in 20 years. The victory
boosted Abe’s chances of winning another three-year term
next September as Japan’s ruling party leader. And with a
change in party rules, Abe could extend his premiership
to 2021, strengthening his hand in adopting pro-growth
economic policies.
• China’s 19th Party Congress ended on October 24. As
expected, President Xi Jinping was re-elected as General
Secretary of the Central Committee of the Communist Party
of China, the party’s highest post. Apart from President
Xi and Premier Li Keqiang, five of the seven members
of the Politburo Standing Committee were replaced. Xi
emphasized the importance of quality and balanced
development rather than a pure growth target. We believe
that the “new economy” industries, such as technology,
consumers, health care, high-end manufacturing, and
environmental protection, will continue to outperform
over the long run.
• In general, the Congress is politically focused and lacks
in detailed policies. More specific policies for 2018 will be
discussed and announced at the annual Central Economic
Working Conference in early December and the National
People’s Congress next March. A detailed structural reform
blueprint for the next five years is likely to be unveiled at
the third plenum of the Party Congress in late 2018.
• China’s economy remained stable in Q3. GDP growth
slowed slightly to 6.8% from 6.9% in the first half.
Industrial output and retail sales both beat expectations
in September, while fixed-asset investment missed. New
home prices in September rose in 44 of 70 cities tracked
by the government, less than August’s 46 cities. During the
Party Congress, President Xi reiterated that “housing is for
living, not for speculation.” China is seeking to introduce
more long-term mechanisms (such as a nationwide
property tax or more rental housing supply) to stabilize its
property market.
Source - RBC Wealth Management, ECB; data through 10/26/17
The ECB announces asset purchases in line with expectations
New asset purchase programme for 2018
$0B
$20B
$40B
$60B
Nov '17 Jan '18 Mar '18 May '18 Jul '18 Sep '18
New purchase pace
Purchase pace prior to meeting
5. 5 | Global Insight Weekly
October 26, 2017 | RBC Wealth Management
Data as of October 26, 2017
Source - Bloomberg. Note: Equity returns do not include dividends, except for the German DAX and Brazilian Ibovespa. Bond yields in local currencies. Copper
Index data and U.S. fixed income returns as of Wednesday’s close. Dollar Index measures USD vs. six major currencies. Currency rates reflect market convention
(CAD/USD is the exception). Currency returns quoted in terms of the first currency in each pairing. Data as of 8:35 pm GMT 10/26/17.
Examples of how to interpret currency data: CAD/USD 0.77 means 1 Canadian dollar will buy 0.77 U.S. dollar. CAD/USD 4.6% return means the Canadian dollar
rose 4.6% vs. the U.S. dollar year to date. USD/JPY 114.03 means 1 U.S. dollar will buy 114.03 yen. USD/JPY -2.5 % return means the U.S. dollar fell 2.5% vs. the
yen year to date.
Commodities (USD) Price MTD YTD 1 yr 2 yr
Gold (spot $/oz) 1,267.49 -1.0% 10.0% 0.0% 9.0%
Silver (spot $/oz) 16.79 0.9% 5.5% -4.7% 5.9%
Copper ($/metric ton) 6,983.75 8.6% 26.4% 47.6% 34.3%
Oil (WTI spot/bbl) 52.64 1.9% -2.0% 7.0% 19.7%
Oil (Brent spot/bbl) 59.45 3.3% 4.6% 18.9% 25.1%
Natural Gas ($/mmBtu) 2.90 -3.7% -22.2% 6.0% 40.4%
Govt bonds (bps chg) Yield MTD YTD 1 yr 2 yr
U.S. 10-Yr Tsy 2.459% 12.5 1.5 66.6 40.3
Canada 10-Yr 2.034% -6.5 31.3 87.4 59.1
U.K. 10-Yr 1.384% 1.9 14.5 23.2 -44.6
Germany 10-Yr 0.415% -4.9 20.7 33.0 -8.5
Fixed Income (returns) Yield MTD YTD 1 yr 2 yr
U.S. Aggregate 2.65% -0.3% 2.8% 0.3% 4.4%
U.S. Invest Grade Corp 3.20% -0.1% 5.1% 2.6% 9.6%
U.S. High Yield Corp 5.40% 0.4% 7.5% 8.2% 19.9%
Currencies Rate MTD YTD 1 yr 2 yr
U.S. Dollar Index 94.6620 1.7% -7.4% -4.0% -2.3%
CAD/USD 0.7782 -3.0% 4.6% 4.1% 2.4%
USD/CAD 1.2850 3.0% -4.4% -4.0% -2.3%
EUR/USD 1.1654 -1.4% 10.8% 6.8% 5.4%
GBP/USD 1.3156 -1.8% 6.6% 7.4% -14.3%
AUD/USD 0.7662 -2.2% 6.3% 0.1% 5.7%
USD/JPY 114.0300 1.4% -2.5% 9.2% -5.8%
EUR/JPY 132.9000 0.0% 8.1% 16.6% -0.8%
EUR/GBP 0.8859 0.4% 3.8% -0.5% 23.0%
EUR/CHF 1.1628 1.6% 8.5% 7.3% 6.9%
USD/SGD 1.3675 0.7% -5.5% -1.7% -1.8%
USD/CNY 6.6426 -0.2% -4.4% -1.9% 4.6%
USD/MXN 19.1894 5.1% -7.4% 2.7% 16.1%
USD/BRL 3.2973 4.3% 1.3% 5.0% -15.6%
MARKET SCORECARD
Equities (local currency) Level MTD YTD 1 yr 2 yr
S&P 500 2,560.40 1.6% 14.4% 19.7% 23.6%
Dow Industrials (DJIA) 23,400.86 4.4% 18.4% 28.6% 32.8%
NASDAQ 6,556.77 0.9% 21.8% 24.9% 30.2%
Russell 2000 1,497.46 0.4% 10.3% 24.3% 29.1%
S&P/TSX Comp 15,891.63 1.6% 4.0% 7.3% 15.2%
FTSE All-Share 4,111.40 1.5% 6.1% 8.9% 17.1%
STOXX Europe 600 391.27 0.8% 8.3% 14.5% 4.1%
EURO STOXX 50 3,637.20 1.2% 10.5% 18.1% 6.5%
Hang Seng 28,202.38 2.4% 28.2% 20.9% 22.0%
Shanghai Comp 3,407.57 1.8% 9.8% 9.3% -0.6%
Nikkei 225 21,739.78 6.8% 13.7% 25.0% 14.7%
India Sensex 33,147.13 6.0% 24.5% 19.1% 21.1%
Singapore Straits Times 3,356.25 4.2% 16.5% 18.7% 8.9%
Brazil Ibovespa 75,896.35 2.2% 26.0% 18.9% 60.8%
Mexican Bolsa IPC 48,992.15 -2.7% 7.3% 2.5% 8.8%
UPCOMING EVENTS
The dates reflect North American time zones. All data reflect Bloomberg consensus forecasts where available.
Fri, Oct 27 Mon, Oct 30, cont. Tue, Oct 31, cont. Wed, Nov 1, cont.
ECB Survey of Professional Forecasters Germany CPI Eurozone Unemployment Rate U.S. ADP Employment (185K)
U.S. Q3 GDP (2.6% q/q, annualized) U.K. Consumer Confidence Eurozone Q3 GDP U.S. ISM Manuf. PMI (59.0)
U.S. Personal Consump. (2.1% q/q, annl’zd) U.S. Personal Income (0.4% m/m) Eurozone CPI U.S. Markit Manufacturing PMI
U.S. Core PCE (1.3% q/q, annualized) U.S. Personal Spending (0.8% m/m) U.S. Conf. Board Consumer Conf. (120.8) Canada Markit Manuf. PMI
U.S. Univ. of Michigan Sentiment (100.7) U.S. Core PCE (0.1% m/m) Canada August GDP Thu, Nov 2
Mon, Oct 30 Tue, Oct 31 Wed, Nov 1 China Caixin Comp./Services PMI
China NBS Manufacturing PMI (52.2) China Caixin Manufacturing PMI U.K. Nationwide House Price (0.2% m/m) Eurozone Markit Manuf. PMI
China NBS Non-Manufacturing PMI BoJ Meeting U.K. Markit Manufacturing PMI BoE Meeting
Eurozone Economic/Consumer Confidence Japan Nikkei Manufacturing PMI Fed Meeting Germany Markit Manuf. PMI
6. 6 | Global Insight Weekly
October 26, 2017 | RBC Wealth Management
Authors
Analyst Certification
All of the views expressed in this report accurately reflect the
personal views of the responsible analyst(s) about any and all
of the subject securities or issuers. No part of the compensation
of the responsible analyst(s) named herein is, or will be, directly
or indirectly, related to the specific recommendations or views
expressed by the responsible analyst(s) in this report.
Important Disclosures
In the U.S., RBC Wealth Management operates as a division of RBC
Capital Markets, LLC. In Canada, RBC Wealth Management includes,
without limitation, RBC Dominion Securities Inc., which is a foreign
affiliate of RBC Capital Markets, LLC. This report has been prepared
by RBC Capital Markets, LLC. which is an indirect wholly-owned
subsidiary of the Royal Bank of Canada and, as such, is a related
issuer of Royal Bank of Canada.
Non-U.S. Analyst Disclosure: Diana Di Luca and Yufei Yang,
employees of RBC Wealth Management USA’s foreign affiliate
RBC Dominion Securities Inc.; and Frédérique Carrier and Thomas
McGarrity, employees of RBC Wealth Management USA’s foreign
affiliate Royal Bank of Canada Investment Management (U.K.)
Limited; contributed to the preparation of this publication.
These individuals are not registered with or qualified as research
analysts with the U.S. Financial Industry Regulatory Authority
(“FINRA”) and, since they are not associated persons of RBC Wealth
Management, they may not be subject to FINRA Rule 2241 governing
communications with subject companies, the making of public
appearances, and the trading of securities in accounts held by
research analysts.
In the event that this is a compendium report (covers six or more
companies), RBC Wealth Management may choose to provide
important disclosure information by reference. To access current
Kelly Bogdanov – San Francisco, United States
kelly.bogdanov@rbc.com; RBCCapital Markets, LLC
Craig Bishop – Minneapolis, United States
craig.bishop@rbc.com; RBCCapital Markets, LLC
Tom Garretson, CFA – New York, United States
tom.garretson@rbc.com; RBCCapital Markets, LLC
Sam Renikoff – Minneapolis, United States
sam.renikoff@rbc.com; RBCCapital Markets, LLC
Diana Di Luca – Toronto, Canada
diana.diluca@rbc.com; RBC Dominion Securities Inc.
Frédérique Carrier – London, United Kingdom
frederique.carrier@rbc.com; Royal Bank of Canada Investment Management (U.K.) Ltd.
Thomas McGarrity, CFA – London, United Kingdom
thomas.mcgarrity@rbc.com; Royal Bank of Canada Investment Management (U.K.) Ltd.
Yufei Yang – Hong Kong, China
yufei.yang@rbc.com; RBC Dominion Securities Inc.
D isclosures and Disclaimer
disclosures, clients should refer to http://www.rbccm.com/
GLDisclosure/PublicWeb/DisclosureLookup.aspx?EntityID=2 to view
disclosures regarding RBC Wealth Management and its affiliated
firms. Such information is also available upon request to RBC Wealth
Management Publishing, 60 South Sixth St, Minneapolis, MN 55402.
References to a Recommended List in the recommendation history
chart may include one or more recommended lists or model
portfolios maintained by RBC Wealth Management or one of its
affiliates. RBC Wealth Management recommended lists include the
Guided Portfolio: Prime Income (RL 6), the Guided Portfolio: Dividend
Growth (RL 8), the Guided Portfolio: ADR (RL 10), and the Guided
Portfolio: All Cap Growth (RL 12), and former lists called the Guided
Portfolio: Large Cap (RL 7), the Guided Portfolio: Midcap 111 (RL 9),
and the Guided Portfolio: Global Equity (U.S.) (RL 11). RBC Capital
Markets recommended lists include the Strategy Focus List and the
Fundamental Equity Weightings (FEW) portfolios. The abbreviation
‘RL On’ means the date a security was placed on a Recommended
List. The abbreviation ‘RL Off’ means the date a security was removed
from a Recommended List.
Distribution of Ratings
For the purpose of ratings distributions, regulatory rules require
member firms to assign ratings to one of three rating categories
- Buy, Hold/Neutral, or Sell - regardless of a firm’s own rating
categories. Although RBC Capital Markets, LLC ratings of Top Pick
(TP)/Outperform (O), Sector Perform (SP) and Underperform (U) most
closely correspond to Buy, Hold/Neutral and Sell, respectively, the
meanings are not the same because our ratings are determined on a
relative basis (as described below).
Explanation of RBC Capital Markets, LLC Equity Rating System
An analyst’s “sector” is the universe of companies for which the
analyst provides research coverage. Accordingly, the rating assigned
to a particular stock represents solely the analyst’s view of how that
stock will perform over the next 12 months relative to the analyst’s
sector average. Although RBC Capital Markets, LLC ratings of Top Pick
(TP)/Outperform (O), Sector Perform (SP), and Underperform (U) most
closely correspond to Buy, Hold/Neutral and Sell, respectively, the
meanings are not the same because our ratings are determined on a
relative basis (as described below).
Ratings:
Top Pick (TP): Represents analyst’s best idea in the sector; expected
to provide significant absolute total return over 12 months with a
favorable risk-reward ratio. Outperform (O): Expected to materially
outperform sector average over 12 months. Sector Perform (SP):
Returns expected to be in line with sector average over 12 months.
Underperform (U): Returns expected to be materially below sector
average over 12 months.
As of September 30, 2017
Rating Count Percent Count Percent
Buy [Top Pick & Outperform] 859 52.92 294 34.23
Hold [Sector Perform] 660 40.67 154 23.33
Sell [Underperform] 104 6.41 7 6.73
Investment Banking Services
Provided During Past 12 Months
Distribution of Ratings - RBC Capital Markets, LLC Equity Research
7. 7 | Global Insight Weekly
October 26, 2017 | RBC Wealth Management
Risk Rating:
As of March 31, 2013, RBC Capital Markets, LLC suspends its Average
and Above Average risk ratings. The Speculative risk rating reflects a
security’s lower level of financial or operating predictability, illiquid
share trading volumes, high balance sheet leverage, or limited
operating history that result in a higher expectation of financial and/
or stock price volatility.
Valuation and Risks to Rating and Price Target
When RBC Wealth Management assigns a value to a company in a
research report, FINRA Rules and NYSE Rules (as incorporated into
the FINRA Rulebook) require that the basis for the valuation and
the impediments to obtaining that valuation be described. Where
applicable, this information is included in the text of our research
in the sections entitled “Valuation” and “Risks to Rating and Price
Target”, respectively.
The analyst(s) responsible for preparing this research report received
compensation that is based upon various factors, including total
revenues of RBC Capital Markets, LLC, and its affiliates, a portion of
which are or have been generated by investment banking activities of
the member companies of RBC Capital Markets, LLC and its affiliates.
Other Disclosures
Prepared with the assistance of our national research sources.
RBC Wealth Management prepared this report and takes sole
responsibility for its content and distribution. The content may have
been based, at least in part, on material provided by our third-party
correspondent research services. Our third-party correspondent
has given RBC Wealth Management general permission to use
its research reports as source materials, but has not reviewed or
approved this report, nor has it been informed of its publication. Our
third-party correspondent may from time to time have long or short
positions in, effect transactions in, and make markets in securities
referred to herein. Our third-party correspondent may from time to
time perform investment banking or other services for, or solicit
investment banking or other business from, any company mentioned
in this report.
RBC Wealth Management endeavors to make all reasonable efforts
to provide research simultaneously to all eligible clients, having
regard to local time zones in overseas jurisdictions. In certain
investment advisory accounts, RBC Wealth Management will act as
overlay manager for our clients and will initiate transactions in the
securities referenced herein for those accounts upon receipt of this
report. These transactions may occur before or after your receipt of
this report and may have a short-term impact on the market price of
the securities in which transactions occur. RBC Wealth Management
research is posted to our proprietary Web sites to ensure eligible
clients receive coverage initiations and changes in rating, targets,
and opinions in a timely manner. Additional distribution may be done
by sales personnel via e-mail, fax, or regular mail. Clients may also
receive our research via third-party vendors. Please contact your RBC
Wealth Management Financial Advisor for more information regarding
RBC Wealth Management research.
Conflicts Disclosure: RBC Wealth Management is registered with the
Securities and Exchange Commission as a broker/dealer and an
investment adviser, offering both brokerage and investment advisory
services. RBC Wealth Management’s Policy for Managing Conflicts of
Interest in Relation to Investment Research is available from us on
our Web site at http://www.rbccm.com/GLDisclosure/PublicWeb/
DisclosureLookup.aspx?EntityID=2. Conflicts of interests related to
our investment advisory business can be found in Part II of the Firm’s
Form ADV or the Investment Advisor Group Disclosure Document.
Copies of any of these documents are available upon request
through your Financial Advisor. We reserve the right to amend or
supplement this policy, Part II of the ADV, or Disclosure Document at
any time.
The authors are employed by one of the following entities: RBC
Wealth Management USA, a division of RBC Capital Markets, LLC, a
securities broker-dealer with principal offices located in Minnesota
and New York, USA; by RBC Dominion Securities Inc., a securities
broker-dealer with principal offices located in Toronto, Canada;
by RBC Investment Services (Asia) Limited, a subsidiary of RBC
Dominion Securities Inc., a securities broker-dealer with principal
offices located in Hong Kong, China; and by Royal Bank of Canada
Investment Management (U.K.) Limited, an investment management
company with principal offices located in London, United Kingdom.
Research Resources
This document is produced by the Global Portfolio Advisory
Committee within RBC Wealth Management’s Portfolio Advisory
Group. The RBC WM Portfolio Advisory Group provides support
related to asset allocation and portfolio construction for the firm’s
Investment Advisors / Financial Advisors who are engaged in
assembling portfolios incorporating individual marketable securities.
The Committee leverages the broad market outlook as developed by
the RBC Investment Strategy Committee, providing additional tactical
and thematic support utilizing research from the RBC Investment
Strategy Committee, RBC Capital Markets, and third-party resources.
Third-party disclaimers
The Global Industry Classification Standard (“GICS”) was developed by and is
the exclusive property and a service mark of MSCI Inc. (“MSCI”) and Standard
& Poor’s Financial Services LLC (“S&P”) and is licensed for use by RBC. Neither
MSCI, S&P, nor any other party involved in making or compiling the GICS or any
GICS classifications makes any express or implied warranties or representations
with respect to such standard or classification (or the results to be obtained by
the use thereof), and all such parties hereby expressly disclaim all warranties of
originality, accuracy, completeness, merchantability and fitness for a particular
purpose with respect to any of such standard or classification. Without limiting
any of the foregoing, in no event shall MSCI, S&P, any of their affiliates or any
third party involved in making or compiling the GICS or any GICS classifications
have any liability for any direct, indirect, special, punitive, consequential or any
other damages (including lost profits) even if notified of the possibility of such
damages.
References herein to “LIBOR”, “LIBO Rate”, “L” or other LIBOR abbreviations
means the London interbank offered rate as administered by ICE Benchmark
Administration (or any other person that takes over the administration of such
rate).
Disclaimer
The information contained in this report has been compiled by RBC Wealth
Management, a division of RBC Capital Markets, LLC, from sources believed to
be reliable, but no representation or warranty, express or implied, is made by
Royal Bank of Canada, RBC Wealth Management, its affiliates or any other person
as to its accuracy, completeness or correctness. All opinions and estimates
contained in this report constitute RBC Wealth Management’s judgment as of
the date of this report, are subject to change without notice and are provided
in good faith but without legal responsibility. Past performance is not a guide