Monthly Viewpoint from CIO, Marco Pabst - June 2017
•
1 like•231 views

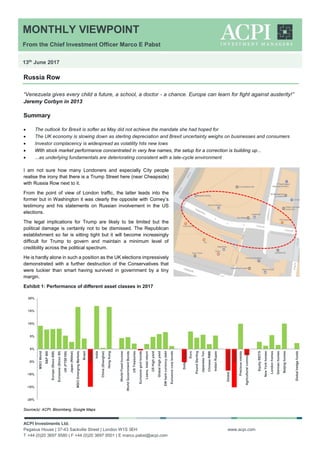
• The outlook for Brexit is softer as May did not achieve the mandate she had hoped for • The UK economy is slowing down as sterling depreciation and Brexit uncertainty weighs on businesses and consumers • Investor complacency is widespread as volatility hits new lows • With stock market performance concentrated in very few names, the setup for a correction is building up... • ...as underlying fundamentals are deteriorating consistent with a late-cycle environment

Recommended
Recommended
More Related Content
What's hot
What's hot (14)
Similar to Monthly Viewpoint from CIO, Marco Pabst - June 2017
Similar to Monthly Viewpoint from CIO, Marco Pabst - June 2017 (20)
Recently uploaded
Recently uploaded (20)
Monthly Viewpoint from CIO, Marco Pabst - June 2017
- 1. MONTHLY VIEWPOINT From the Chief Investment Officer Marco E Pabst 13th June 2017 ACPI Investments Ltd. Pegasus House | 37-43 Sackville Street | London W1S 3EH T +44 (0)20 3697 9580 | F +44 (0)20 3697 9501 | E marco.pabst@acpi.com www.acpi.com Russia Row “Venezuela gives every child a future, a school, a doctor - a chance. Europe can learn for fight against austerity!” Jeremy Corbyn in 2013 Summary The outlook for Brexit is softer as May did not achieve the mandate she had hoped for The UK economy is slowing down as sterling depreciation and Brexit uncertainty weighs on businesses and consumers Investor complacency is widespread as volatility hits new lows With stock market performance concentrated in very few names, the setup for a correction is building up... ...as underlying fundamentals are deteriorating consistent with a late-cycle environment I am not sure how many Londoners and especially City people realise the irony that there is a Trump Street here (near Cheapside) with Russia Row next to it. From the point of view of London traffic, the latter leads into the former but in Washington it was clearly the opposite with Comey’s testimony and his statements on Russian involvement in the US elections. The legal implications for Trump are likely to be limited but the political damage is certainly not to be dismissed. The Republican establishment so far is sitting tight but it will become increasingly difficult for Trump to govern and maintain a minimum level of credibility across the political spectrum. He is hardly alone in such a position as the UK elections impressively demonstrated with a further destruction of the Conservatives that were luckier than smart having survived in government by a tiny margin. Exhibit 1: Performance of different asset classes in 2017 Source(s): ACPI, Bloomberg, Google Maps -20% -15% -10% -5% 0% 5% 10% 15% 20% MSCIWorld S&P500 Europe(Stoxx600) Eurozone(Stoxx50) UK(FTSE100) Japan(Nikkei) MSCIEmergingMarkets Brasil Russia India China(Shanghai) HongKong WorldFixedIncome WorldGovernmentBonds USTreasuries Eurozonegovtbonds Loans,totalreturn USHighyield GlobalHighyield EMhardcurrencydebt Eurozonecorpbonds Dollarindex Euro PoundSterling JapaneseYen ChineseRMB IndianRupee Globalcommodities Energy Preciousmetals Agriculturalcommods EquityREITS NewYorkhomes Londonhomes Germanhomes Beijinghomes Globalhedgefunds
- 2. MONTHLY VIEWPOINT From the Chief Investment Officer Marco E Pabst 13th June 2017 ACPI Investments Ltd. Pegasus House | 37-43 Sackville Street | London W1S 3EH T +44 (0)20 3697 9580 | F +44 (0)20 3697 9501 | E marco.pabst@acpi.com www.acpi.com The hung parliament, a possibility that had been discussed towards the end of the election campaigns, is now a reality. The political gambles of Cameron on Brexit and May on a landslide mandate have both backfired spectacularly, casting serious doubt on the Tories which is likely to end up in a protracted infighting within the party in search for leadership and direction. At that stage, it is difficult to say who will ultimately benefit from this situation but the probabilities of another election within a year or two and May resigning have risen substantially. She is under fire from outside her party but also from within and it appears unlikely that she will survive one full term at this stage. Obviously, Labour getting closer to power and especially with Corbyn as the front runner, is a scary prospect that will weigh on UK assets and the Sterling for the time being. Slightly balancing that is the outlook for Brexit which now appears somewhat less hard. On one hand, this is because the Conservatives have to compromise on many of their positions in order to get things done and on the other it is because the Europeans can and will cast doubt on the unity of the UK government, challenging the mandate that the future Prime Minister has. This will lead to very protracted negotiations that may not end up with any useful results anytime soon. This has been my base case for some time irrespective of this particular election result assuming that no deal will be in place in the foreseeable future and a process that may well take ten years or more to conclude. Exhibit 2: Pre and post Brexit GBP trading channels Source(s): ACPI, Bloomberg In terms of investment implications the main impact will be seen in the GBP where I have always felt that the 'old' fair value assumptions have to be thrown overboard as the currency will be permanently impaired with a Brexit discount (of 10-15 points). Now, one can add to this an additional 'political uncertainty' discount of another 5 points which leads to a new middle-of-the- range value of around 1.25/1.30 (~1.45 pre Brexit minus 15-20 points) which is where the market is trading at the moment. Around this central level, the currency is likely to establish, or rather continue in, a trading range of between five and ten points, which implies that levels below 1.20 are a tactical buy and above 1.35 would be a sell for the time being. There is not much that would substantially alter this perspective unless a strong government comes to power and the outlook on Brexit becomes clearer. UK equities are to some extent a derivative of currency moves, i.e. a large-scale devaluation drives share prices up and vice versa but from a fundamental point of view, there is not much that will change as a result of the election. Status quo prevails. How important it is to make considerations on whether or not to hedge a currency can be seen in the chart below. Whilst the FTSE 100 in headline terms for the UK investor (before dividends) is more than 10% above its pre-financial crisis high, an unhedged USD investor would still be approximately 30% below that level.
- 3. MONTHLY VIEWPOINT From the Chief Investment Officer Marco E Pabst 13th June 2017 ACPI Investments Ltd. Pegasus House | 37-43 Sackville Street | London W1S 3EH T +44 (0)20 3697 9580 | F +44 (0)20 3697 9501 | E marco.pabst@acpi.com www.acpi.com Exhibit 3: UK FTSE 100 stock index in GBP (top) and USD (bottom panel) Source(s): ACPI, Bloomberg With regards to rates, the election result is somewhat neutral with a dovish bias but the Gilt outlook primarily depends on the inflation and growth outlook rather than the current impasse in parliament and the former are not pointing to strongly rising yields at the moment. We still like select credit exposure in the UK due to an attractive risk premium and resulting high carry. It should be noted, however, that the retail climate in the country appears to continue to deteriorate as a result of rising wages and continued uncertainty about the post-Brexit outlook. Exhibit 4: UK wages and CPI inflation (lhs) and food price inflation versus UK car registrations (rhs) Source(s): ACPI, Bloomberg Although wage growth in the UK staged a comeback in 2015 and 2016 even in real terms, this momentum is now waning and purchasing power is crimped by rising inflation as the effect of last year’s sterling depreciation is finding its way through the domestic economy. Increases in prices for essential items such as food are crowding out non-food sales which are stagnating
- 4. MONTHLY VIEWPOINT From the Chief Investment Officer Marco E Pabst 13th June 2017 ACPI Investments Ltd. Pegasus House | 37-43 Sackville Street | London W1S 3EH T +44 (0)20 3697 9580 | F +44 (0)20 3697 9501 | E marco.pabst@acpi.com www.acpi.com at the moment. Sales of higher priced items such as electrical appliances and cars are declining as consumers are paring back spending. Macro aggregates such as services PMI, industrial production or construction output for the UK are already reflecting a rather dire outlook for the remainder of the year. Exhibit 5: Industrial production and construction output growth in the UK undershoot expectations Source(s): WSJ Purely from a statistical point of view, we should expect to see year-on-year peak inflation around July/August of this year, however, I suspect that this environment might last well into year-end as many businesses did not immediately pass on higher purchasing prices to the consumer last year. As such, we may not experience a rapid decline of inflation as this basis effect washes out, compared to the effect observed from rising and then declining energy prices in 2016 and 2017. Over the past months, numerous restaurant chains and retailers have warned on profits, citing rising costs as a result of inflation and Brexit. For instance, restaurant operator Comptoir Group (Comptoir Libanais) issued a profit warning in early June listing higher food and drinks costs as a result of sterling depreciation as well as rising rents and business rates as reasons for the shortfall. In addition, the business experienced a decline in like-for-like sales at mature restaurants within the group. Earlier this year, Jamie Oliver’s ‘Jamie’s Italian’ announced the closure of several restaurants amid tough trading conditions and rising input costs as a result of the sterling decline. Several other chains issued similar comments over the past months and this pressure is unlikely to dissipate anytime soon. Many other consumer-facing businesses such as New Look and Topps Tiles issued cautious trading statements, warning of a deteriorating environment. This is in addition to the continued malaise in the real estate sector where average property prices are sluggish and high-end properties find it difficult to attract buyers. Returning to the Global context, a bull market in complacency is what best describes the current state of the investment world. Following a fairly rocky 2015/16, investors continue to embrace the new goldilocks environment of low inflation and pro-business political agendas across most large economies. Donald Trump’s continued struggle to be taken seriously by anyone, let alone make progress on his election promises is balanced by declining yields and relatively robust growth in the US, the Euro zone and many emerging markets.
- 5. MONTHLY VIEWPOINT From the Chief Investment Officer Marco E Pabst 13th June 2017 ACPI Investments Ltd. Pegasus House | 37-43 Sackville Street | London W1S 3EH T +44 (0)20 3697 9580 | F +44 (0)20 3697 9501 | E marco.pabst@acpi.com www.acpi.com Exhibit 6: Volatility of US markets and the percentage of bearish investors in the US are close to multi-year lows Source(s): ACPI, Bloomberg In financial market terms, volatility has been collapsing and as the bull market ground higher, the number of bearish investors reached very low levels. On the macro front, there is indeed not much to be too concerned about at the moment although the lack of any headwinds is usually not great for investors who should be careful what they wish for. The continued absence of any meaningful volatility and the narrow leadership in equity markets, where, in the case of the US, 13% of stocks by market capitalisation drove almost 40% of market returns, is sowing the seeds for trouble in the future as imbalances continue to grow and to fester. Exhibit 7: Performance of several sectors versus the S&P500 this year Source(s): ACPI, Bloomberg
- 6. MONTHLY VIEWPOINT From the Chief Investment Officer Marco E Pabst 13th June 2017 ACPI Investments Ltd. Pegasus House | 37-43 Sackville Street | London W1S 3EH T +44 (0)20 3697 9580 | F +44 (0)20 3697 9501 | E marco.pabst@acpi.com www.acpi.com Consistent with this picture of the tide that lifts all boats is the puzzling fact that almost all asset classes are making money for investors. Thus, gold, bonds, stocks and bitcoins are going up at the same time and each seems to reflect a somewhat different scenario – inflation, deflation, risk on and risk off, all at the same time. It looks like Mr Market is suffering from a strong cognitive dissonance at the moment and unable to correct it. Exhibit 8: Growth in commercial and industrial loans in the US and recessionary periods Source(s): ACPI, Bloomberg As a result, investors feel overly safe with their positions, stop challenging their investment theses and, inevitably over time, accumulate more risk than they should at this point in the cycle. As markets are slowly grinding higher, downside risk increases as late-cycle multiples should be lower and not higher than valuations observed in a mid-cycle environment. The performance concentration in just a few mega-cap stocks benefits holders of passive ETFs whilst active managers in the long-only and hedge fund world have now crowded into these same names for the fear of missing out on performance. Exhibit 9: Active managers are overweight tech stocks Source(s): Bloomberg Active funds are currently 32% overweight in IT stocks and overweight a staggering 71% in FANG stocks. Therefore, underlying market breadth is not as healthy as it seems on the surface.
- 7. MONTHLY VIEWPOINT From the Chief Investment Officer Marco E Pabst 13th June 2017 ACPI Investments Ltd. Pegasus House | 37-43 Sackville Street | London W1S 3EH T +44 (0)20 3697 9580 | F +44 (0)20 3697 9501 | E marco.pabst@acpi.com www.acpi.com The fact that large sectors such as autos, retail and financials seem to be past their peak, indicates that one needs to be vigilant to look out for signs of intermediate market tops. Whilst the negative relative performance of some of these sectors is a correction of the strong advance seen last year, some of it can now also be attributed to a genuine deterioration of underlying fundamental factors. Car registrations appear to have peaked and delinquencies in car loans are spiking higher. The financial sector is dogged by a flattening yield curve driven by a return of a disinflationary environment but also falling loan growth which is typically associated with periods of recessions (see Exhibit 8). So far, the losers of the years past such as emerging markets celebrate a comeback of mean reversion this year, having risen almost 17% in dollar and 12% in local currency terms. This should not deter from the fact that investors in the region are still 20% away from the highs put in place in 2011. The average annual return since 1st January 2007 from investing in the MSCI emerging market index does not even reach 1% which is before churn and fees, which would put the average investor solidly into negative territory over that period of time. By contrast, the NASDAQ 100 index delivered an average annual return of over 12% since 2007, outpacing most other markets. 17 years after the dotcom bubble, it appears that most investors, who got involved in it, are either retired by now or blessed with fading memories. Everyone else is new to the party and it is fascinating to observe how light-heartedly they are embracing these investments. We will see train wrecks in the not too distant future, that’s for sure, and some fairly large ones too, I would add. One fad is chasing another and commentators and retail investors are not getting tired of blowing one sub sector bubble after another ranging from 3D printing, mobile security, internet of things, autonomous driving to artificial intelligence and others. The pattern is always the same: in the absence of attractive absolute valuations, a theme needs to be created that justifies an otherwise ludicrous price level. As the higher valuation generates a high-market cap company, the cycle almost becomes self- fulfilling until, of course, some events pop the bubble and interest disappears in a jiffy as tourist investors leave the party. Recent price action in the infamous FAANG (Facebook, Amazon, Apple, Netflix, Google) stocks is indicating that sector performance has run hot and a consolidation is overdue. Whether or not Trump manages to reinvigorate his reform agenda, the US economy looks increasingly late cycle as evidenced by a number of statistics. Unemployment is slowly reaching the floor of where the ‘natural unemployment rate’ would be. Monthly non-farm payroll additions have been declining over the past months and reached 138k in May, substantially below an expectation of 182k new jobs whilst April figures were revised downward to 174k from initially reported 211k. Exhibit 10: Jobs growth in the US is decelerating markedly Source(s): ACPI, Bloomberg
- 8. MONTHLY VIEWPOINT From the Chief Investment Officer Marco E Pabst 13th June 2017 ACPI Investments Ltd. Pegasus House | 37-43 Sackville Street | London W1S 3EH T +44 (0)20 3697 9580 | F +44 (0)20 3697 9501 | E marco.pabst@acpi.com www.acpi.com This is significantly below the average monthly jobs figure since 2011 and also the three-month average is now at the lowest level since 2012. So far, job growth continues to be relatively non-inflationary as average hourly earnings growth slowed to 2.5% in May, down from a high of 2.9% in December. This throws into question the willingness of the Fed to continue their monetary tightening programme. The market does not seem convinced that Yellen will hike more than one more time this year. Yield curves have been flattening ever since the post- election months last year. The 10year-2year US yield curve is now just slightly above 80bps from over 260bps in 2014 and ~130bps following Trump’s election victory. In other words, the US curve is now almost as flat as it was right before the financial crisis in the US. Our hunch would be that the Fed will hike one more time this year, simply because Yellen has talked herself into this corner, but then find it increasingly difficult to justify further hawkish action. Year-to-date, the S&P500 had four days with moves of more than 1%, which is probably around one fifth of what we would normally have seen by that time of the year. Combining this with exceptionally high investor complacency and, as a result, extremely low volatility and the fact that investors made money every month since the end of last year, we get a setup that looks increasingly ripe for a correction. Furthermore, the early summer months tend to produce rather low returns in stock markets, historically speaking, which poses another hurdle for markets to climb over. For the time being, the trend is our friend and whilst we are vigilant with regards to protecting portfolios we believe it would be counter-productive to reduce risk too fast and too early. Keeping upside potential and paying insurance premium to protect from some of the downside risk is therefore the appropriate position in our opinion. Exhibit 11: Average monthly returns for the US stock market Source(s): ACPI, Bloomberg 1.2% -0.1% 0.6% 1.2% -0.1% 0.7% 1.5% 0.7% -1.1% 0.4% 0.6% 1.5% -2.0% -1.0% 0.0% 1.0% 2.0% 3.0% 4.0% January February March April May June July August September October November December Since 1928 Since 1981 Since 2009
- 9. MONTHLY VIEWPOINT From the Chief Investment Officer Marco E Pabst 13th June 2017 ACPI Investments Ltd. Pegasus House | 37-43 Sackville Street | London W1S 3EH T +44 (0)20 3697 9580 | F +44 (0)20 3697 9501 | E marco.pabst@acpi.com www.acpi.com Global economic monitor Source(s): ACPI, Bloomberg Dec Jan Feb Mar Apr May Trend Citi Economic Surprise US 23.3 31.8 34.7 48.0 -4.8 -38.2 Citi Economic Surprise G10 33.0 36.9 41.9 41.8 26.1 2.0 Citi Economic Surprise Europe 53.1 55.3 71.1 54.1 70.4 40.6 Citi Economic Surprise EM 18.1 37.1 46.6 34.4 39.5 7.4 Citi Economic Surprise UK 49.6 69.8 92.3 60.8 0.4 -15.1 ISM manufacturing 54.5 56.0 57.7 57.2 54.8 54.9 ISM new orders 60.5 59.5 63.15 61.7 60.35 58.6 Global manufacturing PMI 53.6 53.9 53.4 53.7 53.6 53.7 China manufacturing PMI 51.4 51.3 51.6 51.8 51.2 51.2 Japan manufacturing PMI 52.4 52.7 53.3 52.4 52.7 53.1 US durable goods orders 0.3 0.3 1.4 2.4 -0.8 US initial jobless claims 241 250 227 235 238 255 US Industrial production 0.8 -0.3 0.2 0.4 1.0 Euro Industrial production -1.0 0.2 -0.1 -0.1 Japan Industrial production 0.7 -2.1 3.2 -1.9 4.0 US retail sales 0.9 0.5 -0.2 0.1 0.4 Euro retail sales -0.4 0.1 0.6 0.2 0.1 Japan retail sales 0.7 1.0 0.2 2.1 3.2 China retail sales 10.9 10.9 10.7 US consumer confidence 113.3 111.6 116.1 124.9 119.4 117.9 Euro consumer confidence -5.2 -4.9 -6.4 -5.1 -3.6 -3.3 ifo German business expectations 105.3 103.1 104.0 105.4 105.2 106.5 China export trade -6.2 7.6 -1.5 16.4 8.0 8.7 South Korea export trade 6.4 11.2 20.2 13.6 24.1 13.4 German export trade 3.3 5.7 6.1 4.7 5.7 China monthly money supply 11.3 11.3 11.1 10.6 10.5 US personal income 0.2 0.6 0.5 0.2 0.4
- 10. MONTHLY VIEWPOINT From the Chief Investment Officer Marco E Pabst 13th June 2017 ACPI Investments Ltd. Pegasus House | 37-43 Sackville Street | London W1S 3EH T +44 (0)20 3697 9580 | F +44 (0)20 3697 9501 | E marco.pabst@acpi.com www.acpi.com The Global PMI heatmap Source(s): ACPI, Bloomberg Country/RegionCategory/SectorMay-2017Apr-2017Mar-2017Feb-2017Jan-2017Dec-2016Nov-2016Oct-2016Sep-2016Aug-2016Jul-2016Jun-2016May-2016Apr-2016Mar-2016Feb-2016Jan-2016Dec-2015Nov-2015Oct-2015Sep-2015Aug-2015Jul-2015Jun-2015May-2015 AustriaManufacturing58.058.156.857.257.356.355.453.953.552.153.454.552.052.052.851.951.250.651.453.052.550.552.451.250.3 BrazilComposite50.450.448.746.644.745.245.344.946.144.446.442.338.339.040.839.045.143.944.542.742.744.840.841.042.9 BrazilManufacturing52.050.149.646.944.045.246.246.346.045.746.043.241.642.646.044.547.445.643.844.147.045.847.246.545.9 BrazilServices49.250.347.746.445.145.144.443.945.342.745.641.437.337.438.636.944.443.545.543.041.744.839.139.942.5 CanadaManufacturing55.155.955.554.753.551.851.551.150.351.151.951.852.152.251.549.449.347.548.648.048.649.450.851.349.8 ChinaComposite51.551.252.152.652.253.552.952.951.451.851.950.350.550.851.349.450.149.450.549.948.048.850.250.651.2 ChinaManufacturing49.650.351.251.751.051.950.951.250.150.050.648.649.249.449.748.048.448.248.648.347.247.347.849.449.2 ChinaServices52.851.552.252.653.153.453.152.452.052.151.752.751.251.852.251.252.450.251.252.050.551.553.851.853.5 CzechRepublicManufacturing56.457.557.557.655.753.852.253.352.050.149.351.853.353.654.355.556.955.654.254.055.556.657.556.955.5 DevelopedMarketsManufacturing54.154.153.954.154.253.752.952.651.551.251.451.150.350.550.950.852.152.052.352.651.751.952.151.752.1 DevelopedMarketsServices54.254.153.953.654.553.854.053.651.751.551.351.551.852.351.751.253.353.954.854.253.955.254.754.454.9 DevelopedMarketsComposite54.354.354.154.054.654.054.053.751.951.751.551.551.451.951.751.253.253.754.654.053.654.654.454.054.5 EgyptWholeEconomy47.347.445.946.743.342.841.842.046.347.048.947.547.646.944.548.148.048.245.047.250.251.249.250.249.9 EmergingMarketsComposite52.251.952.652.151.951.951.551.851.151.351.550.049.549.950.549.050.149.550.249.849.049.850.250.050.8 EmergingMarketsManufacturing50.550.851.651.350.851.150.851.050.350.150.349.349.549.650.248.949.449.049.249.048.448.649.149.949.8 EmergingMarketsServices52.952.252.352.052.151.550.951.051.051.251.550.649.149.950.048.950.849.550.250.449.950.751.249.851.3 EuropeanUnionComposite56.356.756.155.654.654.954.153.652.953.051.852.953.152.853.353.054.054.554.554.253.554.554.554.954.1 EuropeanUnionManufacturing56.856.755.955.355.355.053.553.452.951.951.452.751.451.551.751.452.453.052.852.652.052.352.652.652.3 EuropeanUnionServices55.756.355.755.053.954.454.153.352.352.851.552.753.452.953.353.254.154.554.654.353.654.754.855.454.4 EurozoneComposite56.856.856.456.054.454.453.953.352.652.953.253.153.153.053.153.053.654.354.253.953.654.353.954.253.6 EurozoneManufacturing57.056.756.255.455.254.953.753.552.651.752.052.851.551.751.651.252.353.252.852.352.052.352.452.552.2 EurozoneRetail52.052.749.549.950.150.448.648.649.651.048.948.550.647.949.250.148.949.048.551.351.951.454.250.451.4 EurozoneServices56.356.456.055.553.753.753.852.852.252.852.952.853.353.153.153.353.654.254.254.153.754.454.054.453.8 EurozoneConstruction53.252.553.552.250.752.351.449.449.148.648.346.548.447.549.051.350.349.448.747.848.847.247.146.047.2 FranceComposite56.956.656.855.954.153.151.451.652.751.950.149.650.950.250.049.350.250.151.052.651.950.251.553.352.0 FranceManufacturing53.855.153.352.253.653.551.751.849.748.348.648.348.448.049.650.250.051.450.650.650.648.349.650.749.4 FranceRetail53.351.849.451.753.150.447.347.549.153.051.651.050.648.245.548.148.946.647.851.949.649.552.948.948.7 FranceServices57.256.757.556.454.152.951.651.453.352.350.549.951.650.649.949.250.349.851.052.751.950.652.054.152.8 FranceConstruction53.552.753.251.550.150.650.347.547.845.344.842.343.841.642.744.643.042.244.843.844.242.340.638.440.0 GermanyComposite57.456.757.156.154.855.255.055.152.853.355.354.454.553.654.054.154.555.555.254.254.155.053.753.752.6 GermanyManufacturing59.558.258.356.856.455.654.355.054.353.653.854.552.151.850.750.552.353.252.952.152.353.351.851.951.1 GermanyRetail55.056.252.551.250.352.049.651.053.054.152.051.654.051.054.152.549.550.549.652.454.054.757.754.055.8 GermanyServices55.455.455.654.453.454.355.154.250.951.754.453.755.254.555.155.355.056.055.654.554.154.953.853.853.0 GermanyConstruction55.354.656.454.152.054.953.952.952.451.651.650.452.753.455.859.657.955.552.551.852.450.350.650.750.8 GreeceManufacturing49.648.246.747.746.649.348.348.649.250.448.750.448.449.749.048.450.050.248.147.343.339.130.246.948.0 HongKongWholeEconomy50.551.149.949.649.950.349.548.249.349.047.245.447.245.345.546.446.146.446.646.645.744.448.249.247.6 IndiaComposite52.551.352.350.749.447.649.155.452.454.652.451.150.952.854.351.253.351.650.252.651.552.652.049.251.2 IndiaManufacturing51.652.552.550.750.449.652.354.452.152.651.851.750.750.552.451.151.149.150.350.751.252.352.751.352.6 IndiaServices52.250.251.550.348.746.846.754.552.054.751.950.351.053.754.351.454.353.650.153.251.351.850.847.749.6 IndonesiaManufacturing50.651.250.549.350.449.049.748.750.950.448.451.950.650.950.648.748.947.846.947.847.448.447.347.847.1 IrelandComposite58.758.756.957.859.358.455.554.054.856.956.559.259.158.160.759.561.159.260.257.759.559.761.860.960.8 IrelandManufacturing55.955.053.653.855.555.753.752.151.351.750.253.051.552.654.952.954.354.253.353.653.853.656.754.657.1 IrelandServices59.561.159.160.661.059.156.054.656.259.759.561.261.759.862.862.164.061.863.660.162.462.163.463.361.4 IrelandConstruction#N/A61.360.857.955.758.959.862.358.758.461.059.755.956.462.368.863.658.655.556.355.856.559.165.763.3 ItalyComposite55.256.854.254.852.852.953.451.151.151.952.252.650.853.152.453.753.856.054.353.953.455.053.554.053.7 ItalyManufacturing55.156.255.755.053.053.252.250.951.049.851.253.552.453.953.552.253.255.654.954.152.753.855.354.154.8 ItalyRetail45.548.345.145.545.647.948.846.545.043.240.340.245.242.646.649.447.950.247.748.851.748.750.746.748.3 ItalyServices55.156.252.954.152.452.353.351.050.752.352.051.949.852.151.253.853.655.353.453.453.354.652.053.452.5 ItalyConstruction49.048.649.049.949.250.248.545.945.147.746.944.947.245.345.846.147.248.647.346.448.548.049.247.049.3 JapanComposite53.452.652.952.252.352.852.051.348.949.850.149.049.248.949.951.052.652.252.352.351.252.951.551.551.6 JapanManufacturing53.152.752.453.352.752.451.351.450.449.549.348.147.748.249.150.152.352.652.652.451.051.751.250.150.9 JapanServices53.052.252.951.351.952.351.850.548.249.650.449.450.449.350.051.252.451.551.652.251.453.751.251.851.5 LebanonWholeEconomy46.647.546.947.747.747.046.943.845.145.045.544.444.844.145.047.449.147.946.947.148.147.849.349.348.0 MexicoManufacturing51.250.751.550.650.850.251.151.851.950.950.651.153.652.453.253.152.252.453.053.052.152.452.952.053.3 NetherlandsManufacturing57.657.857.858.356.557.357.055.753.453.553.252.052.752.653.651.752.453.453.553.753.053.956.056.255.5 PolandManufacturing52.754.153.554.254.854.351.950.252.251.550.351.852.151.053.852.850.952.152.152.250.951.154.554.352.4 RussiaComposite56.055.356.355.458.356.655.853.753.152.953.553.551.251.350.850.648.447.850.549.050.949.350.949.551.6 RussiaManufacturing52.450.852.452.554.753.753.652.451.150.849.551.549.648.048.349.349.848.750.150.249.147.948.348.747.6 SaudiArabiaWholeEconomy55.356.556.457.056.755.555.053.255.356.656.054.454.854.254.554.453.954.456.355.756.558.757.756.157.0 SouthAfricaWholeEconomy50.250.350.750.551.351.650.850.550.749.849.949.650.247.947.049.149.649.149.647.547.949.348.949.250.1 SouthKoreaManufacturing49.249.448.449.249.049.448.048.047.648.650.150.550.150.049.548.749.550.749.149.149.247.947.646.147.8 SpainComposite57.257.356.857.054.755.555.254.454.154.853.755.754.855.255.154.555.355.256.255.054.658.858.355.858.3 SpainManufacturing55.454.553.954.855.655.354.553.352.351.051.052.251.853.553.454.155.453.053.151.351.753.253.654.555.8 SpainServices57.357.857.457.754.255.055.154.654.756.054.156.055.455.155.354.154.655.156.755.955.159.659.756.158.4 TaiwanManufacturing53.154.456.254.555.656.254.752.752.251.851.050.548.549.751.149.450.651.749.547.846.946.147.146.349.3 TurkeyManufacturing53.551.752.349.748.747.748.849.848.347.047.647.449.448.949.250.350.952.250.949.548.849.350.149.050.2 UnitedArabEmiratesWholeEconomy54.356.156.256.055.355.054.253.354.154.755.353.454.052.854.553.152.753.354.554.056.057.155.854.756.4 UnitedKingdomComposite54.456.254.853.855.256.755.354.853.853.547.452.553.252.153.652.855.855.255.855.253.455.256.757.556.0 UnitedKingdomManufacturing56.757.354.354.855.556.053.554.555.353.448.152.350.749.751.351.052.451.352.554.851.451.752.251.452.2 UnitedKingdomServices53.855.855.053.354.556.255.254.552.652.947.452.353.552.353.752.755.655.555.954.953.355.657.458.556.5 UnitedKingdomConstruction56.053.152.252.552.254.252.852.652.349.245.946.051.252.054.254.255.057.855.358.859.957.357.158.155.9 UnitedStatesManufacturing52.752.853.354.255.054.354.153.451.552.052.951.350.750.851.551.352.451.252.854.153.153.053.853.654.0 UnitedStatesServices53.653.152.853.855.653.954.654.852.351.051.451.451.352.851.349.753.254.356.154.855.156.155.754.856.2 UnitedStatesComposite53.653.253.054.155.854.154.954.952.351.551.851.250.952.451.350.053.254.055.955.055.055.755.754.656.0 VietnamManufacturing51.654.154.654.251.952.454.051.752.952.251.952.652.752.350.750.351.551.349.450.149.551.352.652.254.8 WorldComposite53.753.653.753.453.953.653.253.151.751.551.751.150.951.351.350.752.352.353.252.752.453.453.352.853.2 WorldManufacturing52.652.753.053.052.752.752.051.951.050.751.050.450.150.250.750.050.950.751.051.050.450.550.850.951.1 WorldServices53.853.653.653.054.053.553.152.951.651.351.651.351.251.751.350.852.652.653.653.253.154.454.053.353.8 The table shows monthly PMI statistics across countries and different sectors per country for the past two years. The latest data is next to the country/sector name at the bottom of the page. 2012 Eurozone crisis Brazil in recession Italy’s permanent recession Improving picture in the UK and US EM recovery
- 11. MONTHLY VIEWPOINT From the Chief Investment Officer Marco E Pabst 13th June 2017 ACPI Investments Ltd. Pegasus House | 37-43 Sackville Street | London W1S 3EH T +44 (0)20 3697 9580 | F +44 (0)20 3697 9501 | E marco.pabst@acpi.com www.acpi.com The World in Numbers Source(s): ACPI, Bloomberg Date PMI CPI (%) Disc rate % Ind Prodyoy% Exports ($M) Imports ($M) Trade bal ($M) M2 ($bn) M2 mom% Unempl % Date GDP yoy% 30/11/2016 57.2 1.7 0.5 -0.43 124,050 193,186 -69,136 13,145 4.6 30/06/2016 1.3 31/12/2016 53.9 2.10 0.75 0.83 126,945 185,608 -58,663 13,181 0.3% 4.7 30/09/2016 1.7 31/01/2017 50.3 2.5 0.75 0.02 118,802 187,628 -68,826 13,260 0.6% 4.8 31/12/2016 2 28/02/2017 57.4 2.7 0.75 0.4 119,827 170,966 -51,139 13,299 0.3% 4.7 31/03/2017 2 31/03/2017 57.7 2.4 1 1.54 136,035 196,378 -60,343 13,381 0.6% 4.5 30/04/2017 58.3 2.2 1 2.19 124,014 187,840 -63,826 13,431 0.4% 4.4 31/05/2017 59.4 1.00 4.3 Date PMI CPI (%) Disc rate % Ind Prodyoy% Exports ($bn) Imports ($bn) Trade bal ($bn) M2 (RMBbn) M2 mom% Date GDP yoy% 30/11/2016 51.7 2.3 1.50 6.2 193.56 150.48 43.1 153,043 30/06/2016 6.7 31/12/2016 51.4 2.1 1.50 6.0 209.1 169.47 39.6 155,007 1.3% 30/09/2016 6.7 31/01/2017 51.3 2.5 1.50 7.6 182.3 131.56 50.7 157,595 1.7% 31/12/2016 6.8 28/02/2017 51.6 0.8 1.50 6.5 119.82 129.18 -9.4 158,291 0.4% 31/03/2017 6.9 31/03/2017 51.8 0.9 1.50 180.59 156.7 23.9 159,961 1.1% 30/04/2017 51.2 1.2 1.50 179.99 141.96 38.0 159,633 -0.2% 31/05/2017 51.2 1.5 1.50 191 150.2 40.8 Date PMI CPI (%) Disc rate % Ind Prodyoy% Exports (€bn) Imports (€bn) Trade bal (€bn) M2 EZ (€bn) M2 EZ mom% Unempl % Date GDP yoy% 30/11/2016 54.3 0.8 0.00 2.5 103.64 82.74 20.9 10,659,459 6.0 30/06/2016 1.8 31/12/2016 55.6 1.7 0.00 0.0 101.5 82.86 18.6 10,732,153 0.7% 6.0 30/09/2016 1.7 31/01/2017 56.4 1.9 0.00 -0.4 103.98 85.07 18.9 10,732,102 0.0% 5.9 31/12/2016 1.8 28/02/2017 56.8 2.2 0.00 2.0 104.96 83.78 21.2 10,767,213 0.3% 5.9 31/03/2017 1.7 31/03/2017 58.3 1.6 0.00 2.2 105.35 85.53 19.8 10,856,991 0.8% 5.8 30/04/2017 58.2 2 0.00 2.9 106.34 86.59 19.8 10,924,247 0.6% 5.8 31/05/2017 59.5 1.5 0.00 5.7 Date PMI CPI (%) Disc rate % Ind Prodyoy% Exports,GBPM Imports,GBPM Trade bal (GBPM) M2 (GBPM) M2 mom% Unempl % Date GDP yoy% 30/11/2016 53.5 1.2 0.25 2.3 49,079 51,403 -2,324 1,626,467 4.8 30/06/2016 1.7 31/12/2016 56 1.6 0.25 4.3 49,817 51,650 -1,833 1,639,588 0.8% 4.8 30/09/2016 2 31/01/2017 55.5 1.8 0.25 3.0 49,025 51,768 -2,743 1,619,627 -1.2% 4.7 31/12/2016 1.9 28/02/2017 54.8 2.3 0.25 2.4 48,525 51,161 -2,636 1,620,520 0.1% 4.7 31/03/2017 2.0 31/03/2017 54.3 2.3 0.25 1.4 49,844 53,740 -3,896 1,646,036 1.6% 4.6 30/04/2017 57.3 2.7 0.25 -0.8 49,816 51,866 -2,050 1,650,277 0.3% 31/05/2017 56.7 0.25 Date CPI (%) Disc rate % Ind Prodyoy% Exports,JPYbn Imports,JPYbn Trade bal (JPYbn) M2 (JPY TRN) M2 mom% Unempl % Date GDP yoy% 30/11/2016 0.5 4.4 5,956 5,810 147 951 3.1 30/06/2016 0.9 31/12/2016 0.3 3.1 6,679 6,043 636 959 0.8% 3.1 30/09/2016 1.1 31/01/2017 0.4 3.2 5,422 6,514 -1,092 961 0.3% 3 31/12/2016 1.6 28/02/2017 0.3 4.7 6,347 5,536 811 958 -0.3% 2.8 31/03/2017 1.3 31/03/2017 0.2 3.5 7,230 6,619 610 962 0.4% 2.8 30/04/2017 0.4 5.7 6,329 5,848 481 971 1.0% 2.8 31/05/2017 974 4.5 Date CPI (%) Disc rate % Ind Prodyoy% Exports ($M) Imports ($M) Trade bal ($M) M3 (INR 10M) M2 mom% Date GDP yoy% 30/11/2016 3.6 6.25 5.7 20,010 33,018 -13,009 12,175,870 30/06/2016 7.6 30/12/2016 3.4 6.25 2.6 23,885 34,254 -10,369 12,044,950 -1.1% 30/09/2016 6.8 31/01/2017 3.2 6.25 3.8 22,115 31,956 -9,841 12,156,100 0.9% 31/12/2016 6.7 28/02/2017 3.7 6.25 1.9 24,490 33,387 -8,896 12,308,280 1.3% 31/03/2017 5.6 31/03/2017 3.9 6.25 2.7 29,232 39,669 -10,437 12,839,080 4.3% 28/04/2017 3.0 6.25 24,635 37,884 -13,249 12,620,590 -1.7% 31/05/2017 6.25 12,722,950 0.8% INDIA US CHINA GERMANY UK JAPAN
- 12. MONTHLY VIEWPOINT From the Chief Investment Officer Marco E Pabst 13th June 2017 ACPI Investments Ltd. Pegasus House | 37-43 Sackville Street | London W1S 3EH T +44 (0)20 3697 9580 | F +44 (0)20 3697 9501 | E marco.pabst@acpi.com www.acpi.com Performance of different asset classes Source(s): ACPI, Bloomberg EQUITIES Currency APRIL 2017 2016 2015 2014 2013 2012 2011 MSCI World USD 1,911.7 1.8% 9.2% 5.3% -2.7% 2.9% 24.1% 13.2% -7.6% MSCI World (EUR hedged) EUR 147.4 1.0% 6.6% 5.6% -0.2% 7.4% 25.4% 12.0% -7.8% MSCI World (GBP hedged) GBP 760.4 1.1% 7.0% 6.0% -0.1% 7.9% 26.5% 12.6% -7.9% MSCI World (USD hedged) USD 506.2 1.2% 7.4% 7.2% 0.1% 7.6% 26.1% 13.1% -23.3% MSCI World local Local 539.0 1.3% 7.7% 6.8% -0.7% 7.2% 22.9% 13.2% -8.5% US (S&P500) USD 2,411.8 1.2% 7.7% 9.5% -0.7% 11.4% 29.6% 13.4% 0.0% Europe (Stoxx 600) EUR 390.0 0.7% 7.9% -1.2% 6.8% 4.4% 17.4% 14.4% -11.3% Eurozone (Euro Stoxx 50) EUR 3,554.6 -0.1% 8.0% 0.7% 3.8% 1.2% 17.9% 13.8% -17.0% Germany (DAX30) EUR 12,615.1 1.4% 9.9% 6.9% 9.6% 2.7% 25.5% 29.0% -14.7% UK (FTSE 100) GBP 7,520.0 4.4% 5.3% 14.4% -4.9% -2.7% 14.4% 5.8% -5.5% France (CAC40) EUR 5,283.6 0.3% 8.7% 4.9% 8.5% -0.5% 18.0% 15.2% -16.9% Greece (ASE) EUR 775.2 8.9% 20.4% 1.9% -23.6% -28.9% 28.0% 33.4% -51.9% Spain (IBEX) EUR 10,880.0 1.5% 16.3% -2.0% -7.2% 3.7% 21.4% -4.7% -13.1% Italy (MIB) EUR 20,731.7 0.6% 7.8% -10.2% 12.7% 0.2% 16.6% 7.8% -25.2% Japan (Nikkei 225) JPY 19,650.6 2.4% 2.8% 0.4% 9.1% 7.1% 56.7% 22.9% -17.9% MSCI Emerging Markets USD 1,005.3 2.8% 16.6% 8.6% -17.0% -4.6% -5.0% 15.1% -20.4% MSCI Emerging Markets local Local 53,534.3 2.3% 12.3% 7.1% -8.0% 2.5% 0.9% 13.9% -14.9% MSCI Asia ex Japan USD 618.5 4.1% 20.2% 2.9% -11.3% 2.2% 0.7% 19.4% -19.2% MSCI Eastern Europe USD 145.2 -3.7% -1.1% 33.0% -8.1% -40.0% -2.9% 13.2% -23.3% MSCI Latin America USD 2,532.3 -2.6% 8.2% 27.9% -32.9% -14.8% -15.7% 5.4% -21.9% Russia (MICEX) RUB 1,900.4 -5.8% -14.9% 26.8% 26.1% -7.1% 2.0% 5.2% -16.9% India (Sensex) INR 31,145.8 4.1% 17.0% 1.9% -5.0% 29.9% 9.0% 25.7% -24.6% Brasil (Bovespa) BRL 62,711.5 -4.1% 4.1% 38.9% -13.3% -2.9% -15.5% 7.4% -18.1% Hong Kong (Hang Seng) HKD 25,660.7 4.2% 16.6% 0.4% -7.2% 1.3% 2.9% 22.9% -20.0% China (Shanghai Comp) CNY 3,117.2 -1.2% 0.4% -12.3% 9.4% 52.9% -6.8% 3.2% -21.7% South Korea (Kospi) KRW 2,347.4 6.4% 15.8% 3.3% 2.4% -4.8% 0.7% 9.4% -11.0% Israel (TA 25) ILS 1,419.4 1.5% -3.5% -3.8% 4.4% 10.2% 12.1% 9.2% -18.2% South Africa (Top 40) ZAR 47,153.9 0.2% 7.4% -4.1% 4.2% 6.0% 19.2% 22.2% -0.6% FIXED INCOME APRIL 2017 2016 2015 2014 2013 2012 2011 Citigroup WorldBig USD 217.0 1.7% 4.3% 1.9% -3.2% 0.8% 24.1% 13.2% -7.6% Citigroup WorldBig local Local 221.8 0.6% 1.4% 3.3% 0.9% 7.9% -0.1% 5.6% 5.7% Citigroup WorldBig (EUR hedged) EUR 221.8 0.5% 1.0% 2.4% 0.6% 7.8% -0.2% 5.5% 6.2% Citigroup WorldBig (GBP hedged) GBP 272.4 0.5% 1.3% 3.6% 1.3% 8.2% 0.1% 5.8% 5.9% Citigroup WorldBig (USD hedged) USD 239.8 0.6% 1.7% 3.9% 0.9% 7.8% -0.1% 5.6% 5.5% World government bonds (Citi) USD 924.9 1.7% 4.6% 1.6% -3.6% -0.5% -4.0% 1.7% 6.4% US Treasuries, total return USD 223.8 0.7% 2.1% 1.1% 0.8% 6.1% -3.4% 2.1% 9.9% US 10-year yield USD 2.20% -0.08 -0.24 0.17 0.10 -0.86 1.27 -0.12 -1.42 US 10-year bond USD 126.6 0.7% 1.8% -1.3% -0.7% 3.0% -7.3% 1.3% 8.9% US 5y/5y forward inflation expectation USD 1.95% -0.15 -0.10 0.24 -0.33 -0.51 -0.32 0.58 -0.39 Eurozone government debt EUR 231.5 0.6% -0.5% 3.3% 1.6% 13.1% 2.2% 11.0% 3.4% Eurozone corporate bonds EUR 223.9 0.4% 1.2% 4.7% -0.7% 8.2% 2.2% 13.6% 1.7% EU high yield (BofAML) USD 295.8 0.9% 3.7% 9.1% 0.8% -7.4% 15.0% 29.2% -5.6% Germany 10-year yield EUR 0.30% -0.01 0.10 -0.42 0.09 -1.39 0.61 -0.51 -1.14 Germany 10-year bond EUR 162.3 0.3% -1.1% 3.9% 1.3% 12.0% -4.4% 4.8% 11.0% UK 10-year yield GBP 1.05% -0.04 -0.19 -0.72 0.20 -1.27 1.19 -0.15 -1.42 Japan 10-year yield JPY 0.05% 0.03 0.00 -0.22 -0.06 -0.41 -0.05 -0.20 -0.14 China 10-year yield CNY 3.64% 0.16 0.58 0.20 -0.79 -0.97 1.03 0.15 -0.47 India 10-year yield INR 6.66% -0.30 0.15 -1.25 -0.10 -0.97 0.78 -0.52 0.65 Russia 10-year yield RUB 7.62% 0.06 -0.67 -1.10 -4.13 5.98 0.89 -1.65 0.61 Loans, total return (S&P LSTA) USD 2,742.5 0.4% 2.0% 10.2% -0.7% 1.6% 5.3% 9.7% 1.5% US High yield (BofAML) USD 1,230.7 0.9% 4.8% 17.5% -4.6% 2.5% 7.4% 15.6% 4.4% US investment grade (BofAML) USD 2,831.7 1.2% 3.6% 6.0% -0.6% 7.5% -1.5% 10.4% 7.5% US mortgages (BofAML) USD 2,058.6 0.6% 1.8% 1.7% 1.5% 6.1% -1.4% 2.6% 6.1% US municipals (BofAML) USD 545.9 1.5% 3.6% 0.4% 3.6% 9.8% -2.9% 7.3% 11.2% Global high yield (BBG) USD 169.5 1.3% 5.9% 14.8% -4.7% -0.3% 7.6% 18.6% 2.7% EM hard-currency debt (JPM EMBI+) USD 823.7 0.6% 6.7% 9.6% 1.8% 6.2% -8.3% 18.0% 9.2% EM external government debt (BofAML) USD 1,115.0 1.3% 7.0% 7.6% -1.0% 5.2% -3.3% 17.6% 5.8% EM investment grade (BofAML) USD 363.2 1.1% 4.4% 5.5% -1.0% 3.9% -1.3% 13.2% 5.6% Emerging market spreads USD 250.8 4.51 -35.99 -218.44 81.55 113.54 43.24 US Investment-grade spreads USD 116.0 0.71 -7.62 -44.55 49.98 22.95 -31.46 US high-yield spreads USD 390.7 -2.21 -39.09 -289.20 187.09 180.41 -74.78 CURRENCIES APRIL 2017 2016 2015 2014 2013 2012 2011 Dollar index 96.9 -2.1% -5.2% 3.6% 9.3% 12.8% 0.3% -0.5% 1.5% Euro 1.1 3.2% 6.9% -3.2% -10.2% -12.0% 4.2% 1.8% -3.2% Pound Sterling 1.3 -0.5% 4.5% -16.3% -5.4% -5.9% 1.9% 4.6% -0.4% Swiss Franc 1.0 2.8% 5.3% -1.6% -0.8% -10.2% 2.5% 2.6% -0.4% Japanese Yen 110.8 0.7% 5.6% 2.8% -0.5% -12.1% -17.6% -11.3% 5.5% Renminbi 6.8 1.0% 1.9% -6.6% -4.4% -2.4% 2.9% 1.1% 4.8% Won 1,119.7 1.6% 7.9% -2.6% -7.0% -3.8% 1.0% 9.1% -3.2% Brasilian Real 3.2 -1.5% 0.8% 21.7% -33.0% -11.1% -13.2% -9.1% -11.0% Indian Rupee 64.5 -0.3% 5.3% -2.6% -4.5% -2.0% -11.0% -3.1% -15.8% USD real effective exchange rate (Barclays) 133.8 -1.5% -4.7% 4.2% 7.9% 7.7% 1.4% -2.7% 1.7% EUR real effective exchange rate (Barclays) 71.1 2.2% 2.5% -1.2% -4.9% -3.8% 4.4% -1.9% -1.2% JPY real effective exchange rate (Barclays) 130.3 0.1% 2.3% 3.6% 4.9% -7.1% -17.5% -15.1% 2.5% COMMODITIES APRIL 2017 2016 2015 2014 2013 2012 2011 Global commodities, total return (S&P GSCI) USD 2,212.3 -1.5% -8.5% 11.4% -32.9% -33.1% -1.2% 0.1% -1.2% Agriculture, spot return USD 284.1 -1.8% -2.4% 2.6% -12.1% -8.3% -22.1% 3.9% -14.9% Energy, total return USD 369.1 -2.6% -15.1% 18.1% -41.5% -44.1% 5.1% -1.4% 4.9% Crude oil USD 398.4 -2.8% -14.4% 8.0% -45.3% -42.6% 6.0% -11.5% -1.3% Industrial metals, total return USD 1,175.6 -1.1% 4.7% 17.6% -24.5% -7.4% -12.9% 1.4% -22.3% Copper USD 3,459.6 -1.0% 2.2% 17.3% -24.9% -12.7% -7.9% 4.3% -21.5% Livestock, total return USD 2,057.4 4.4% 14.9% -7.3% -18.3% 14.2% -3.6% -4.0% -1.2% Precious metals USD 1,548.3 0.4% 9.9% 8.4% -11.1% -4.1% -29.8% 6.2% 6.6% Gold, total return USD 679.2 0.4% 10.2% 7.7% -10.9% -1.7% -28.7% 6.1% 9.6% REAL ESTATE APRIL 2017 2016 2015 2014 2013 2012 2011 All Equity REITS total returns (FTSE NAREIT) USD 16,369.9 -0.1% 2.9% 8.6% 2.8% 28.0% 2.9% 19.7% 8.3% FTSE EPRA NAREIT developed markets, total return USD 4,673.0 0.9% 4.4% 5.0% 0.1% 15.9% 4.4% 28.7% -5.8% FTSE EPRA NAREIT emerging markets USD 2,258.0 1.5% 14.7% 0.2% 2.5% 15.1% -20.0% 36.1% -28.9% New York home prices USD 186.9 0.0% 1.3% 2.8% 3.7% 2.8% 6.2% -0.3% -3.3% Greater London house price (£) GBP 649,864.0 2.1% 5.5% -0.1% 9.9% 11.7% 10.6% 6.8% 6.4% German house prices EUR 117.9 0.0% 1.6% 8.7% 1.7% 6.6% 3.5% 5.0% 8.4% Moscow prop prices (US$/sqm) USD 2,943.0 -0.2% 9.0% 3.6% -32.7% -24.8% -2.6% 6.0% 9.5% Beijing property prices (RMB/sqm) RMB 43,254.0 0.0% 10.0% 32.6% 14.7% -3.2% 30.7% -7.9% 7.9% HEDGE FUNDS APRIL 2017 2016 2015 2014 2013 2012 2011 Global hedge funds USD 1,231.6 0.2% 2.3% 2.5% -3.6% -0.6% 6.7% 3.5% -8.9% Equity hedge funds USD 1,188.4 -0.6% 2.8% 0.1% -2.3% 1.4% 11.1% 4.8% -19.1% Event-driven hedge funds USD 1,637.0 0.9% 4.6% 11.1% -6.9% -4.1% 13.9% 6.0% -4.9% CTA funds USD 1,131.5 0.5% -0.3% -2.9% -2.0% 5.2% -1.8% -1.0% -4.9% Credit hedge funds USD 2,009.9 0.3% 1.9% 5.0% -4.4% -1.8% 6.9% 7.7% -3.6% Activist hedge funds USD 2,402.7 0.0% 4.3% 9.1% 0.2% 8.5% 19.2% 9.3% -16.9%
- 13. MONTHLY VIEWPOINT From the Chief Investment Officer Marco E Pabst 13th June 2017 ACPI Investments Ltd. Pegasus House | 37-43 Sackville Street | London W1S 3EH T +44 (0)20 3697 9580 | F +44 (0)20 3697 9501 | E marco.pabst@acpi.com www.acpi.com Performance and valuations of international equity markets Year to Market Rolling 1-yr Rolling 2-yr Rolling 3-yr EPS growth Country date Cap (USDbn)* change change change 2016E 2017E 2017E 2016E 2017E WORLD All Country MSCI MXWD Index 10.8% 50,833 14.8% 9.4% 9.4% 16.8 15.1 10.7% 2.5% 2.7% Developed World MXWO Index 9.9% 42,019 13.9% 9.9% 10.8% 17.4 15.8 10.4% 2.5% 2.6% Emerging World MXEF Index 18.2% 8,814 21.7% 4.9% -2.8% 12.9 11.5 12.5% 2.6% 2.9% AMERICAS US (S&P500) SPX Index 8.6% 21,538 15.0% 16.9% 24.6% 18.7 16.7 11.9% 2.0% 2.2% US (Dow Jones Industrial) INDU Index 7.6% 5,980 18.3% 19.7% 25.5% 17.6 16.0 9.9% 2.4% 2.6% US mid/small cap RTY Index 4.8% 2,228 20.4% 13.8% 20.9% 28.9 22.3 29.5% 1.2% 1.3% Canada SPTSX Index 1.2% 1,699 8.7% 4.4% 4.0% 16.8 14.9 12.5% 2.9% 3.2% Mexico MEXBOL Index 7.5% 301 7.5% 10.2% 14.1% 17.8 15.9 12.4% 2.2% 2.3% Argentina MERVAL Index 27.8% 99 59.8% 89.9% 160.7% 9.3 7.9 18.4% 1.3% Brazil IBOV Index 3.3% 599 21.7% 17.8% 14.6% 11.6 10.5 9.9% 3.7% 4.3% EUROPE Europe SXXP Index 8.0% 11,565 14.4% 1.7% 12.0% 16.0 14.7 9.3% 3.4% 3.6% Germany DAX Index 11.6% 1,331 27.0% 16.5% 28.0% 14.1 13.1 7.7% 2.9% 3.1% France CAC Index 9.0% 1,673 20.3% 9.3% 15.5% 15.7 14.2 10.2% 3.2% 3.4% UK UKX Index 5.4% 2,619 20.8% 11.5% 9.5% 15.3 14.2 7.5% 4.1% 4.3% Spain IBEX Index 17.4% 764 25.2% 0.4% -1.7% 15.2 13.7 10.5% 3.5% 3.8% Italy FTSEMIB Index 9.8% 538 18.9% -6.2% -6.0% 14.6 12.5 16.7% 3.6% 4.0% Switzerland SMI Index 7.6% 1,133 9.5% -1.5% 2.1% 17.7 16.0 10.4% 3.5% 3.7% Norway OBX Index 2.7% 190 15.6% 9.0% 11.3% 14.8 13.3 11.6% 4.5% 5.0% Sweden OMX Index 9.1% 601 23.1% 4.2% 17.7% 17.1 15.7 8.9% 3.6% 3.7% Austria ATX Index 22.6% 97 43.6% 28.2% 25.0% 14.3 13.6 5.5% 2.8% 3.2% Greece ASE Index 21.5% 53 21.1% 1.7% -40.1% 10.5 16.8 -37.3% 7.0% 2.1% EMERGING EUROPE Hungary BUX Index 10.6% 25 31.3% 60.7% 85.7% 12.0 11.4 5.3% 2.5% 3.0% Kazakhstan KZKAK Index 15.4% 13 51.2% 71.3% 42.3% Ukraine PFTS Index 6.9% 1 27.7% -19.2% -35.2% 10.0 Russia RTSI$ Index -9.6% 493 9.5% 10.4% -23.5% 6.1 5.1 21.0% 5.6% 6.4% Poland WIG Index 18.2% 344 33.2% 14.2% 15.3% 12.9 12.0 7.7% 2.4% 2.8% Czech Rep PX Index 9.4% 48 16.2% 1.7% -2.6% 12.9 13.4 -3.8% 4.8% 4.7% Turkey XU100 Index 26.6% 176 27.3% 26.6% 22.5% 9.3 7.9 17.9% 3.2% 3.7% MIDDLE EAST & AFRICA South Africa TOP40 Index 4.5% 617 -2.8% 1.1% 1.6% 14.8 13.0 13.6% 3.2% 3.4% Egypt Hermes Index 12.1% 72.7% 58.3% 42.8% 11.3 9.4 20.9% 2.6% 3.6% Namibia FTN098 Index -4.5% 127 3.3% -7.0% -7.7% 9.7 9.9 -2.1% 4.5% 5.0% Nigeria NGSEINDX Index 23.8% 33 22.0% -0.6% -20.0% 20.2% Israel TA-25 Index -3.1% -0.3% -15.7% 1.0% 13.0 11.7 11.5% 1.9% 2.1% Saudi Arabia SASEIDX Index -4.8% 3.9% -27.7% -30.6% 14.2 12.3 16.0% 3.3% 3.6% Qatar DSMIndex -11.5% -6.1% -22.7% -28.8% 14.1 12.3 14.4% 3.6% 3.9% Dubai DFMGI Index -3.7% 0.9% -17.4% -28.7% 10.2 8.8 16.0% 4.3% 4.5% ASIA Asia MXAPEXA Index 25.8% 2,941 34.6% 11.8% 20.8% 13.2 12.0 10.3% 2.3% 2.5% Japan TPX Index 4.8% 5,324 19.6% -3.6% 28.6% 14.2 13.5 5.3% 2.1% 2.2% Japan NKY Index 4.7% 3,127 20.6% -1.9% 33.7% 17.5 16.0 9.4% 1.9% 2.0% Hong Kong HSI Index 18.3% 2,090 23.7% -4.6% 12.3% 12.8 11.7 9.0% 3.3% 3.4% China domestic shashr Index 1.8% 4,361 8.0% -38.9% 54.0% 13.9 12.4 12.6% 2.0% 2.2% China offshore HSCEI Index 12.7% 618 19.9% -24.3% 1.5% 8.4 7.8 8.4% 3.6% 3.9% Taiwan TWSE Index 10.2% 985 17.0% 9.7% 10.8% 14.4 13.5 7.0% 3.9% 4.2% South Korea KOSPI Index 17.5% 1,307 18.0% 16.1% 18.4% 1.6% 1.7% New Zealand NZSE Index 6.1% 82 3.0% 18.6% 28.0% 20.1 18.1 11.3% 4.2% 4.5% Australia AS30 Index -0.1% 1,326 6.0% 2.9% 5.7% 16.2 15.2 6.7% 4.4% 4.5% Pakistan KSE100 Index 3.6% 82 32.4% 44.5% 68.0% 11.4 9.5 20.9% 4.7% 5.3% Thailand SET50 Index 2.4% 286 8.6% -0.5% 0.8% 14.7 13.5 9.1% 3.1% 3.3% Indonesia JCI Index 7.2% 471 17.1% 15.0% 15.0% 16.0 13.7 16.8% 2.1% 2.4% India NIFTY Index 18.1% 1,052 17.9% 20.5% 26.3% 18.5 15.1 22.0% 1.6% 1.8% Singapore FSSTI Index 13.0% 370 15.3% -3.0% -1.2% 14.8 13.8 7.6% 3.4% 3.6% Malaysia FBMKLCI Index 9.0% 248 9.0% 3.1% -4.5% 16.8 15.9 5.9% 3.1% 3.3% Philippines PCOMP Index 16.8% 190 6.4% 6.5% 17.3% 19.4 17.4 11.7% 1.6% 1.7% Vietnam VNINDEX Index 12.8% 79 19.0% 28.7% 30.7% 14.8 13.0 13.9% 2.4% 2.5% Source(s): ACPI, Bloomberg Data as of: 31-May-2017 * Market cap for the main index PER Dividend yield
- 14. MONTHLY VIEWPOINT From the Chief Investment Officer Marco E Pabst 13th June 2017 ACPI Investments Ltd. Pegasus House | 37-43 Sackville Street | London W1S 3EH T +44 (0)20 3697 9580 | F +44 (0)20 3697 9501 | E marco.pabst@acpi.com www.acpi.com Three-month outlook Highly indebted major World economies are characterised by low GDP growth, low inflation and de-synchronised growth patterns whilst the lack of fiscal stimulus puts the burden on the central banks, keeping interest rates low for a long time to come. Weight Cash We are slightly overweight cash from reductions in fixed income. Equities US Valuations are high but US equities and the dollar serve as safe havens for the time being. Rising wages and the stronger dollar are likely to provide EPS headwinds. Positive sentiment was the missing ingredient to push stocks closer to the tops in this cycle. Europe With most elections in Europe behind us and growth picking up, the outlook has improved for the Eurozone. Potential ECB tapering is likely to support the euro and the financial sector. Japan Japanese equity markets are still amongst the cheapest globally and for as long as yields remain anchored, the market remains attractive, although currency volatility induces substantial equity volatility in the country. China H shares are attractive but onshore markets are still overvalued with the country undergoing a major transition. The domestic consumer is becoming stronger and savings are rising, helped by pro-growth fiscal support. EM Dollar strength and rising US yields in combination with policy issues (Turkey, India, Brazil,...) are a difficult mix for emerging market investors. Valuations are also not sufficiently cheap in order to justify taking these risks in many countries. Central Banks Aggregate central bank balance sheets are still expanding on a global level although the Fed started tightening already and the ECB is expected to announce similar steps soon. FixedIncome DM govt After the correction in DM government bonds in the second half of 2016, yield levels look more attractive than before, especially in the US. In the medium term, yields can rise further as expectations for growth and inflation improve. EM govt The resurgent dollar leads to capital outflows. Dollar bonds of countries with low external debt levels and low/no trade and budget deficits are interesting. The higher the dollar rises, the higher the risk of a crisis in one or more emerging markets. DM credit Spreads have been tightening, supported by recovering commodity prices. Spreads in the US and the UK are more attractive than in the Eurozone where rates are extremely low but likely to rise. EM credit We avoid issuers with substantial hard-currency debt relative to the underlying revenue mix. We would stress-test balance sheets against any EM FX deterioration. Spreads for fundamentally strong issuers in hard currency are attractive. Alt FI We like alternative areas of fixed income such as peer-to-peer lending (P2P) and structured credit. P2P lending offers diversified and uncorrelated low double-digit return streams and returns in structured credit are still attractive. Currencies USD It appears unlikely that the Fed will be able to raise policy rates substantially in the near future. Furthermore, the Fed is concerned about excessive dollar strength that caused problems in various areas such as commodities and EM in the past. EUR Following several elections in Europe, the risk premium for European assets should decline and the euro should benefit accordingly. Any further tapering by the ECB would also be bullish for the euro and Eurozone assets. JPY The BoJ has turned less aggressive recently with regards to providing additional monetary stimulus. Growth prospects and inflation are declining. The market is trying to find a new direction for the yen. EM The resurgent dollar and political crises are putting a lid on EM FX performance despite the recent recovery from post US election lows. We prefer commodity exporters over commodity importers. We like RUB, MXN and avoid TRY and INR. GBP The GBP cheapened substantially as a result of the Brexit vote. Due to the long timeline of the Brexit process, uncertainty will continue, adding a substantial risk premium to the currency. Commodities Oil It appears that the rebalancing of the oil market will take longer than expected with Saudi Arabia drawing down its reserves and the outlook hinges on demand growth as well as OPEC’s ability to control output. Metals Industrial metals have been supported by the outlook of more reflationary policies and fiscal stimulus, especially in the US. Following this surge, the market is now in a wait-and-see mode and wants to see evidence of growth picking up. General We believe that after five years of high negative returns, the commodity complex in general could become more attractive again, especially energy and agricultural commodities but also precious metals as a hedge against tail risks.
- 15. MONTHLY VIEWPOINT From the Chief Investment Officer Marco E Pabst 13th June 2017 ACPI Investments Ltd. Pegasus House | 37-43 Sackville Street | London W1S 3EH T +44 (0)20 3697 9580 | F +44 (0)20 3697 9501 | E marco.pabst@acpi.com www.acpi.com DISCLAIMER This document is provided for informational purposes only. It does not constitute an offer to sell or a solicitation to buy any security or other financial instrument. While based on information believed to be reliable, no guarantee is given that it is accurate or complete. Any investments referred to may not be suitable for the specific investment objectives, financial situation or individual needs of recipients. Reliance should not be placed on the views and information expressed herein when making any individual investment and/or strategic decisions. You should also be aware that the value of investments and any income from them can go down as well as up, and you may not receive back the amount you originally invested. There can be no assurances that appreciation in value of investments will occur, or that currency fluctuations will not affect the outcomes of any investment adversely. Past performance of the index or individual funds is not a guide to future performance. Certain funds invest in emerging markets which by their nature are higher risk and potentially more volatile than those inherent in established markets. This material is for the use of intended recipients only and the contents may not be reproduced, redistributed, or copied in whole or in part for any purpose without the consent of the issuer of this document. Where foreign securities are included in collective investment schemes, there may be additional risks that arise because of events in different jurisdictions. These may include but are not limited to; potential constraints on liquidity and the repatriation of funds, macroeconomic risks, political risks, foreign exchange risks, tax risks, settlement risks and potential limitations on the availability of market information. Issued by ACPI Investment Ltd (Registered in England - Number 03781549, at 37-43 Sackville Street, London, W1S 3EH), which is authorised and regulated by the Financial Conduct Authority (Register Number 192403). Details can be found on the following link www.fca.org.uk/register. © 2017 ACPI Investments Limited. All rights reserved. No part of the website may be reproduced by any means, whether graphically, electronically, mechanically or otherwise howsoever, including without limitation photocopying and recording on magnetic tape, or included in any information store and/or retrieval system without the prior written permission of ACPI Investments Limited. UK – London Pegasus House 37-43 Sackville Street London W1S 3EH United Kingdom T +44 20 3697 9501 Channel Islands – Jersey Third Floor 7 The Esplanade St Helier JE2 3QA T +44 (0)1534 716444 South Africa – Johannesburg 1st floor Dunkeld Place 12 North Road Dunkeld West 2196 PO Box 411325 Craighall, 2024 T +27 11 771 5315