Monthly Viewpoint from our CIO, Marco Pabst - November 2017: "As good as it gets?"
•
1 like•148 views

• Central banks delivered their dovish messages last month, ensuring that rates will stay low for longer • Although inflation could overshoot in the medium term, it is unlikely that the speed of rate hikes will accelerate by much • Stability and quality growth will be in focus in China, boding well for the economy and markets • We continue to favour Japan as an undervalued market with excellent prospects for the next years • Investors are likely to repeat mistakes of the past, overpaying for growth in sectors with shrinking profits in the future

Recommended
Recommended
More Related Content
What's hot
What's hot (19)
Similar to Monthly Viewpoint from our CIO, Marco Pabst - November 2017: "As good as it gets?"
Similar to Monthly Viewpoint from our CIO, Marco Pabst - November 2017: "As good as it gets?" (20)
Recently uploaded
Recently uploaded (20)
Monthly Viewpoint from our CIO, Marco Pabst - November 2017: "As good as it gets?"
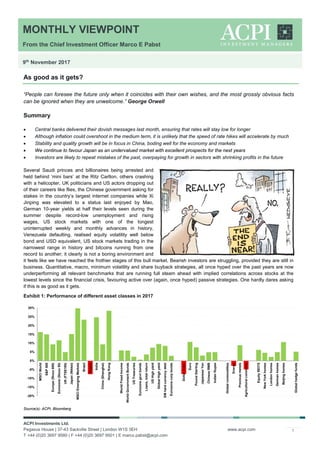
- 1. MONTHLY VIEWPOINT From the Chief Investment Officer Marco E Pabst 9th November 2017 ACPI Investments Ltd. Pegasus House | 37-43 Sackville Street | London W1S 3EH T +44 (0)20 3697 9580 | F +44 (0)20 3697 9501 | E marco.pabst@acpi.com www.acpi.com 1 As good as it gets? “People can foresee the future only when it coincides with their own wishes, and the most grossly obvious facts can be ignored when they are unwelcome.” George Orwell Summary • Central banks delivered their dovish messages last month, ensuring that rates will stay low for longer • Although inflation could overshoot in the medium term, it is unlikely that the speed of rate hikes will accelerate by much • Stability and quality growth will be in focus in China, boding well for the economy and markets • We continue to favour Japan as an undervalued market with excellent prospects for the next years • Investors are likely to repeat mistakes of the past, overpaying for growth in sectors with shrinking profits in the future Several Saudi princes and billionaires being arrested and held behind ‘mini bars’ at the Ritz Carlton, others crashing with a helicopter, UK politicians and US actors dropping out of their careers like flies, the Chinese government asking for stakes in the country’s largest internet companies while Xi Jinping was elevated to a status last enjoyed by Mao, German 10-year yields at half their levels seen during the summer despite record-low unemployment and rising wages, US stock markets with one of the longest uninterrupted weekly and monthly advances in history, Venezuela defaulting, realised equity volatility well below bond and USD equivalent, US stock markets trading in the narrowest range in history and bitcoins running from one record to another; it clearly is not a boring environment and it feels like we have reached the frothier stages of this bull market. Bearish investors are struggling, provided they are still in business. Quantitative, macro, minimum volatility and share buyback strategies, all once hyped over the past years are now underperforming all relevant benchmarks that are running full steam ahead with implied correlations across stocks at the lowest levels since the financial crisis, favouring active over (again, once hyped) passive strategies. One hardly dares asking if this is as good as it gets. Exhibit 1: Performance of different asset classes in 2017 Source(s): ACPI, Bloomberg -20% -15% -10% -5% 0% 5% 10% 15% 20% 25% 30% MSCIWorld S&P500 Europe(Stoxx600) Eurozone(Stoxx50) UK(FTSE100) Japan(Nikkei) MSCIEmergingMarkets Brasil Russia India China(Shanghai) HongKong WorldFixedIncome WorldGovernmentBonds USTreasuries Eurozonegovtbonds Loans,totalreturn USHighyield GlobalHighyield EMhardcurrencydebt Eurozonecorpbonds Dollarindex Euro PoundSterling JapaneseYen ChineseRMB IndianRupee Globalcommodities Energy Preciousmetals Agriculturalcommods EquityREITS NewYorkhomes Londonhomes Germanhomes Beijinghomes Globalhedgefunds
- 2. MONTHLY VIEWPOINT From the Chief Investment Officer Marco E Pabst 9th November 2017 ACPI Investments Ltd. Pegasus House | 37-43 Sackville Street | London W1S 3EH T +44 (0)20 3697 9580 | F +44 (0)20 3697 9501 | E marco.pabst@acpi.com www.acpi.com 2 October was a strong month for Global equities, performance-wise led by a market we do not usually find amongst the top Global performers: Japan. Thus, the Nikkei gained more than 8% last month, supported by a stronger reflationary environment, improving domestic and international growth and, last but not least, Abe’s election victory. Equity strength was widespread, driven by apparent progress with the US tax reform, generally strong economic reports and a solid quarterly reporting season. Thus, the Senate passed a budget for the fiscal year beginning 1 October, which will lead to the start of a ‘budget reconciliation’ process pertaining to the tax reform which will only require simple majority votes in each house. This means the tax package is still on track to be transferred into legislation by Q1 of next year. As the current proposal stands, it does not appear to be a big tax reform in any major way and one could rightly argue that the market has by now priced in the current proposal. Whilst positive, it falls short of a more progressive major overhaul. This implies a potential risk to markets as the revived Trumponomics trade could come to an end fairly quickly. Bond markets did not do much over the last weeks, sitting between a rock and a hard place, whereas the best outcome might be a slow taper á la euro zone whereas the Fed is already in the middle of its rate hike cycle. This limits upside in bond markets from spread tightening and is likely to result in more coupon-like returns going forward. US GDP growth for the third quarter came in better than expected at 3% (estimate 2.6%). Investment spending appears to be gaining some momentum across the board, growing at 4.5%, which is an improvement over more recent quarters but below a typical growth rate during an average recovery. Exhibit 2: The lowest number of countries in a recession in more than 30 years (note the time scale is incorrect) Source(s): Deutsche Bank The pickup in GDP growth is reflected in PMI indices across developed and major emerging markets all pointing in the same direction for the first time in many years. This re-synchronised global economic cycle is likely to lead to somewhat accelerating inflation and upside pressure to commodity prices and, by and large, more hawkishly-leaning central banks in the future. This is not the case yet but might well become a topic in 2018. Several leading indicators are pointing towards rising headline and core inflation over the coming quarters. This could potentially lead to a more hawkish language across the major central banks and a return of a rate scare in risk markets.
- 3. MONTHLY VIEWPOINT From the Chief Investment Officer Marco E Pabst 9th November 2017 ACPI Investments Ltd. Pegasus House | 37-43 Sackville Street | London W1S 3EH T +44 (0)20 3697 9580 | F +44 (0)20 3697 9501 | E marco.pabst@acpi.com www.acpi.com 3 Exhibit 3: US CPI core inflation and M2 velocity of money Source(s): WSJ The ECB was the first of the large three central banks to come out presenting its roadmap to quantitative tapering (QT). If Mario Draghi delivered any surprise, it was that the ECB appears more dovish than expected and certainly more dovish than warranted, considering the strength of the European economy. Considering that growth, inflation and productivity growth in the euro zone are very similar to what we find in the US, it seems odd that the US policy rate is at 1.25% and the European equivalent at a negative 40bps. Exhibit 4: Comparison of US and Euro zone labour productivity and CPI inflation Source(s): ACPI, Bloomberg As such, the market’s reaction was justified when the euro dropped by two points from 1.183 to 1.163 and sovereign bond yields across the euro zone retreated again. If nothing else changes, even if the ECB stops acquiring net new bonds by the
- 4. MONTHLY VIEWPOINT From the Chief Investment Officer Marco E Pabst 9th November 2017 ACPI Investments Ltd. Pegasus House | 37-43 Sackville Street | London W1S 3EH T +44 (0)20 3697 9580 | F +44 (0)20 3697 9501 | E marco.pabst@acpi.com www.acpi.com 4 end of next year, the effect of reinvesting principal (the stock effect) will still have a material impact on yield levels for many years to come. In the face of relatively strong, almost goldilock-like data, it appears odd that the ECB seems to be in no hurry to tighten policy at all. As expected, monthly net purchases will be reduced from EUR60bn to EUR30bn as of January until the end of September of next year. The ECB left the door open to extend or even increase asset purchases if and when required. Moreover, the ECB will continue to reinvest maturing securities well beyond the end of its net asset purchases, which means that any form of outright tightening in Europe will be far into the future unless inflation moves substantially higher. Markets are not expecting the first rate hike in the euro zone until the summer of 2019! Clearly, this puts the ECB in a particularly interesting spot as the World economy is likely to be much closer to the next recession by then and European central bankers will have no ammunition at all to ease monetary conditions. The great monetary experiment will then reach a whole new level where we might see the whole European yield curve below zero. Returning to more conventional central banks, the Bank of England’s policy decision on the 2nd of November was in-line with expectations when Mark Carney announced a 25bps increase, the first since 2007 and reversing the Brexit-related cut last year. Overall, though, the message was rather dovish (“All members agree that any future increases in Bank Rate would be expected to be at a gradual pace and to a limited extent.”) and markets are now expecting the next hike only in August of next year. The BoE outlined that the potential growth rate has dropped due to weak productivity growth. Although Carney believes that households are well prepared for higher rates, the UK consumer is certainly in a fairly stretched position at present as household debt is increasing and real wages are falling. Because of that we believe it is very unlikely that the UK will go through a whole new rate cycle, also considering the disastrous state of Brexit negotiations. The BoE is in a tricky spot. If it continues to hike in order to stem incoming inflation it would tip the UK housing market into a downturn. If the BoE does not hike, the GBP will come under pressure, inflation will rise further, putting more pressure on a weak UK consumer as real wages would fall faster. The best outcome to hope for would be a stabilisation in the GBP and much better visibility on Brexit, returning confidence in the UK economy, a recovering London housing market and rising real wages. Under such a scenario, a temporary inflationary overshoot can and will be accepted and would put consumers on a sounder footing. The Fed’s November meeting delivered no news; the Fed Funds rate stayed at 1.25% and is still widely expected to be increased by 25bps in December in what is likely to be Janet Yellen’s last rate hike as Chair of the Fed’s Board of Governors. In an almost surprising move for the POTUS, Donald Trump’s choice of Jerome Powell as new Fed Chair came as no surprise to markets at all as he was well flagged in advance. Powell is a safe choice too, as he appears to be a steady hand who, in contrast to Kevin Warsh and John Taylor, does not believe that the Fed needs to get ahead of the curve by raising interest rates more quickly. Surely, Trump who reportedly owes USD315m to various lenders across the World does not exactly have a strong incentive to help tighten interest rates too fast. Exhibit 5: Fed tightening and recessions (lhs) and ‘accidents’ at the end of previous rate cycles Source(s): Deutsche Bank, BofAML
- 5. MONTHLY VIEWPOINT From the Chief Investment Officer Marco E Pabst 9th November 2017 ACPI Investments Ltd. Pegasus House | 37-43 Sackville Street | London W1S 3EH T +44 (0)20 3697 9580 | F +44 (0)20 3697 9501 | E marco.pabst@acpi.com www.acpi.com 5 A slower path of rate hikes would also somewhat postpone the day of reckoning for stock markets. Although a tightening central bank usually does not cause a recession per se, it typically raises interest rates until some accident happens in an economy. The chart above highlights some of the previous crises that were partly caused by a tightening monetary regime. Markets are currently indicating to the Fed that they expect the central bank to cut rates in the future. This can be seen in the yield curve which has been increasingly flattening over the last weeks. It appears that the market is pricing in no inflation and an expectation that the Fed is done because, otherwise, the yield curve would at some point invert, a very reliable indicator for an incoming recession. Alternatively, should inflation actually come through over the next quarters, the Fed’s projected rate hike path would still be intact and bond markets would have to rethink their positioning at the longer end. This could lead to quickly rising yields in the market. Away from financial markets, in China, Xi Jinping’s elevation in status during the 19th National Congress of the Chinese Communist Party is an important political event that will have critical implications in the longer term. His “thought on socialism with Chinese characteristics for a new era” is now included in the constitution of the party, making him the second leader after Mao Zedong to be honoured in such a way. His new ambition of a ‘Beautiful China’ succeeds his previous ‘China Dream’ and focuses on the quality of growth rather than the quantity. It is a logical next step in the country’s economic evolution and will entail more emphasis on the environment, services and consumption over capital formation and infrastructure stimulus, i.e. a continuation of the rebalancing of the Chinese economy. As it pertains to the reform process, supply-side reform (industry consolidation, creation of national champions and deleveraging) and the ambitious OBOR programme (One belt, one road) will take centre stage over the next years. Together with a Communist Party that has re-asserted its power under Xi Jinping (not only by sheer force but also by re-gaining credibility) over the recent years and the ongoing de-risking of the financial sector, I believe that the risks emanating from China are vastly overstated in Western eyes. Continuity is likely to be the name of the game with some observers estimating that Xi might stay in power until 2027. This could bode well for local equity and bond markets which, despite good performance this year, are not very expensive yet in absolute and relative terms. Further east in Japan, performance has been stellar so far this year. The Nikkei 225 delivered a 17% total return until the end of October, while the growth-stock oriented JASDAQ index is up 44%. The broader Topix index is up 22% since December and +130% since the beginning of 2010. Exhibit 6: Topix performance and key valuation parameters Source(s): ACPI, Bloomberg This performance is justified as valuations in Japan have been consistently below those of most other markets whilst the country is enjoying the fastest increase in earnings of any major market. In the last quarter, profits for Japanese companies rose by more than 30% while over the previous six months they are up almost 40%.
- 6. MONTHLY VIEWPOINT From the Chief Investment Officer Marco E Pabst 9th November 2017 ACPI Investments Ltd. Pegasus House | 37-43 Sackville Street | London W1S 3EH T +44 (0)20 3697 9580 | F +44 (0)20 3697 9501 | E marco.pabst@acpi.com www.acpi.com 6 From a fundamental perspective, Japanese earnings have proven to be more resilient on the downside than those in other countries that were more affected by the 2015/16 slump in oil prices or the Chinese slowdown. In addition, they are now accelerating even faster, with consensus expecting an almost 20% profit growth in the financial year ending in March 2018. Exhibit 7: Blended 12-month forward earnings growth expectations for major indices Source(s): ACPI Japan has historically been a major beneficiary of a pickup in Global trade, which is what is driving this current move to a large extent. What has also helped is a shift towards higher quality growth as the share of non-manufacturing profits has increased substantially over the years, outpacing manufacturing earnings and leading to higher overall profit margins. Exhibit 8: Profit margins for Japanese corporations (excluding the financial sector) since 1959 (lhs) and corporate profits in the manufacturing and non-manufacturing sectors (rhs) Source(s): Ministry of Finance Japan, CLSA As a result, GDP growth is slowly picking up. Annualised quarterly real GDP growth reached 2.5% in the second quarter with real private consumption rising by 3.4%. Loan growth in the country has also turned the corner and is currently rising at ~3% year-on-year. 80 85 90 95 100 105 110 115 120 Jan 15 Feb 15 Mar 15 Apr 15 May 15 Jun 15 Jul 15 Aug 15 Sep 15 Oct 15 Nov 15 Dec 15 Jan 16 Feb 16 Mar 16 Apr 16 May 16 Jun 16 Jul 16 Aug 16 Sep 16 Oct 16 Nov 16 Dec 16 Jan 17 Feb 17 Mar 17 Apr 17 May 17 Jun 17 Jul 17 Aug 17 Sep 17 Oct 17 Nov 17 Japan Eurostoxx Hong Kong Shanghai US 0.0% 1.0% 2.0% 3.0% 4.0% 5.0% 6.0% 7.0% 8.0% 1959Jul.~Sep. 1961Apr.~Jun. 1963Jan.~Mar. 1964Oct.~Dec. 1966Jul.~Sep. 1968Apr.~Jun. 1970Jan.~Mar. 1971Oct.~Dec. 1973Jul.~Sep. 1975Apr.~Jun. 1977Jan.~Mar. 1978Oct.~Dec. 1980Jul.~Sep. 1982Apr.~Jun. 1984Jan.~Mar. 1985Oct.~Dec. 1987Jul.~Sep. 1989Apr.~Jun. 1991Jan.~Mar. 1992Oct.~Dec. 1994Jul.~Sep. 1996Apr.~Jun. 1998Jan.~Mar. 1999Oct.~Dec. 2001Jul.~Sep. 2003Apr.~Jun. 2005Jan.~Mar. 2006Oct.~Dec. 2008Jul.~Sep. 2010Apr.~Jun. 2012Jan.~Mar. 2013Oct.~Dec. 2015Jul.~Sep. 2017Apr.~Jun.
- 7. MONTHLY VIEWPOINT From the Chief Investment Officer Marco E Pabst 9th November 2017 ACPI Investments Ltd. Pegasus House | 37-43 Sackville Street | London W1S 3EH T +44 (0)20 3697 9580 | F +44 (0)20 3697 9501 | E marco.pabst@acpi.com www.acpi.com 7 Inflation is still elusive despite a lavish central bank and a closed output gap. Core inflation ex fresh food and energy rose to merely 0.2% in August, still a far cry from the unrealistic 2% inflation target adopted by Haruhiko Kuroda. However, there is also a case to be made that the official CPI figures are vastly understating actual inflation in the real world. This is largely supported by the fact that inflation household surveys are mostly completed by civil servants and retirees that have a different consumption pattern from the rest of the population. Furthermore, food-related inflation has been quite meaningful in the country over the past years. Undoubtedly, Japan is increasingly leaving its multi-decade debt-deflation induced post-crisis period behind. Some deflationary tendencies are still present but many other aspects are improving substantially. Exhibit 9: Unemployment rate in Japan (lhs) and job offers to applicants ratios (rhs) Source(s): ACPI, Bloomberg, CLSA Most importantly, the labour market has been tightening for some time. Japan’s unemployment rate reached 2.8% in September, the lowest level since the mid-nineties. The job offers-to-applicants ratio has been trending higher since 2010 reflecting an increasing difficulty to fill vacant positions. Female labour participation has been rising by three percentage points since 2010 as a result. Exhibit 10: Wage growth in Japan since 2005 Source(s): ACPI, Bloomberg
- 8. MONTHLY VIEWPOINT From the Chief Investment Officer Marco E Pabst 9th November 2017 ACPI Investments Ltd. Pegasus House | 37-43 Sackville Street | London W1S 3EH T +44 (0)20 3697 9580 | F +44 (0)20 3697 9501 | E marco.pabst@acpi.com www.acpi.com 8 These developments should lead to faster rising wages in the future. Thus, earnings growth for regular employees hit 2.7% last month and is set to rise further. In the past, trade unions have been focusing on keeping jobs for permanent staff and, therefore, compromised in terms of wage increases. Following his re-election, Abe has already stated that he would like to see wages for permanent workers rise by at least three percent in the next round of wage negotiations in spring. Over the past years, returns on equity and payout ratios have normalised towards levels of 8% and 30%, respectively, following a focus on these measures that were suggested by Prof Kunio Ito back in 2014. Share buybacks this year are down compared to last year but still substantial compared to previous decades. It has been our view for several years that the inflection point at which a deep-value market meets catalysts that help unlock this value is highly attractive from an investor perspective. Japan is right in the middle of this process. The country’s stock market is the only remaining haven amongst developed markets for deep value investors. The equivalent of approximately 70% of GDP, or USD3.5trn, sits as cash or near-cash on corporate balance sheets. Some of it was used in the past for stepped-up share buybacks and some for M&A but the amounts are still vast and continue to grow. This draws political pressure to spend this money on investments and wages, which is a position that was not only voiced by Yuriko Koike’s Party of Hope but was subsequently also taken up by the LDP. There is not much politics can do at this point to nudge corporations further towards more distributions of their cash other than introducing a tax on retained earnings or the issuance of guidelines similar to those mentioned above. Supposedly, the latter may work better in Japan, which means share buyback programmes and rising wages are here to stay and we may see more corporate activity in terms of domestic and foreign takeovers. Exhibit 11: Net debt to equity position of Japanese companies (lhs) and percentage of stocks trading below book value (rhs) Source(s): CLSA As a result of a continuous deleveraging over the past decades, balance sheets are strong and net-debt-to-equity ratios are close to 40%. Almost 40% of listed companies in Japan are trading below book value, the highest such value across all markets. The undervaluation becomes even more apparent when one analyses individual companies. There are about 20 listed companies where the value of their land holdings is at or above their market capitalisations. There is a similar number of companies where the value of their equity holdings is equal or larger than their market cap. There are countless companies trading at negligible enterprise values when properly adjusted for security portfolios that are not part of the core business. In addition, there are hundreds of companies that are listed subsidiaries of larger businesses where only a relatively small percentage of stock is free-floating, often leading to extreme deep-value situations. Encouraged by politics, parent companies are now increasingly buying out minority shareholders at sometimes hefty premiums.
- 9. MONTHLY VIEWPOINT From the Chief Investment Officer Marco E Pabst 9th November 2017 ACPI Investments Ltd. Pegasus House | 37-43 Sackville Street | London W1S 3EH T +44 (0)20 3697 9580 | F +44 (0)20 3697 9501 | E marco.pabst@acpi.com www.acpi.com 9 The stellar performance of Japan is also an expression of increasing exuberance in global equity markets that continue to press higher as multiples keep expanding while yields are slowly rising. The air is clearly getting thinner although it appears to be too early to call a top in any market yet. Exhibit 12: Markets are close to having their least volatile year ever Source(s): Bespoke Low trading ranges causing record-low volatility across asset classes are a recurring feature in markets at the moment. As a result of that, 2017 is the first year in many decades where, so far, US equity markets closed in positive territory every single month. Exhibit 13: Monthly heat map of the S&P500 total return index Source(s): Bloomberg Levels of bullishness in terms of investor positioning and sentiment are high and extended but, from a technical perspective, the uptrend is intact and relatively well supported despite market breadth somewhat declining as of late. Whilst this is not an immediate warning signal, it is an important situation to watch.
- 10. MONTHLY VIEWPOINT From the Chief Investment Officer Marco E Pabst 9th November 2017 ACPI Investments Ltd. Pegasus House | 37-43 Sackville Street | London W1S 3EH T +44 (0)20 3697 9580 | F +44 (0)20 3697 9501 | E marco.pabst@acpi.com www.acpi.com 10 Exhibit 14: Market breadth for the S&P500 Source(s): Bloomberg, ACPI Performance concentration in a very limited number of stocks is not a new phenomenon and usually occurs closer to the end of extended bull runs. The FANGs or FAANGs and BATs (Facebook, Amazon, Apple, Netflix, Google, Baidu, Alibaba and Tencent) are now household names, representing a small number of companies that promise superior growth prospects. The recent introduction of FANG futures by the New York Stock Exchange is an event that would make us rather cautious about the prospective returns from these stocks. Whilst wildly popular, fundamentals of these large-cap growth stocks are struggling to catch up to stock prices. They are in favour because they are large and liquid and offer some growth prospects that are otherwise hard to come by. As a result, there is a risk that investors are, again, overpaying for growth. Exhibit 15: FAANG stocks’ 2018 earnings per share revisions and share price performance as of the end of October 2017 (in percent, lhs) and composition of Amazon’s quarterly profits Source(s): ACPI, Business Insider Additionally, they may look at these businesses in the wrong way. Amazon is only profitable at the moment because of its cloud business AWS. Without it, the company would be loss-making. Furthermore, earnings estimates have continuously 17.2 -47.0 16.8 5.9 14.3 38.2 34.2 41.0 26.0 39.6 -60.0 -50.0 -40.0 -30.0 -20.0 -10.0 0.0 10.0 20.0 30.0 40.0 50.0 Facebook Amazon Apple Google Netflix GAAP Earnings Stock price
- 11. MONTHLY VIEWPOINT From the Chief Investment Officer Marco E Pabst 9th November 2017 ACPI Investments Ltd. Pegasus House | 37-43 Sackville Street | London W1S 3EH T +44 (0)20 3697 9580 | F +44 (0)20 3697 9501 | E marco.pabst@acpi.com www.acpi.com 11 been revised downwards this year for the company. Under normal circumstances, any stock experiencing such downgrades (almost 50% year-to-date for 2018 expected earnings) would get hammered by the market. Not so Amazon that rose by a third so far this year. The fact that Facebook and Google are essentially advertising/media businesses will only occur to investors during the next downturn when media spending is being reduced by their clients. The long-term sustainability of a business model such as Netflix is also somewhat questionable to us, as the company can only continue to attract subscribers for as long as they produce expensive content, currently spending approximately USD8bn a year. The resulting massive negative free cash flow is currently funded by unchallenging credit markets. However, if investors will one day be asking for real profits, the company’s model may reverse into a vicious circle of spending cuts and subscriber losses. It appears that Tesla will be the first of these disruptors becoming a victim of closer investor scrutiny. Their large-scale production and quality issues lay bare their inability and inexperience to scale a relatively small business towards an industrial scale in one of the most competitive industries in the World. A huge line-up of competitors’ models over the next two years that offer better quality and price for the same performance will put additional pressure on the company. Whilst disruptors appear to excite investors as they are offering growth opportunities, many are missing the point that growth is meaningless if no profit can be achieved. Many industries are currently being disrupted by new technologies and services but in all cases, prices for the consumer will go down. Profitable businesses and industries are being attacked because a profit pool is available for the taking; from high traditional taxi fares, expensive hotels to bank fees and investment products or retail businesses. The result of disruption, however, is not that the disruptor will get to own the profit stream of the disrupted. The disruptor captures a fraction of that profit but permanently destroys the profit pool of a particular industry for all participants. Amazon’s low profitability in its core business is a good example whereby it damages the retail industry as a whole but is not able to turn a sufficient profit for itself. I would therefore be doubtful that most disruptors will be interesting investments for the longer term as they themselves will be vulnerable targets at some point in the future. From the perspective of an economy, the most important outcome is that this process puts pressure on prices, which keeps a lid on inflation and is, therefore, beneficial for the consumer.
- 12. MONTHLY VIEWPOINT From the Chief Investment Officer Marco E Pabst 9th November 2017 ACPI Investments Ltd. Pegasus House | 37-43 Sackville Street | London W1S 3EH T +44 (0)20 3697 9580 | F +44 (0)20 3697 9501 | E marco.pabst@acpi.com www.acpi.com 12 Global economic monitor Source(s): ACPI, Bloomberg May Jun Jul Aug Sept Oct Trend Citi Economic Surprise US -38.2 -72.6 -43.1 -23.1 -7.9 40.2 Citi Economic Surprise G10 2.0 -20.5 -11.1 3.5 19.2 39.3 Citi Economic Surprise Europe 40.6 30.3 19.1 28.0 50.2 59.0 Citi Economic Surprise EM 7.4 12.5 16.3 16.3 15.0 23.5 Citi Economic Surprise UK -15.1 -15.8 -39.8 -27.6 -2.6 5.7 ISM manufacturing 54.9 57.8 56.3 58.8 60.8 58.7 ISM new orders 58.6 62 57.75 58.7 63.8 63.1 Global manufacturing PMI 53.8 53.7 53.6 54.0 54.0 China manufacturing PMI 51.2 51.7 51.4 51.7 52.4 51.6 Japan manufacturing PMI 53.1 52.4 52.1 52.2 52.9 52.8 US durable goods orders 0.0 6.4 -6.8 2.1 2.0 US initial jobless claims 255 250 241 236 258 229 US Industrial production 0.0 0.2 -0.1 -0.7 0.3 Euro Industrial production 1.3 -0.6 0.3 1.4 Japan Industrial production -3.6 2.2 -0.8 2.0 -1.1 US retail sales 0.0 -0.1 0.5 -0.1 1.6 Euro retail sales 0.5 0.5 -0.3 -0.5 Japan retail sales 2.1 2.2 1.8 1.8 2.2 China retail sales 10.7 11.0 10.4 10.1 10.3 US consumer confidence 117.6 117.3 120.0 120.4 120.6 125.9 Euro consumer confidence -3.3 -1.3 -1.7 -1.5 -1.2 -1.0 ifo German business expectations 106.5 106.7 107.3 107.8 107.5 109.1 China export trade 7.9 10.8 6.5 5.1 8.1 South Korea export trade 13.3 13.6 19.5 17.4 35.0 7.1 German export trade 8.7 5.8 8.0 7.4 China monthly money supply 9.6 9.4 9.2 8.9 9.2 US personal income 0.3 0.0 0.3 0.2 0.4
- 13. MONTHLY VIEWPOINT From the Chief Investment Officer Marco E Pabst 9th November 2017 ACPI Investments Ltd. Pegasus House | 37-43 Sackville Street | London W1S 3EH T +44 (0)20 3697 9580 | F +44 (0)20 3697 9501 | E marco.pabst@acpi.com www.acpi.com 13 The Global PMI heatmap Source(s): ACPI, Bloomberg Country/RegionCategory/SectorOct-2017Sep-2017Aug-2017Jul-2017Jun-2017May-2017Apr-2017Mar-2017Feb-2017Jan-2017Dec-2016Nov-2016Oct-2016Sep-2016Aug-2016Jul-2016Jun-2016May-2016Apr-2016Mar-2016Feb-2016Jan-2016Dec-2015Nov-2015Oct-2015 AustriaManufacturing59.459.461.160.060.758.058.156.857.257.356.355.453.953.552.153.454.552.052.052.851.951.250.651.453.0 BrazilComposite49.551.149.649.448.550.450.448.746.644.745.245.344.946.144.446.442.338.339.040.839.045.143.944.542.7 BrazilManufacturing51.250.950.950.050.552.050.149.646.944.045.246.246.346.045.746.043.241.642.646.044.547.445.643.844.1 BrazilServices48.850.749.048.847.449.250.347.746.445.145.144.443.945.342.745.641.437.337.438.636.944.443.545.543.0 CanadaManufacturing54.355.054.655.554.755.155.955.554.753.551.851.551.150.351.151.951.852.152.251.549.449.347.548.648.0 ChinaComposite51.051.452.451.951.151.551.252.152.652.253.552.952.951.451.851.950.350.550.851.349.450.149.450.549.9 ChinaManufacturing51.051.051.651.150.449.650.351.251.751.051.950.951.250.150.050.648.649.249.449.748.048.448.248.648.3 ChinaServices51.250.652.751.551.652.851.552.252.653.153.453.152.452.052.151.752.751.251.852.251.252.450.251.252.0 CzechRepublicManufacturing58.556.654.955.356.456.457.557.557.655.753.852.253.352.050.149.351.853.353.654.355.556.955.654.254.0 DevelopedMarketsManufacturing55.254.654.254.053.954.154.153.954.154.253.853.052.651.551.251.551.250.450.550.950.852.152.052.352.5 DevelopedMarketsServices54.954.654.854.554.554.254.254.153.754.553.954.053.651.851.551.451.652.052.351.751.253.353.954.854.2 DevelopedMarketsComposite55.054.654.754.454.554.354.454.254.154.654.154.053.752.051.851.651.551.551.951.751.253.253.754.654.0 EgyptWholeEconomy48.447.448.948.647.247.347.445.946.743.342.841.842.046.347.048.947.547.646.944.548.148.048.245.047.2 EmergingMarketsComposite51.551.952.151.551.552.352.052.552.151.951.951.551.851.251.351.550.049.549.950.549.050.149.550.349.7 EmergingMarketsManufacturing51.251.451.750.950.850.650.951.651.350.851.150.851.050.350.150.349.349.549.550.248.949.449.049.248.9 EmergingMarketsServices51.651.551.851.251.652.852.152.351.952.151.650.951.151.151.251.450.749.149.850.048.950.849.550.250.4 EuropeanUnionComposite56.056.155.355.355.856.356.756.155.654.654.954.153.652.953.051.953.053.152.853.353.054.054.554.554.2 EuropeanUnionManufacturing58.157.757.156.256.856.856.755.955.355.254.953.553.452.951.851.452.851.451.451.751.452.452.952.852.6 EuropeanUnionServices55.155.354.455.055.055.756.355.755.053.954.454.153.352.352.851.552.753.452.953.353.254.154.554.654.3 EurozoneComposite56.056.755.755.756.356.856.856.456.054.454.453.953.352.652.953.253.153.153.053.153.053.654.354.253.9 EurozoneManufacturing58.558.157.456.657.457.056.756.255.455.254.953.753.552.651.752.052.851.551.751.651.252.353.252.852.3 EurozoneRetail51.152.350.851.053.252.052.749.549.950.150.448.648.649.651.048.948.550.647.949.250.148.949.048.551.3 EurozoneServices55.055.854.755.455.456.356.456.055.553.753.753.852.852.252.852.952.853.353.153.153.353.654.254.254.1 EurozoneConstruction52.952.753.553.153.253.252.553.552.250.752.351.449.449.148.648.346.548.447.549.051.350.349.448.747.8 FranceComposite57.457.155.255.656.656.956.656.855.954.153.151.451.652.751.950.149.650.950.250.049.350.250.151.052.6 FranceManufacturing56.156.155.854.954.853.855.153.352.253.653.551.751.849.748.348.648.348.448.049.650.250.051.450.650.6 FranceRetail51.553.350.454.156.353.351.849.451.753.150.447.347.549.153.051.651.050.648.245.548.148.946.647.851.9 FranceServices57.357.054.956.056.957.256.757.556.454.152.951.651.453.352.350.549.951.650.649.949.250.349.851.052.7 FranceConstruction52.752.553.752.352.353.552.753.251.550.150.650.347.547.845.344.842.343.841.642.744.643.042.244.843.8 GermanyComposite56.657.755.854.756.457.456.757.156.154.855.255.055.152.853.355.354.454.553.654.054.154.555.555.254.2 GermanyManufacturing60.660.659.358.159.659.558.258.356.856.455.654.355.054.353.653.854.552.151.850.750.552.353.252.952.1 GermanyRetail51.252.853.050.754.555.056.252.551.250.352.049.651.053.054.152.051.654.051.054.152.549.550.549.652.4 GermanyServices54.755.653.553.154.055.455.455.654.453.454.355.154.250.951.754.453.755.254.555.155.355.056.055.654.5 GermanyConstruction53.353.454.955.855.155.354.656.454.152.054.953.952.952.451.651.650.452.753.455.859.657.955.552.551.8 GreeceManufacturing52.152.852.250.550.549.648.246.747.746.649.348.348.649.250.448.750.448.449.749.048.450.050.248.147.3 HongKongWholeEconomy50.351.249.751.351.150.551.149.949.649.950.349.548.249.349.047.245.447.245.345.546.446.146.446.646.6 IndiaComposite51.351.149.046.052.752.551.352.350.749.447.649.155.452.454.652.451.150.952.854.351.253.351.650.252.6 IndiaManufacturing50.351.251.247.950.951.652.552.550.750.449.652.354.452.152.651.851.750.750.552.451.151.149.150.350.7 IndiaServices51.750.747.545.953.152.250.251.550.348.746.846.754.552.054.751.950.351.053.754.351.454.353.650.153.2 IndonesiaManufacturing50.150.450.748.649.550.651.250.549.350.449.049.748.750.950.448.451.950.650.950.648.748.947.846.947.8 IrelandComposite56.057.658.257.058.058.758.756.957.859.358.455.554.054.856.956.559.259.158.160.759.561.159.260.257.7 IrelandManufacturing54.455.456.154.656.055.955.053.653.855.555.753.752.151.351.750.253.051.552.654.952.954.354.253.353.6 IrelandServices57.558.758.458.357.659.561.159.160.661.059.156.054.656.259.759.561.261.759.862.862.164.061.863.660.1 IrelandConstruction#N/A56.555.156.658.263.661.360.857.955.758.959.862.358.758.461.059.755.956.462.368.863.658.655.556.3 ItalyComposite53.954.355.856.254.555.256.854.254.852.852.953.451.151.151.952.252.650.853.152.453.753.856.054.353.9 ItalyManufacturing57.856.356.355.155.255.156.255.755.053.053.252.250.951.049.851.253.552.453.953.552.253.255.654.954.1 ItalyRetail50.350.248.047.347.145.548.345.145.545.647.948.846.545.043.240.340.245.242.646.649.447.950.247.748.8 ItalyServices52.153.255.156.353.655.156.252.954.152.452.353.351.050.752.352.051.949.852.151.253.853.655.353.453.4 ItalyConstruction52.351.751.249.951.049.048.649.049.949.250.248.545.945.147.746.944.947.245.345.846.147.248.647.346.4 JapanComposite53.451.751.951.852.953.452.652.952.252.352.852.051.348.949.850.149.049.248.949.951.052.652.252.352.3 JapanManufacturing52.852.952.252.152.453.152.752.453.352.752.451.351.450.449.549.348.147.748.249.150.152.352.652.652.4 JapanServices53.451.051.652.053.353.052.252.951.351.952.351.850.548.249.650.449.450.449.350.051.252.451.551.652.2 LebanonWholeEconomy45.846.046.346.346.146.647.546.947.747.747.046.943.845.145.045.544.444.844.145.047.449.147.946.947.1 MexicoManufacturing49.252.852.251.252.351.250.751.550.650.850.251.151.851.950.950.651.153.652.453.253.152.252.453.053.0 NetherlandsManufacturing60.460.059.758.958.657.657.857.858.356.557.357.055.753.453.553.252.052.752.653.651.752.453.453.553.7 PolandManufacturing53.453.752.552.353.152.754.153.554.254.854.351.950.252.251.550.351.852.151.053.852.850.952.152.152.2 RussiaComposite53.254.854.253.454.856.055.356.355.458.356.655.853.753.152.953.553.551.251.350.850.648.447.850.549.0 RussiaManufacturing51.151.951.652.750.352.450.852.452.554.753.753.652.451.150.849.551.549.648.048.349.349.848.750.150.2 SaudiArabiaWholeEconomy55.655.555.855.754.355.356.556.457.056.755.555.053.255.356.656.054.454.854.254.554.453.954.456.355.7 SouthAfricaWholeEconomy49.648.549.850.149.050.250.350.750.551.351.650.850.550.749.849.949.650.247.947.049.149.649.149.647.5 SouthKoreaManufacturing50.250.649.949.150.149.249.448.449.249.049.448.048.047.648.650.150.550.150.049.548.749.550.749.149.1 SpainComposite55.156.455.356.757.757.257.356.857.054.755.555.254.454.154.853.755.754.855.255.154.555.355.256.255.0 SpainManufacturing55.854.352.454.054.755.454.553.954.855.655.354.553.352.351.051.052.251.853.553.454.155.453.053.151.3 SpainServices54.656.756.057.658.357.357.857.457.754.255.055.154.654.756.054.156.055.455.155.354.154.655.156.755.9 TaiwanManufacturing53.654.254.353.653.353.154.456.254.555.656.254.752.752.251.851.050.548.549.751.149.450.651.749.547.8 TurkeyManufacturing52.853.555.353.654.753.551.752.349.748.747.748.849.848.347.047.647.449.448.949.250.350.952.250.949.5 UnitedArabEmiratesWholeEconomy55.955.157.356.055.854.356.156.256.055.355.054.253.354.154.755.353.454.052.854.553.152.753.354.554.0 UnitedKingdomComposite55.854.154.054.153.854.356.254.953.755.256.655.254.753.953.447.552.653.252.053.752.755.755.155.755.2 UnitedKingdomManufacturing56.356.056.855.354.256.457.054.354.655.455.853.454.055.653.148.553.150.549.651.350.952.251.252.454.4 UnitedKingdomServices55.653.653.253.853.453.855.855.053.354.556.255.254.552.652.947.452.353.552.353.752.755.655.555.954.9 UnitedKingdomConstruction50.848.151.151.954.856.053.152.252.552.254.252.852.652.349.245.946.051.252.054.254.255.057.855.358.8 UnitedStatesManufacturing54.653.152.853.352.052.752.853.354.255.054.354.153.451.552.052.951.350.750.851.551.352.451.252.854.1 UnitedStatesServices55.355.356.054.754.253.653.152.853.855.653.954.654.852.351.051.451.451.352.851.349.753.254.356.154.8 UnitedStatesComposite55.254.855.354.653.953.653.253.054.155.854.154.954.952.351.551.851.250.952.451.350.053.254.055.955.0 VietnamManufacturing51.653.351.851.752.551.654.154.654.251.952.454.051.752.952.251.952.652.752.350.750.351.551.349.450.1 WorldComposite54.053.954.053.653.753.853.753.853.653.853.553.353.251.851.751.651.151.051.451.350.652.352.553.352.8 WorldManufacturing53.553.353.252.852.652.652.753.053.052.852.752.152.051.150.851.050.450.150.250.650.050.950.751.051.0 WorldServices54.153.854.153.753.853.953.753.753.353.953.353.353.051.751.551.451.451.351.751.350.752.752.853.753.3 The table shows monthly PMI statistics across countries and different sectors per country for the past two years. The latest data is next to the country/sector name at the bottom of the page. Brazil recovering Italy’s permanent recession Improving picture in the US EM recovery
- 14. MONTHLY VIEWPOINT From the Chief Investment Officer Marco E Pabst 9th November 2017 ACPI Investments Ltd. Pegasus House | 37-43 Sackville Street | London W1S 3EH T +44 (0)20 3697 9580 | F +44 (0)20 3697 9501 | E marco.pabst@acpi.com www.acpi.com 14 The World in Numbers Source(s): ACPI, Bloomberg Date PMI CPI (%) Disc rate % Ind Prodyoy% Exports ($M) Imports ($M) Trade bal ($M) M2 ($bn) M2 mom% Unempl % Date GDP yoy% 30/04/2017 58.3 2.2 1 2.12 124,054 187,853 -63,799 13,453 4.4 31/12/2016 1.8 31/05/2017 59.4 1.90 1.00 2.20 128,536 202,096 -73,560 13,518 0.5% 4.3 31/03/2017 2 30/06/2017 65.7 1.6 1.25 2.06 133,417 200,020 -66,603 13,544 0.2% 4.4 30/06/2017 2.2 31/07/2017 58.9 1.7 1.25 1.83 122,231 193,621 -71,390 13,620 0.6% 4.3 30/09/2017 2.3 31/08/2017 58.9 1.9 1.25 1.16 129,485 203,440 -73,955 13,664 0.3% 4.4 30/09/2017 65.2 2.2 1.25 1.6 130,335 196,482 -66,147 13,703 0.3% 4.2 31/10/2017 66.2 1.25 4.1 Date PMI CPI (%) Disc rate % Ind Prodyoy% Exports ($bn) Imports ($bn) Trade bal ($bn) M2 (RMBbn) M2 mom% Date GDP yoy% 30/04/2017 51.2 1.2 1.50 6.5 178.2 141.53 36.7 159,633 31/12/2016 6.8 31/05/2017 51.2 1.5 1.50 6.5 189.55 149.37 40.2 160,136 0.3% 31/03/2017 6.9 30/06/2017 51.7 1.5 1.50 7.6 195.6 153.73 41.9 163,128 1.9% 30/06/2017 6.9 31/07/2017 51.4 1.4 1.50 6.4 192.35 146.92 45.4 162,900 -0.1% 30/09/2017 6.8 31/08/2017 51.7 1.8 1.50 6.0 198.53 157.31 41.2 164,516 1.0% 30/09/2017 52.4 1.6 1.50 6.60 198.23 169.63 28.6 165,566 0.6% 31/10/2017 51.6 1.50 Date PMI CPI (%) Disc rate % Ind Prodyoy% Exports (€bn) Imports (€bn) Trade bal (€bn) M2 EZ (€bn) M2 EZ mom% Unempl % Date GDP yoy% 30/04/2017 58.2 2 0.00 2.9 106.1 86.7 19.4 10,923,159 5.8 31/12/2016 1.8 31/05/2017 59.5 1.5 0.00 5.0 107.8 87.7 20.1 10,935,386 0.1% 5.7 31/03/2017 2.0 30/06/2017 59.6 1.6 0.00 2.8 104.8 83.8 21.0 11,003,528 0.6% 5.7 30/06/2017 2.1 31/07/2017 58.1 1.7 0.00 4.2 105.2 85.8 19.4 11,024,534 0.2% 5.7 31/08/2017 59.3 1.8 0.00 4.7 108.3 86.7 21.6 11,071,093 0.4% 5.7 30/09/2017 60.6 1.8 0.00 11,092,290 0.2% 5.6 31/10/2017 60.6 1.6 0.00 5.6 Date PMI CPI (%) Disc rate % Ind Prodyoy% Exports,GBPM Imports,GBPM Trade bal (GBPM) M2 (GBPM) M2 mom% Unempl % Date GDP yoy% 30/04/2017 57 2.7 0.25 -0.5 50,956 52,084 -1,128 1,649,578 4.6 31/12/2016 1.6 31/05/2017 56.4 2.9 0.25 0.3 51,128 53,162 -2,034 1,651,193 0.1% 4.5 31/03/2017 1.8 30/06/2017 54.2 2.6 0.25 0.8 50,557 53,902 -3,345 1,664,381 0.8% 4.4 30/06/2017 1.5 31/07/2017 55.3 2.6 0.25 1.1 49,839 54,075 -4,236 1,659,983 -0.3% 4.3 30/09/2017 1.5 31/08/2017 56.8 2.9 0.25 1.6 50,153 55,779 -5,626 1,660,603 0.0% 4.3 30/09/2017 56 3 0.25 1,673,234 0.8% 31/10/2017 56.3 0.25 Date CPI (%) Disc rate % Ind Prodyoy% Exports,JPYbn Imports,JPYbn Trade bal (JPYbn) M2 (JPY TRN) M2 mom% Unempl % Date GDP yoy% 30/04/2017 0.4 5.7 6,329 5,850 479 971 2.8 31/12/2016 1.7 31/05/2017 0.4 6.5 5,851 6,058 -206 972 0.1% 3.1 31/03/2017 1.5 30/06/2017 0.4 5.5 6,608 6,167 441 976 0.4% 2.8 30/06/2017 1.4 31/07/2017 0.4 4.7 6,495 6,073 422 978 0.2% 2.8 31/08/2017 0.7 5.3 6,279 6,169 109 978 -0.1% 2.8 30/09/2017 0.7 2.5 6,811 6,143 668 979 0.2% 2.8 30/09/2017 4.5 Date CPI (%) Disc rate % Ind Prodyoy% Exports ($M) Imports ($M) Trade bal ($M) M3 (INR 10M) M2 mom% Date GDP yoy% 28/04/2017 3.0 6.25 3.2 24,635 37,884 -13,249 12,620,590 31/12/2016 6.7 31/05/2017 2.2 6.25 2.9 24,015 37,856 -13,842 12,722,948 0.8% 31/03/2017 5.6 30/06/2017 1.5 6.25 -0.2 23,563 36,522 -12,960 12,809,450 0.7% 30/06/2017 5.6 31/07/2017 2.4 6.25 0.9 22,544 33,994 -11,450 12,857,420 0.4% 31/08/2017 3.3 6.00 4.3 23,819 35,463 -11,644 12,926,418 0.5% 29/09/2017 3.3 6.00 28,613 37,598 -8,984 13,233,780 2.4% 31/10/2017 6.00 13,181,191 -0.4% INDIA US CHINA GERMANY UK JAPAN
- 15. MONTHLY VIEWPOINT From the Chief Investment Officer Marco E Pabst 9th November 2017 ACPI Investments Ltd. Pegasus House | 37-43 Sackville Street | London W1S 3EH T +44 (0)20 3697 9580 | F +44 (0)20 3697 9501 | E marco.pabst@acpi.com www.acpi.com 15 Performance of different asset classes Source(s): ACPI, Bloomberg EQUITIES Currency OCTOBER 2017 2016 2015 2014 2013 2012 2011 MSCI World USD 2,036.8 1.8% 16.3% 5.3% -2.7% 2.9% 24.1% 13.2% -7.6% MSCI World (EUR hedged) EUR 155.2 2.4% 12.3% 5.6% -0.2% 7.4% 25.4% 12.0% -7.8% MSCI World (GBP hedged) GBP 802.4 2.4% 12.9% 6.0% -0.1% 7.9% 26.5% 12.6% -7.9% MSCI World (USD hedged) USD 537.3 2.5% 14.0% 7.2% 0.1% 7.6% 26.1% 13.1% -23.3% MSCI World local Local 574.6 2.6% 14.8% 6.8% -0.7% 7.2% 22.9% 13.2% -8.5% US (S&P500) USD 2,575.3 2.2% 15.0% 9.5% -0.7% 11.4% 29.6% 13.4% 0.0% Europe (Stoxx 600) EUR 395.2 1.8% 9.4% -1.2% 6.8% 4.4% 17.4% 14.4% -11.3% Eurozone (Euro Stoxx 50) EUR 3,674.0 2.2% 11.7% 0.7% 3.8% 1.2% 17.9% 13.8% -17.0% Germany (DAX30) EUR 13,229.6 3.1% 15.2% 6.9% 9.6% 2.7% 25.5% 29.0% -14.7% UK (FTSE 100) GBP 7,493.1 1.6% 4.9% 14.4% -4.9% -2.7% 14.4% 5.8% -5.5% France (CAC40) EUR 5,503.3 3.3% 13.2% 4.9% 8.5% -0.5% 18.0% 15.2% -16.9% Greece (ASE) EUR 759.3 0.5% 18.0% 1.9% -23.6% -28.9% 28.0% 33.4% -51.9% Spain (IBEX) EUR 10,523.5 1.4% 12.5% -2.0% -7.2% 3.7% 21.4% -4.7% -13.1% Italy (MIB) EUR 22,793.7 0.4% 18.5% -10.2% 12.7% 0.2% 16.6% 7.8% -25.2% Japan (Nikkei 225) JPY 22,011.6 8.1% 15.2% 0.4% 9.1% 7.1% 56.7% 22.9% -17.9% MSCI Emerging Markets USD 1,119.1 3.5% 29.8% 8.6% -17.0% -4.6% -5.0% 15.1% -20.4% MSCI Emerging Markets local Local 60,011.4 3.8% 25.9% 7.1% -8.0% 2.5% 0.9% 13.9% -14.9% MSCI Asia ex Japan USD 692.0 4.7% 34.5% 2.9% -11.3% 2.2% 0.7% 19.4% -19.2% MSCI Eastern Europe USD 158.4 -0.3% 8.0% 33.0% -8.1% -40.0% -2.9% 13.2% -23.3% MSCI Latin America USD 2,809.3 -3.7% 20.0% 27.9% -32.9% -14.8% -15.7% 5.4% -21.9% Russia (MICEX) RUB 2,064.3 -0.6% -7.5% 26.8% 26.1% -7.1% 2.0% 5.2% -16.9% India (Sensex) INR 33,213.1 6.2% 24.7% 1.9% -5.0% 29.9% 9.0% 25.7% -24.6% Brasil (Bovespa) BRL 74,308.5 0.0% 23.4% 38.9% -13.3% -2.9% -15.5% 7.4% -18.1% Hong Kong (Hang Seng) HKD 28,245.5 2.5% 28.4% 0.4% -7.2% 1.3% 2.9% 22.9% -20.0% China (Shanghai Comp) CNY 3,393.3 1.3% 9.3% -12.3% 9.4% 52.9% -6.8% 3.2% -21.7% South Korea (Kospi) KRW 2,523.4 5.4% 24.5% 3.3% 2.4% -4.8% 0.7% 9.4% -11.0% Israel (TA 25) ILS 1,438.6 1.2% -2.2% -3.8% 4.4% 10.2% 12.1% 9.2% -18.2% South Africa (Top 40) ZAR 52,570.2 6.5% 19.7% -4.1% 4.2% 6.0% 19.2% 22.2% -0.6% FIXED INCOME OCTOBER 2017 2016 2015 2014 2013 2012 2011 Citigroup WorldBig USD 220.4 -0.4% 5.9% 1.9% -3.2% 0.8% 24.1% 13.2% -7.6% Citigroup WorldBig local Local 223.1 0.3% 2.0% 3.3% 0.9% 7.9% -0.1% 5.6% 5.7% Citigroup WorldBig (EUR hedged) EUR 222.1 0.2% 1.1% 2.4% 0.6% 7.8% -0.2% 5.5% 6.2% Citigroup WorldBig (GBP hedged) GBP 273.7 0.3% 1.8% 3.6% 1.3% 8.2% 0.1% 5.8% 5.9% Citigroup WorldBig (USD hedged) USD 242.0 0.4% 2.6% 3.9% 0.9% 7.8% -0.1% 5.6% 5.5% World government bonds (Citi) USD 935.3 -0.5% 5.8% 1.6% -3.6% -0.5% -4.0% 1.7% 6.4% US Treasuries, total return USD 224.1 -0.1% 2.3% 1.1% 0.8% 6.1% -3.4% 2.1% 9.9% US 10-year yield USD 2.38% 0.05 -0.07 0.17 0.10 -0.86 1.27 -0.12 -1.42 US 10-year bond USD 124.9 -0.3% 0.5% -1.3% -0.7% 3.0% -7.3% 1.3% 8.9% US 5y/5y forward inflation expectation USD 1.96% 0.01 -0.08 0.24 -0.33 -0.51 -0.32 0.58 -0.39 Eurozone government debt EUR 234.2 1.1% 0.6% 3.3% 1.6% 13.1% 2.2% 11.0% 3.4% Eurozone corporate bonds EUR 227.5 1.1% 2.8% 4.7% -0.7% 8.2% 2.2% 13.6% 1.7% EU high yield (BofAML) USD 305.6 1.1% 7.2% 9.1% 0.8% -7.4% 15.0% 29.2% -5.6% Germany 10-year yield EUR 0.36% -0.10 0.16 -0.42 0.09 -1.39 0.61 -0.51 -1.14 Germany 10-year bond EUR 162.8 1.1% -0.9% 3.9% 1.3% 12.0% -4.4% 4.8% 11.0% UK 10-year yield GBP 1.33% -0.03 0.09 -0.72 0.20 -1.27 1.19 -0.15 -1.42 Japan 10-year yield JPY 0.07% 0.00 0.03 -0.22 -0.06 -0.41 -0.05 -0.20 -0.14 China 10-year yield CNY 3.89% 0.27 0.83 0.20 -0.79 -0.97 1.03 0.15 -0.47 India 10-year yield INR 6.86% 0.20 0.35 -1.25 -0.10 -0.97 0.78 -0.52 0.65 Russia 10-year yield RUB 7.51% 0.01 -0.78 -1.10 -4.13 5.98 0.89 -1.65 0.61 Loans, total return (S&P LSTA) USD 2,786.4 0.6% 3.6% 10.2% -0.7% 1.6% 5.3% 9.7% 1.5% US High yield (BofAML) USD 1,261.9 0.4% 7.5% 17.5% -4.6% 2.5% 7.4% 15.6% 4.4% US investment grade (BofAML) USD 2,889.1 0.4% 5.7% 6.0% -0.6% 7.5% -1.5% 10.4% 7.5% US mortgages (BofAML) USD 2,069.3 -0.0% 2.3% 1.7% 1.5% 6.1% -1.4% 2.6% 6.1% US municipals (BofAML) USD 552.2 0.2% 4.8% 0.4% 3.6% 9.8% -2.9% 7.3% 11.2% Global high yield (BBG) USD 175.4 0.4% 9.5% 14.8% -4.7% -0.3% 7.6% 18.6% 2.7% EM hard-currency debt (JPM EMBI+) USD 837.7 -0.1% 8.5% 9.6% 1.8% 6.2% -8.3% 18.0% 9.2% EM external government debt (BofAML) USD 1,149.6 0.0% 10.4% 7.6% -1.0% 5.2% -3.3% 17.6% 5.8% EM investment grade (BofAML) USD 371.9 0.1% 6.9% 5.5% -1.0% 3.9% -1.3% 13.2% 5.6% Emerging market spreads USD 222.7 -7.10 -64.13 -218.44 81.55 113.54 43.24 US Investment-grade spreads USD 94.6 -5.84 -29.07 -44.55 49.98 22.95 -31.46 US high-yield spreads USD 366.3 -4.12 -63.41 -289.20 187.09 180.41 -74.78 CURRENCIES OCTOBER 2017 2016 2015 2014 2013 2012 2011 Dollar index 94.6 1.6% -7.5% 3.6% 9.3% 12.8% 0.3% -0.5% 1.5% Euro 1.2 -1.4% 10.7% -3.2% -10.2% -12.0% 4.2% 1.8% -3.2% Pound Sterling 1.3 -0.9% 7.6% -16.3% -5.4% -5.9% 1.9% 4.6% -0.4% Swiss Franc 1.0 -3.0% 2.1% -1.6% -0.8% -10.2% 2.5% 2.6% -0.4% Japanese Yen 113.6 -1.0% 3.0% 2.8% -0.5% -12.1% -17.6% -11.3% 5.5% Renminbi 6.6 0.0% 4.8% -6.6% -4.4% -2.4% 2.9% 1.1% 4.8% Won 1,120.3 2.4% 8.0% -2.6% -7.0% -3.8% 1.0% 9.1% -3.2% Brasilian Real 3.3 -3.4% -0.6% 21.7% -33.0% -11.1% -13.2% -9.1% -11.0% Indian Rupee 64.7 1.0% 4.9% -2.6% -4.5% -2.0% -11.0% -3.1% -15.8% USD real effective exchange rate (Barclays) 133.7 1.9% -4.8% 4.2% 7.9% 7.7% 1.4% -2.7% 1.7% EUR real effective exchange rate (Barclays) 72.7 -0.3% 4.8% -1.2% -4.9% -3.8% 4.4% -1.9% -1.2% JPY real effective exchange rate (Barclays) 124.0 -0.6% -2.6% 3.6% 4.9% -7.1% -17.5% -15.1% 2.5% COMMODITIES OCTOBER 2017 2016 2015 2014 2013 2012 2011 Global commodities, total return (S&P GSCI) USD 2,415.3 3.8% -0.1% 11.4% -32.9% -33.1% -1.2% 0.1% -1.2% Agriculture, spot return USD 276.8 -1.6% -4.9% 2.6% -12.1% -8.3% -22.1% 3.9% -14.9% Energy, total return USD 422.4 4.9% -2.8% 18.1% -41.5% -44.1% 5.1% -1.4% 4.9% Crude oil USD 437.1 4.7% -6.1% 8.0% -45.3% -42.6% 6.0% -11.5% -1.3% Industrial metals, total return USD 1,384.9 4.4% 23.4% 17.6% -24.5% -7.4% -12.9% 1.4% -22.3% Copper USD 4,143.2 5.5% 22.4% 17.3% -24.9% -12.7% -7.9% 4.3% -21.5% Livestock, total return USD 2,086.1 9.6% 16.5% -7.3% -18.3% 14.2% -3.6% -4.0% -1.2% Precious metals USD 1,533.2 -0.9% 8.9% 8.4% -11.1% -4.1% -29.8% 6.2% 6.6% Gold, total return USD 675.6 -1.0% 9.6% 7.7% -10.9% -1.7% -28.7% 6.1% 9.6% REAL ESTATE OCTOBER 2017 2016 2015 2014 2013 2012 2011 All Equity REITS total returns (FTSE NAREIT) USD 16,897.5 0.1% 6.2% 8.6% 2.8% 28.0% 2.9% 19.7% 8.3% FTSE EPRA NAREIT developed markets, total return USD 4,779.6 -0.4% 6.8% 5.0% 0.1% 15.9% 4.4% 28.7% -5.8% FTSE EPRA NAREIT emerging markets USD 2,533.8 1.1% 28.7% 0.2% 2.5% 15.1% -20.0% 36.1% -28.9% New York home prices USD 193.8 0.0% 4.5% 2.8% 3.7% 2.8% 6.2% -0.3% -3.3% Greater London house price (£) GBP 629,611.0 3.1% 2.2% -0.1% 9.9% 11.7% 10.6% 6.8% 6.4% German house prices EUR 121.7 0.0% 4.9% 8.7% 1.7% 6.6% 3.5% 5.0% 8.4% Moscow prop prices (US$/sqm) USD 2,875.0 0.8% 6.5% 3.6% -32.7% -24.8% -2.6% 6.0% 9.5% Beijing property prices (RMB/sqm) RMB 43,492.0 0.0% 10.6% 32.6% 14.7% -3.2% 30.7% -7.9% 7.9% HEDGE FUNDS OCTOBER 2017 2016 2015 2014 2013 2012 2011 Global hedge funds USD 1,265.5 0.7% 5.2% 2.5% -3.6% -0.6% 6.7% 3.5% -8.9% Equity hedge funds USD 1,246.8 0.8% 7.9% 0.1% -2.3% 1.4% 11.1% 4.8% -19.1% Event-driven hedge funds USD 1,665.1 -0.1% 6.4% 11.1% -6.9% -4.1% 13.9% 6.0% -4.9% CTA funds USD 1,156.1 1.9% 1.8% -2.9% -2.0% 5.2% -1.8% -1.0% -4.9% Credit hedge funds USD 2,041.9 0.2% 3.5% 5.0% -4.4% -1.8% 6.9% 7.7% -3.6% Activist hedge funds USD 2,432.8 0.0% 5.6% 9.1% 0.2% 8.5% 19.2% 9.3% -16.9%
- 16. MONTHLY VIEWPOINT From the Chief Investment Officer Marco E Pabst 9th November 2017 ACPI Investments Ltd. Pegasus House | 37-43 Sackville Street | London W1S 3EH T +44 (0)20 3697 9580 | F +44 (0)20 3697 9501 | E marco.pabst@acpi.com www.acpi.com 16 Performance and valuations of international equity markets Year to Market Rolling 1-yr Rolling 2-yr Rolling 3-yr EPS growth Country date Cap (USDbn)* change change change 2016E 2017E 2017E 2016E 2017E WORLD All Country MSCI MXWD Index 18.3% 54,471 23.8% 21.3% 19.3% 17.4 15.8 10.2% 2.4% 2.6% Developed World MXWO Index 16.8% 44,559 23.2% 20.0% 19.8% 18.0 16.5 8.9% 2.4% 2.5% Emerging World MXEF Index 30.6% 9,912 28.0% 32.1% 13.6% 14.1 12.0 17.7% 2.4% 2.7% AMERICAS US (S&P500) SPX Index 15.6% 22,847 24.1% 23.3% 27.4% 19.4 17.6 10.1% 1.9% 2.1% US (Dow Jones Industrial) INDU Index 19.1% 6,550 31.6% 31.4% 34.1% 18.7 17.2 9.1% 2.2% 2.4% US mid/small cap RTY Index 10.2% 2,395 28.5% 24.6% 27.6% 32.5 24.5 32.3% 1.2% 1.2% Canada SPTSX Index 4.8% 1,892 10.4% 18.2% 10.0% 17.6 15.9 10.4% 2.8% 3.1% Mexico MEXBOL Index 6.3% 301 3.9% 7.3% 8.2% 17.8 16.2 9.8% 2.2% 2.3% Argentina MERVAL Index 65.4% 112 67.0% 116.9% 157.0% 16.9 12.9 30.7% 1.0% Brazil IBOV Index 22.7% 693 20.0% 57.5% 40.4% 14.2 12.6 12.7% 2.8% 3.4% EUROPE Europe SXXP Index 9.5% 12,246 20.3% 4.1% 17.4% 16.4 15.1 8.9% 3.3% 3.5% Germany DAX Index 17.2% 1,427 31.1% 22.4% 43.4% 15.1 13.8 9.4% 2.7% 3.0% France CAC Index 13.0% 1,803 25.5% 10.2% 30.0% 16.1 15.0 7.2% 3.0% 3.3% UK UKX Index 5.7% 2,742 12.8% 18.9% 15.3% 15.2 14.3 6.3% 4.1% 4.3% Spain IBEX Index 10.0% 772 17.0% -1.6% 0.2% 14.5 13.2 9.3% 3.7% 4.0% Italy FTSEMIB Index 19.1% 605 40.3% 1.6% 18.7% 15.9 13.5 17.9% 3.4% 3.7% Switzerland SMI Index 13.4% 1,133 22.7% 3.9% 5.1% 18.8 16.4 14.4% 3.3% 3.5% Norway OBX Index 20.9% 227 33.8% 32.8% 40.1% 17.5 15.9 10.1% 4.1% 4.0% Sweden OMX Index 10.4% 630 19.1% 9.7% 18.3% 17.8 16.3 9.1% 3.5% 3.7% Austria ATX Index 30.1% 112 41.1% 36.6% 54.8% 13.8 13.8 -0.1% 2.7% 3.2% Greece ASE Index 18.7% 55 33.1% 12.8% -20.6% 14.9 15.4 -3.1% 2.2% 2.2% EMERGING EUROPE Hungary BUX Index 25.3% 30 33.6% 79.9% 133.7% 11.1 11.0 1.2% 2.2% 2.7% Kazakhstan KZKAK Index 52.5% 17 60.2% 123.2% 102.8% Ukraine PFTS Index 13.2% 2 12.0% 11.5% -30.0% 9.1 Russia RTSI$ Index -3.7% 527 14.2% 29.9% 9.1% 7.2 6.4 12.2% 5.3% 5.9% Poland WIG Index 23.9% 375 34.6% 29.2% 19.8% 12.7 11.9 7.0% 2.3% 2.7% Czech Rep PX Index 14.6% 55 18.1% 6.8% 9.6% 12.2 13.6 -10.3% 5.2% 5.1% Turkey XU100 Index 43.3% 183 50.8% 36.7% 44.5% 9.2 8.1 12.4% 3.6% 4.1% MIDDLE EAST & AFRICA South Africa TOP40 Index 22.1% 657 24.0% 12.8% 21.0% 16.4 15.1 8.9% 3.0% 3.1% Egypt Hermes Index 23.2% 63.2% 98.9% 49.0% 11.1 10.2 9.0% 2.8% 4.6% Namibia FTN098 Index 10.1% 127 16.1% 18.0% 8.2% 10.6 10.6 0.4% 4.5% 4.6% Nigeria NGSEINDX Index 37.5% 36 36.9% 26.6% 7.1% 18.4% Israel TA-25 Index -3.1% 2.2% -9.9% -1.8% 12.2 11.3 8.4% 1.8% 2.0% Saudi Arabia SASEIDX Index -4.6% 12.7% -1.2% -28.7% 13.8 12.3 12.0% 3.6% 3.9% Qatar DSMIndex -23.0% -19.3% -29.8% -40.9% 12.0 10.6 12.9% 4.5% 4.8% Dubai DFMGI Index 0.3% 8.0% 2.6% -19.6% 12.1 9.6 26.1% 4.2% 4.5% ASIA Asia MXAPEXA Index 44.3% 3,434 40.3% 46.6% 42.0% 14.3 12.6 13.1% 2.2% 2.4% Japan TPX Index 18.0% 5,808 31.0% 17.4% 34.4% 15.9 14.8 7.6% 1.9% 2.0% Japan NKY Index 18.0% 3,479 31.6% 20.7% 37.4% 19.2 17.3 11.3% 1.7% 1.8% Hong Kong HSI Index 30.0% 2,313 26.3% 25.1% 20.9% 13.0 11.9 8.7% 3.5% 3.4% China domestic shashr Index 9.2% 5,017 8.4% -5.6% 39.7% 14.7 13.0 12.7% 2.0% 2.2% China offshore HSCEI Index 22.7% 672 21.4% 9.2% 9.0% 8.8 8.0 9.5% 3.5% 3.8% South Korea KOSPI Index 25.8% 1,413 28.6% 24.9% 31.7% 1.5% 1.8% New Zealand NZSE Index 13.2% 85 15.6% 23.9% 32.6% 20.7 18.6 11.4% 4.0% 4.3% Australia AS30 Index 5.4% 1,426 14.5% 14.4% 10.0% 16.6 15.7 5.6% 4.2% 4.4% Pakistan KSE100 Index -14.1% 67 -1.9% 19.2% 33.9% 9.4 7.9 18.7% 5.7% 6.5% Thailand SET50 Index 12.2% 340 16.9% 18.5% 2.8% 16.3 15.1 8.3% 2.9% 3.1% Indonesia JCI Index 14.2% 492 12.8% 32.5% 20.2% 17.7 15.7 12.8% 2.0% 2.3% India NIFTY Index 27.9% 1,161 24.1% 31.6% 25.6% 21.2 16.9 25.3% 1.4% 1.6% Singapore FSSTI Index 17.3% 436 21.2% 12.2% 2.7% 15.4 14.2 8.0% 3.2% 3.3% Malaysia FBMKLCI Index 6.1% 250 5.7% 3.4% -4.9% 16.3 15.3 6.1% 3.3% 3.5% Philippines PCOMP Index 24.6% 196 17.9% 19.7% 17.8% 20.7 18.5 12.1% 1.4% 1.5% Vietnam VNINDEX Index 27.7% 94 27.4% 38.7% 42.0% 17.3 15.3 12.8% 2.4% 2.3% Source(s): ACPI, Bloomberg Data as of: 31-Oct-2017 * Market cap for the main index PER Dividend yield
- 17. MONTHLY VIEWPOINT From the Chief Investment Officer Marco E Pabst 9th November 2017 ACPI Investments Ltd. Pegasus House | 37-43 Sackville Street | London W1S 3EH T +44 (0)20 3697 9580 | F +44 (0)20 3697 9501 | E marco.pabst@acpi.com www.acpi.com 17 Three-month outlook Highly indebted major World economies are characterised by steady GDP growth, low inflation and re-synchronised growth patterns whilst the lack of fiscal stimulus puts the burden on central banks, which will keep interest rates relatively low for a long time to come. Weight Cash We are slightly overweight cash from reductions in fixed income. Equities US Valuations are high but US equities benefit from improving growth. Rising wages and a stronger dollar could provide EPS headwinds. Positive sentiment was the missing ingredient to push stocks closer to the tops in this cycle. Europe Earnings growth continues to be robust and the economic backdrop of the euro zone is very strong. Interest rates will stay low for the foreseeable future while macro risks include the situation in Spain and Germany’s fragile government. Japan Japanese equity markets are still amongst the cheapest globally and for as long as yields remain anchored, the market remains attractive, although currency volatility induces substantial equity volatility in the country. China H shares are attractive but onshore markets are still overvalued with the country undergoing a major transition. The domestic consumer is becoming stronger and savings are rising, helped by pro-growth fiscal support. EM Earnings growth is solid and valuations reasonable although political risks are present and the outlook for a stronger dollar is not priced into EM equities. Central Banks Aggregate central bank balance sheets are still expanding on a global level although the Fed started tightening already and the ECB is expected to announce similar steps soon. FixedIncome DM govt In the medium term, yields can rise further as expectations for growth and inflation improve. As sovereign bonds are very expensive, downside risks prevail and the asset class is only suitable as a hedging instrument. EM govt Dollar bonds of countries with low external debt levels and low/no trade and budget deficits are interesting. Should the dollar strengthen again, risks within EM would increase. DM credit Spreads have been tightening, supported by recovering commodity prices. Spreads in the US and the UK are more attractive than in the Eurozone where rates are extremely low but likely to rise. EM credit We avoid issuers with substantial hard-currency debt relative to the underlying revenue mix. We would stress-test balance sheets against any EM FX deterioration. Spreads for fundamentally strong issuers in hard currency are attractive. Alt FI We like alternative areas of fixed income such as peer-to-peer lending (P2P) and structured credit. P2P lending offers diversified and uncorrelated low double-digit return streams and returns in structured credit are still attractive. Currencies USD GDP growth is solid, inflation is under control and the Fed is set to continue to raise rates and reduce its balance sheet. There is also the possibility of a successful tax reform in the US which would be short-term bullish for the USD. EUR The euro performed strongly this year and is expected to consolidate. Any further tapering by the ECB would also be bullish for the euro and Eurozone assets. Short term overbought. JPY The BoJ has turned less aggressive recently with regards to providing additional monetary stimulus. The market is trying to find a new direction for the yen. Inflation is positive but stable and GDP growth is also robust, which is positive for the currency. EM The weaker dollar has provided tailwinds for EM currencies this year. We prefer commodity exporters over commodity importers. We like RUB, MXN, INR and avoid TRY. A sustainable dollar recovery could pose a threat to EM FX. GBP The GBP cheapened substantially as a result of the Brexit vote. Due to the long timeline of the Brexit process and unpredictable political noise, uncertainty will continue, adding a substantial risk premium to the currency. Rangebound. Commodities Oil The oil market is increasingly rebalancing as inventories are declining and shale production is only growing slowly while demand is growing steadily. Metals Industrial metals have been supported by stronger-than-expected growth in Asia in general and China in particular where the government managed smoothly to rebalance the economy, successfully addressing major areas of concern. General We believe that after its five-year (2011-2015) streak of high negative returns, the commodity complex in general could become more attractive again, especially energy and agricultural commodities but also precious metals as a hedge against tail risks.
- 18. MONTHLY VIEWPOINT From the Chief Investment Officer Marco E Pabst 9th November 2017 ACPI Investments Ltd. Pegasus House | 37-43 Sackville Street | London W1S 3EH T +44 (0)20 3697 9580 | F +44 (0)20 3697 9501 | E marco.pabst@acpi.com www.acpi.com 18 DISCLAIMER This document is provided for informational purposes only. It does not constitute an offer to sell or a solicitation to buy any security or other financial instrument. While based on information believed to be reliable, no guarantee is given that it is accurate or complete. Any investments referred to may not be suitable for the specific investment objectives, financial situation or individual needs of recipients. Reliance should not be placed on the views and information expressed herein when making any individual investment and/or strategic decisions. You should also be aware that the value of investments and any income from them can go down as well as up, and you may not receive back the amount you originally invested. There can be no assurances that appreciation in value of investments will occur, or that currency fluctuations will not affect the outcomes of any investment adversely. Past performance of the index or individual funds is not a guide to future performance. Certain funds invest in emerging markets which by their nature are higher risk and potentially more volatile than those inherent in established markets. This material is for the use of intended recipients only and the contents may not be reproduced, redistributed, or copied in whole or in part for any purpose without the consent of the issuer of this document. Where foreign securities are included in collective investment schemes, there may be additional risks that arise because of events in different jurisdictions. These may include but are not limited to; potential constraints on liquidity and the repatriation of funds, macroeconomic risks, political risks, foreign exchange risks, tax risks, settlement risks and potential limitations on the availability of market information. Issued by ACPI Investment Ltd (Registered in England - Number 03781549, at 37-43 Sackville Street, London, W1S 3EH), which is authorised and regulated by the Financial Conduct Authority (Register Number 192403). Details can be found on the following link www.fca.org.uk/register. © 2017 ACPI Investments Limited. All rights reserved. No part of the website may be reproduced by any means, whether graphically, electronically, mechanically or otherwise howsoever, including without limitation photocopying and recording on magnetic tape, or included in any information store and/or retrieval system without the prior written permission of ACPI Investments Limited. UK – London Pegasus House 37-43 Sackville Street London W1S 3EH United Kingdom T +44 20 3697 9501 Channel Islands – Jersey Third Floor 7 The Esplanade St Helier JE2 3QA T +44 (0)1534 716444 South Africa – Johannesburg Block B Ground floor Riviera Road Office Park 6-10 Riviera Road Killarney 2193 T +27 11 771 5315