This document provides information on gas chromatography (GC). It discusses the basic components and operation of a gas chromatograph including gas supplies, injectors, detectors, columns, and data collection systems. It describes how the analyte partitions between the mobile gas phase and liquid stationary phase inside the column. Both packed columns and capillary columns are discussed. Key factors that influence chromatographic separation like column parameters, temperature programming, carrier gases, and injection modes are summarized. The document also provides details on retention indices, stationary phase characterization, and theoretical plates.
1. Gas Chromatography
Chromatography: Separate analytes in a mixture
with a resolution ≥1.5 in the shortest amount of
time and detection of separated components.
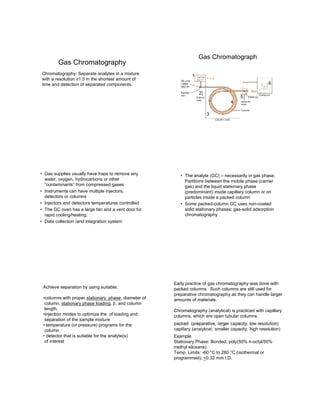
Gas Chromatograph
1
2
3
4
5
6
= m.p.
• Gas supplies usually have traps to remove any
water, oxygen, hydrocarbons or other
“contaminants” from compressed gases
• Instruments can have multiple injectors,
detectors or columns
• Injectors and detectors temperatures controlled
• The GC oven has a large fan and a vent door for
rapid cooling/heating.
• Data collection /and integration system
• The analyte (GC) – necessarily in gas phase.
Partitions between the mobile phase (carrier
gas) and the liquid stationary phase
(predominant) inside capillary column or on
particles inside a packed column
• Some packed-column GC uses non-coated
solid stationary phases; gas-solid adsorption
chromatography
Achieve separation by using suitable;
•columns with proper stationary phase, diameter of
column, stationary phase loading, , and column
length.
•injection modes to optimize the of loading and
separation of the sample mixture
• temperature (or pressure) programs for the
column
• detector that is suitable for the analyte(s)
of interest
Early practice of gas chromatography was done with
packed columns. Such columns are still used for
preparative chromatography as they can handle larger
amounts of materials.
Chromatography (analytical) is practiced with capillary
columns, which are open tubular columns.
Example
Stationary Phase: Bonded; poly(50% n-octyl/50%
methyl siloxane)
Temp. Limits: -60 °C to 280 °C (isothermal or
programmed); <0.32 mm I.D.
2. Open Tubular Columns
WCOT, SCOT: s.p. is coated as a film.
PLOT
Porous
WCOT specifically is the primary type of capillary
GC column for quantitative analysis:
Higher resolution and shorter analysis time and allows
greater ability to discriminate between components.
Capacity is small, is of less concern for analytical
purposes as long as sufficient analyte is available for
detection; pg/mL (ppt) to g/mL (ppb).
• Column constructed of fused silica tubing
• Polyamide coating gives it strength
• Liquid stationary phases coated or chemically
bonded to the inner wall of capillary
• Column diameters 0.10 - 0.53 mm, length 30-60m
Stationary phases –
substituted polysiloxanes
OH
Si
O
Si
O
Si
O
Si
O
Si
O
H
R R
R
R
R
R
R
R
R
R
Column:
Characterized by Stationary phase (mobile phase, LC)
materials inert particle size dp and s.p. loading which
is proportional to the s.p. film thickness df and the
column length L.
Temperature range of operation (GC); s.p. dependent,
Bonded – thermally stable.
Mobile phase - carrier gas (GC), usually an ‘inert’gas,
primarily pushes the material through the column. In
LC; m.p. is a solvent, should be compatible with the
analytes and influences the equilibration process
in partitioning etc.
3. The column suitability for analysis is determined by
s.p/m.p system in LC and, s.p. in GC:
Use a s.p. with similar ‘polar’ characteristics as the
analytes to effect a retention.
Polar analytes require polar stationary phases to be
retained in the s.p.
Non-polar analytes require less/non-polar stationary
phases.
Analytes generally are a mixture of polar and non-
polar components – compromise necessary.
Length vs. resolution Diameter vs. resolution
Stationary phase thickness vs. resolution
Thick films: increases column bleeding
Sample capacity v. resolution
Sample capacity: the amount of sample that can be
injected onto a column without overloading. Often
expressed as grams of sample per gram of packing.
Overloading is defined as the point at which the
sample mass injected makes the column efficiency
N, decrease by 10% from its normal value;
sometimes called sample loading.
4. Capillary columns
Increased length leads to longer separation times;
band broadening problems arise if too long.
Stationary phase thickness and column diameter
increases leads to increased sample capacity and
can provide increased resolution; tradeoffs -longer
analysis time and more column bleed.
Thick stationary phases bleed more - contaminate
MS detection system.
Packed Columns
They have greater sample capacity vs. open tubular
columns but generates broader peaks, longer retention
times and lower resolutions.
Useful for preparative work.
• Capillary Columns:
– Higher R
– Smaller H; high N
– fast
– Greater sensitivity
– analytical
– Smaller sample
capacity
– Higher cost/column
– Columns fragile
• Packed Columns
– Low R
– Larger R, low N
– Slow
– Greater sample
capacity
– Lower cost
– More rugged
– preparative
Capillary vs. Packed Columns
Column selection GC:
Select a stationary phase that would retain
(‘dissolve’) the analytes of interest.
Stationary phase polarity ~ analyte polarity;
(like dissolves like).
Selectivity to individual analytes determines
the quality of separation (ability to discern the
components) measured in terms of relative retention
.
/
A B
Order of elution (GC):
Lesser retained analytes elute earlier.
Given similar molecular characteristics, more
volatile analytes (low b.p., high vapor pressure) elutes
earlier; i.e. low molecular masses elutes earlier.
Consider polarity, molecular mass, b.p./vapor pressure
of analytes in concert with the ‘polarity’ of the phase(s)
to determine the order of elution.
5. Intermolecular Forces (attractive):
IMFs determine the retention times. GC – s.p.
LC – both phases. This is a functional/practical
classification.
1. H bonding
2. Ion-ion
3. Ion-dipole
4. Dipole-dipole
5. Acid-base type
6. Conformational interactions
7. Pi-pi attractions
8. London forces (weakest but always present) sp – nonpolar;
Polydimethylsiloxane
sp – strongly polar
Polyethylene glycol
sp - nonpolar sp – strongly polar
Given similar molecular characteristics,
more volatile analytes (low b.p., high vapor
pressure) elutes earlier; i.e. low molecular
masses elutes earlier.
Retention times changes with the ‘polarity’ of the
stationary phase (GC in particular).
Kovat’s Retention Index:
A logarithmic scale that relates the corrected retention
time tr’, of an analyte to those of linear alkanes in a
given column (s.p.)
Linear alkanes (or any homologous series) elutes in
the increasing order of their molecular masses.
Kovat’s Retention index (RI) by definition for
an alkane = 100n, where n = # C atoms
RI
CH4 100
C2H6 200
C3H8 300
. .
. .
Experimentally plot of log(tr’) vs RI is linear.
RI value for n-alkanes
i.e. linear homologues.
'
'
log( )
' 'log( )
r
r
t a b RI
RI a b t
6. For an analyte eluting from a column (injected with
linear homologues) between the smaller homologue (n)
and N larger homologue (N carbons) has an RI of;
' '
,
' '
, ,
log( ) log( )
100 ( )
log( ) log( )
r r n
r N r n
t t
RI I n N n
t t
RI indicates the appearance of a given analyte in the
chromatogram in relation to straight chain compounds.
0.5 14.3 15.7 18.5 min
' '
,
' '
, ,
log( ) log( )
100 ( )
log( ) log( )
log15.2 log13.8
100 8 (9 8) 836
log18.0 log13.8
r r n
r N r n
t t
RI I n N n
t t
I
n N
C8.36
Behaves like an (hypothetical) alkane with 8.36 C atoms.
Different stationary phases (GC) give different RI
values for the same analyte because different
stationary phases will have different retentive
characteristics.
However, in any column order of elution of a
homologous series is the same,
lowest MW/m.p./b.p. elutes first, ….
Column (stationary phase) characterization:
Based on ‘polarity’ (operational IMFs) of the stat. phase.
Polarity of a stationary phase is expressed with RIs of
probe/index compounds in the s.p. of interest.
RI of probe compounds are measured on the s.p. of
interest and on a totally non polar phase – squalene
(IMFs - dispersion forces only).
For probe/index compound: (Risp – RIsqualene) =
McReynold’s Constant is calculated.
Index compound Measures IMF of
type
Benzene Aromatic, olefinic; x’
1-butanol Electron attractor; y’
2-pentanone Electron repeller; z’
1-nitropropane Nitro, nitrile; u’
Pyridine Pyridine; s’
McReynold’s Constant for probe compound:
= I = (RIsp – RIsqualene)
McReynold’s constant measures the retention of a
probe in a s.p., over that in squalene. It is a
measure of ‘a specific type of polarity’ of the s.p.
McReynold’s constant measures the ability to retard
analytes of specific ‘polar’ characteristics on the
stationary phase.
7. Probe compounds and what they measure:
‘polarity’ – arises from the intermolecular forces
certain chemical moieties are capable of exerting.
(hand out)
My web page
x’ y’ z’ u’ s’
Example; x’ = Ibenzene= (RIsp – RIsqualene)benzene
Total (effective) retardation ‘polarity’ of stationary
phase:
' ' ... '
i
I x y s
Average polarity of a s.p.;
,
1
100
5
i
R
i i squalene
I
P
I
Index compound Measures IMFs
Benzene, x’ Aromatic, olefinic
1-butanol, y’ Electron attractor
2-pentanone, z’ Electron repeller
1-nitropropane, u’ Nitro, nitrile
Pyridine, s’ pyridine
Utility of McReynold’s Constants - Examples:
Alcohol + ether; very similar boiling points. Column
to elute alcohol before ether?
z’ (ether); y’ (alcohol). SP2401 or OV210
Ether before alcohol? OV275 or SP2340
Benzene, cyclohexane; boiling points - very similar.
OV101 NO
OV225 Reasonable time frame
OV275 Too long
Almost every column in the ‘short list’ is technically
Usable here. Consider elution times.
8. In C8 and C18 columns the stationary phase is a thin
film of non-polar liquid phase (mono molecular layer)
that has been chemically anchored to an inert material
(Silica particles).
Chemically linked to the silica particles surface by
reaction with the polar silanol groups on the stationary
phase surface and renders them less polar or non-
polar.
C8 columns have silica particles attached to C8
carbon units while C18 is coated with C18 moieties.
C18 columns are more hydrophobic.
Bonded Columns (HPLC)
Modes of Separation: GC
Isothermal = constant temperature
Gradient = varying temperature – temperature too high, causes co-elution
• poor resolution but faster separation
– temperature is too low, longer elution times
• adequate resolution, but a separation that takes
very long
– compromise temperature or program
Column Temperature
• The “simplest” way to alter the separation in GC
is to alter the temperature/program in the oven.
Pressure programming of the carrier gas is less
common.
• By altering the temperature, rate of equilibration
of analytes changes, increases differences in the
capacity factor (k’ ↔ K):
– they spend more or less time in the stationary
phase
– the greater the difference in the times between
analytes can be fastened and vice versa.
Temperature Programming: GC
C16 …
decelerate
accelerate
9. i,s i,s s s
i,m i,
' i
m
i
m
i
m
n C V V
=
n
K
k
V
K
C V
low ki’ too high ki’
i,s
,
i
i m
C
K
C
• “Inert” gases (do not react/interact with analytes)
• Function:
– sweep the sample through the column
– protect the column from oxygen exposure
(especially) at high temperatures
– assist with the function of the detector
GC Carrier Gases (mobile phase)
– Helium (availability in relatively pure state,
but availability issues are cropping up)
– Nitrogen (requires oxygen and water traps)
– Hydrogen
• normally used in FID (fuel for the flame)
• rarely used in as a carrier gas - safety concerns
• current developmental work has addressed the
safety issues
GC Carrier Gases (mobile phase)
H
u
A
C
B
Hmin
B
H= A + +Cu
u
Typical plot
H
u
B
H= A + +Cu
u
High u without compromising H.
Well packed; small dp
distribution lowers A
Better particle morphology, low bonded phase
density (reduce mass transfer delays)
reduces slope, C
B not much can be done
with column itself,
minimize the time of
residence, optimum u
High u without compromising H.
10. • Samples are injected through a septum:
– keeps oxygen out of the column
– provides a seal - carrier gas pressure up at
the head of the column
• The injector is usually lined with a de-
activated glass liner
GC Injection
Injection modes
• On-Column Injection:
– used widely in packed-column GC, less in
capillary GC
– sample - deposited directly on the column
• Good for thermally unstable compounds
• Good for quantitative analysis at low
concentrations
– entire sample reaches the detector
• Smaller injections (Capillary GC)
• Splitless Injection:
– Sample - vaporized in the injector and ALL
of the sample is swept onto the column by
the carrier gas
– Relatively small samples (≤10 L)
– Sample spends a large amount of time in
the injector
– Best for trace (1 -100 ppm range)
concentrations of high boiling point
analytes in low boiling point solvents
• extra time in the injector helps volatilize the
analytes.
11. • Split Injection:
– injection is split, with only a fraction of the
sample (usually 1% - 20%) actually makes it
to the column
– the most common method of injecting
samples onto small diameter, open-tubular
columns.
• Even for injections 20 L, only a fraction (which is
adjustable) makes it on to the column
– Not for analytes mixtures with a wide range of
boiling points
• some may be swept out the split vent before they
are volatilized
Modern capillary GCs come with a Split/Splitless
injectors standard.
Switch between modes by changing the split vent
gas flow and using a different injection liner.
Splitless injection –trace analysis, split valve is
closed, most of the sample is introduced on the
column. @ flow rate ~1 ml/min. transfer to the column
takes a long time. Thus peak tailing.
Splitless time - split valve opened after 20 - 120s,
sample transfer stops. Yet long transfer can be long,
results in increased peak width.
Solvent trapping - sample injected with the column at
a temperature <20°C the boiling point of solvent .
After ~30s (splitless time) increase the temperature
fast 20°C above solvent boiling point. Fast transfer
from gas to liquid and again to the gas phase
sharpens the elution band.
12. ' ' '2
m
column ' 2
2
2
f
' 2
s m
2 D qk 1+6k 11
H = +
d
u
u (k 1) D 24( 1
r
D
)
k
u
k
GC Capillary Columns:
• Numerous types of detectors available
• Requirements:
– sensitive to the analytes of interest
– compatible with the column, carrier gas,
solvent, etc.
– rugged
– useful linear range
GC Detectors
• have it’s own temperature control.
• Measures response as a voltage or a current.
TCD
Non Destructive
• Carrier gas has a thermal conductivity.
• The presence of analyte molecules in the carrier gas alter
(lowers) the thermal conductivity of the gas
• Second filament to act as a reference (the carrier gas is
split)
• Increased sensitivity with decreasing temperature
(detector), flow rate and applied current.
• Universal detector
• The detector temperature selection; a balance between
sensitivity, filament life and boiling points of analytes. Low
temperatures give high sensitivity and longer filament life.
High temperature assures gaseous state of the analytes.
13. FID
2
CH O CHO e
• Destructive detector
• Analytes containing C burn in a hydrogen-oxygen
flame and produce ions
• CHO+ ions are collected on a cathode and the
current they produce results in the signal
• Detect carbon containing compounds
• A makeup gas may be required
ECD
+
http://www.srigc.com/ECDman.pdf
Electrons travel between a 63Ni electrode and a
collector electrode
As analytes with “electron capturing ability” pass
through the cell, the flow of electrons is reduced.
The change in current, due to reduced flow of
electrons, proportional to the analyte conc.
Very sensitive to halogens, nitriles, carbonyls, nitro
compounds pesticides, herbicides and PCBs in
environmental samples.
Non-destructive detector.
FPD: Flame Photometric
Detector
14. sample exits the analytical column into a hydrogen
diffusion flame.
Ions and atoms (excited) produced by organic
compounds during combustion
When compounds are burned in the FPD flame,
they emit photons of distinct wavelengths
photons that are within the frequency range of the
filter specifications can pass through the filter to
the PMT. The PMT generates a proportional
analog signal (current)
uses band pass filters over the PMT to selectively
detect compounds containing S and P.
FID
S-Chemiluminescence
Combustion of sulfur compounds forms SO.
Reaction of SO with ozone (O3) is chemiluminescent.
The reaction mechanism:
S-compound + O2 SO + Other Products
SO + O3 SO2 + O2 + h (300-400 nm)
The light (h) passes through an optical filter and
is detected by a photomultiplier tube. The current
generated in the PMT is proportional to the
concentration of the analyte.
GC-MS
MS
The GC eluate is a mixture separated into segments
of pure substances with each analyte segment mixed
with the mobile phase.
These are introduced into a ion source of a MS,
blasted with electrons, which cause them to break into
pieces and turn into positively charged molecular ions
and fragmented ions (ion source).
Ions are directed to travel thro’ a ‘filter’ where the ions,
based on ‘masses’ are filtered and ‘detected’. The filter
continuously scans through the range of masses as the
stream of ions come from the ion source.
Ionized analyte generally produce many
smaller ions apart from the molecular ion. In
TIC the current generated by all such ions from
analytes is measured, which would be
proportional to the amount/concentration of analyte.
A plot of TIC vs t is equivalent to the
chromatogram.
15. analytes
MS interface
vacuum
vacuum
“sampler” and “skimmer” cones, they
“peel off” most of the carrier gas.
vacuum
Mass Spectrometer: Quadrupole
A given molecule generates many ion fragments.
Every segment of the chromatographic eluate would
generate ions. A plot of the total ion current (TIC)
measured as a function of time would be the
chromatogram (total ion chromatogram).
Two other modes of detection;
a. selected ion (monitoring- SIM) current is detection
b. selected reaction monitoring (later)
makes MS a very sophisticated and versatile detection
system.
TICs are plots of summed current from all the ions
generated at the ionization stage of the eluting
analytes. The plot resembles a normal chromatogram.
SIM chromatograms are generated by selecting a
specific ion or a narrow range of specific ions
generated at the ionization stage fro the eluting
analytes. This mode is more sensitive and generates
a cleaner background.
Therefore many eluting peaks will not be shown on
the plot.
+,
m/e = 78
16. MS allows qualitative analysis of analytes using the
full scan of all the ions produced during the ionization
process (mass spectrum).
Analysis of the mass spectra of each analyte and/or
comparison of spectra from MS libraries to
experimental spectra accomplishes the identification
of analytes.
Headspace Analysis Headspace Vial
G = the gas phase - headspace and lies above
the condensed sample phase.
S = the sample phase - the sample phase contains
the analytes; liquid or solid in combination with a
diluent or a matrix modifier.
Sample phase is introduced into the vial and the vial
is sealed, volatile components diffuse into the gas
phase until the headspace has reached a state of
equilibrium. The sample is then taken from the
headspace with a gas sampling syringe.
It is most suited for the analysis of the very light
volatiles in samples that can be efficiently partitioned
into the head space gas volume from the liquid or
solid matrix sample.
The technique is the preferred method for the analysis
of gases and very light volatiles which can not be
analyzed by other techniques such P&T and
Thermal Desorption.
Purge-Trap & Thermal Desorption
Tenax
17. Purge and Trap (P&T) Thermal Desorption is
routinely used for the analysis of volatiles in
environmental samples as well as food samples,
through the proper selection of adsorbent resins,
as Tenax TA.
Water can be eliminated from being introduced into
the GC.
This is important for the analysis of high water
content samples such as food products and water
samples.
SPME injection
SPME injection
www.gerstel.com
Chemical Derivatization (prior to analysis); :
Gas chromatography is for the separation of volatile
compounds which are thermally stable.
GC not always possible (biomedical and environmental
interest) particularly for those of high molecular weight
and/or molecules containing polar functional groups.
Derivatization used when analytes are not sufficiently
volatile, tail significantly (too strongly attracted to the
stationary phase) and thermally unstable (decompose).
Chemical Derivatization would;
•increase the volatility by decreasing the polarity of
compounds.
•reduce thermal degradation of samples by increasing
their thermal stability may reduce tailing. Enable
selective detection of analytes
•increase specific detector response by incorporating
functional groups which lead to higher detector
signals, e.g. CF3 groups for ECD(GC); fluorophores to
enable fluorometric detection (LC), chromophores to
enable UV-VIS detection etc (LC).
18. Column Bleed: At high temperatures s.p. may vaporize
into the carrier gas, resulting in column "bleed".
Gross
contamination