How a Village Dam Project Increased Farmers' Incomes and Improved Livelihoods in Jhalara Village
•Download as PPTX, PDF•
0 likes•33 views

1) An earthen dam was constructed in Jhalara village with support from RF BIJ, storing 446,000 cubic meters of water. This irrigates 217 hectares of private land and benefits 250 families. 2) A study was conducted interviewing 91 households to analyze changes brought by the dam. It found a significant increase in rabi crop production and income for small/marginal farmers, and overall crop yields and incomes have more than doubled since the dam's construction. 3) To ensure sustainability, the villagers formed a water user group that collects fees for irrigation water to fund future dam maintenance without relying on outside support. While impacts have been positive, the summary notes there is still potential for

Recommended
Recommended
More Related Content
What's hot
What's hot (20)
Similar to How a Village Dam Project Increased Farmers' Incomes and Improved Livelihoods in Jhalara Village
Similar to How a Village Dam Project Increased Farmers' Incomes and Improved Livelihoods in Jhalara Village (20)
Recently uploaded
Recently uploaded (20)
How a Village Dam Project Increased Farmers' Incomes and Improved Livelihoods in Jhalara Village
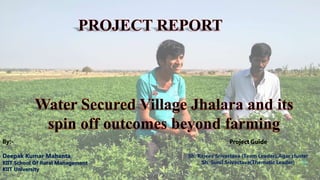
- 1. 1 By:- Deepak Kumar Mahanta KIIT School Of Rural Management KIIT University Project Guide Sh. Rajeev Srivastava (Team Leader),Agar cluster Sh. Sunil Srivastava(Thematic Leader)
- 2. 2 RF BIJ tries to follow watershed approach, conserving every drop of water, through the adoption of local conservation methods. De-risking farmers and their farms from the extreme vagaries of the monsoons forms the basis of this engagement with community. Depending on the geographical location, type of soil, agricultural practices and needs of the community. Many such RF BIJ initiatives have been appreciated by external agencies, including state government. Introduction
- 3. 3 Objectives of Study To collect data, analyze and establish proof of spin off beyond farming due to RF interventions. To understand the changes brought in general well-being of the households in the villages after the intervention. To document the process, results and impact of the interventions with lessons learned.
- 4. Agenda:- period of 2 months Understanding Water Management and study of various developmental activities done in Jhalara with the support of RF Field visit(stayed there for 1 and half months) VFA organization process Water harvesting process Water Security Process Interviewed 91* households out of 250 households on ODK based format Analysis of data *Due to unavailability of farmers only 91 farmers interviewed 4
- 5. Understanding Of Village Jhalara Total Government Land= 359.520 Hectare Total Private Land= 547.810 Hectare Total Irrigated Land= 328.230 Hectare Un-irrigated Land=219.580Hectare 5 • It comes under district Agar Malwa which is a newly formed district • Agriculture was dependent on monsoon • Total population of the village is 1741 • 371 households and is spread in an area of 907.330 Hectares
- 6. Jhalara’s Livelihood pattern: Major Livelihood - Agriculture Average land holding – 2 Ha Kharif crop - Soyabean Rabi Crops- Wheat, Lentil, Coriander Average productivity of the Soybean in rain fed area is 10.5 qt/Ha whereas in irrigated- 15 qt/Ha (uncertain dependency on Rainfall) Production of wheat before RF intervention in rain fed area it is 30-40qtl/ha where as in irrigated land it is 60 qtl/ha (before RF intervention in village only 92.9 ha of land was cultivable during rabi season) 6
- 7. Jhalara earthen dam Top Width of the Dam= 4.25 meter Length of Earthen Dam= 189 meter Total Catchment Area= 778 Ha Cost of Earthen Dam= Rs 55 lac Water Storage Capacity of Dam= 446000 cum(0.446 mcm) Maximum Height of Dam= 10.25 meter A glance at jhalara earthen dam 7
- 8. 8 Impact of jhalara dam The Earthen Dam made is benefitting 250 families of the village and irrigating 217 Hectare of private cultivable land, 12 Hectare developed land Irrigation in horticulture plantation is 18.5 ha The water collected in the dam will remain stored throughout the year and fulfil the drinking, domestic and irrigation requirements of the community. Total wasteland converted into cultivable land due to intervention= 83 Ha
- 11. 11 S. No. Crop Crop Area(Ha) Water Requirement (M /Irrigation) Irrigation Requirement Total Water Requiremen t(cum/Ha) Total Water consumed (cum) 1 Wheat 124 0.05 6 3000 363000 2 Lentil 7.8 0.05 2 1000 5800 3 Gram 5 0.05 2 1000 2000 4 Coriander 6.6 0.05 2 1000 5200 Water Requirement Total Water Consumption= 376000 cum Cost (Rs. /Hectare) Wheat Lentil Gram Coriander Land preparation 3750 3750 2000 2000 Seed 3500 1750 3500 1250 Fertilizers and chemical control 5000 1750 4500 2500 Irrigation 10000 2500 2500 2500 Weeding 1250 - - 1500 Harvesting and Threshing 7500 4000 3000 3500 Transportation 2000 2000 2000 2000 Total cost 33000 15750 17500 15250 Yeild(qtl/ha) 50 15 15 12 Cost of Cultivation • Analysis was carried out between the base year(2011-12) and current year(2016-17). The water collected in the dam will remain stored throughout the year and fulfil the drinking water and irrigation requirements of the villagers. The household members are 250 and the total households benefited are considered as 91 for the study purpose. Out of this, small and marginal farmers are 51 (area <=2 Ha.), medium farmers are 24 (area > 2 and <= 4 Ha.) and larger farmers are 16 (area > 4 Ha.).
- 12. 12 S. No . Crop Total Area sown(Ha ) Cultivatio n cost(Rs/H a) Total Cultivati on Cost(Rs) Estimate d Producti on (qt) Price (Rs /qt) Gross Return (Rs) Net Return (Rs) 1. Wheat 124 33000 4092000 6820 1625 11082500 6990500 2. Lentil 7.8 15750 122850 117 4800 561600 438750 3. Gram 5 17500 87500 125 4000 500000 412500 4. Corian der 6.6 15250 100650 99 4500 445500 344850 Total Cultivation Cost of all the crops= Rs 44,03,000 Total Gross Return= Rs 1,25,89600 Net Return= Rs 81,86,600 Out of the total cultivated area of 143.4 Ha in Rabi season after the intervention of jhalara dam, farmer started to cultivate Wheat, gram, lentil, onion, garlic, ginger, corn and coriander and the farmers get overall profit of Rs. 81,86,600 Production of Crops
- 13. 13 Farmer category Year (2011-12) Year (2013-14) Year (2016-17) Net avg income (kharif) Net avg income(rabi) Net avg total income Net avg income (kharif) Net avg income(ra bi) Net avg total income Net avg income (kharif) Net avg income(rabi) Net avg total income Small and marginal farmer 14547 8218 21602 2355 30978 33333 42582 41918 84501 Medium farmer 21965 4066 26031 921 38138 39059 146125 165648 311774 Large farmer 60475 18641 67071 2848 140694 140694 403307 518138 921445 Overall 32329 10308 38234 2041 69936 71028 197338 241901 439240 Change in Average income in Kharif and Rabi crops from 2011-12(base year) to 2016-17.
- 14. 14 14547 8218 21602 2355 30978 33333 42582 41918 84501 NETAVGINCOME (KHARIF) NETAVG INCOME(RABI) NETAVGTOTAL INCOME NETAVGINCOME (KHARIF) NETAVG INCOME(RABI) NETAVGTOTAL INCOME NETAVGINCOME (KHARIF) NETAVG INCOME(RABI) NETAVGTOTAL INCOME YEAR (2011-12) YEAR (2013-14) YEAR (2016-17) SMALL AND MARGINAL FARMER Small and marginal farmer Change in income pattern:- the change in annual income from the base year to the current year is quite significant in case of small and marginal farmer. 21965 4066 26031 921 38138 39059 146125 165648 311774 NETAVGINCOME (KHARIF) NETAVG INCOME(RABI) NETAVGTOTAL INCOME NETAVGINCOME (KHARIF) NETAVG INCOME(RABI) NETAVGTOTAL INCOME NETAVGINCOME (KHARIF) NETAVG INCOME(RABI) NETAVGTOTAL INCOME YEAR (2011-12) YEAR (2013-14) YEAR (2016-17) MEDIUM FARMER Medium farmer In case of medium farmer, there was a downfall in kharif in the year(2013-14), it was due to less production and heavy rainfall soya bean got destroyed. In the year(2016-17) there was a very significant growth.
- 15. 15 60475 18641 67071 2848 140694 140694 403307 518138 921445 NET AVG INCOME (KHARIF) NET AVG INCOME(RABI) NET AVG TOTAL INCOME NET AVG INCOME (KHARIF) NET AVG INCOME(RABI) NET AVG TOTAL INCOME NET AVG INCOME (KHARIF) NET AVG INCOME(RABI) NET AVG TOTAL INCOME YEAR (2011-12) YEAR (2013-14) YEAR (2016-17) LARGE FARMER Large farmer In case of large farmers as they had also suffered loss in the kharif season in the year(2013-14) but later they had a tremendous growth in their annual income
- 16. 16 14547 8218 21602 2355 30978 33333 42582 41918 84501 21965 4066 26031 921 38138 39059 146125 165648 311774 60475 18641 67071 2848 140694 140694 403307 518138 921445 32329 10308.33333 38234.66667 2041.333333 69936.66667 71028.66667 197338 241901.3333 439240 NET AVG INCOME (KHARIF) NET AVG INCOME(RABI) NET AVG TOTAL INCOME NET AVG INCOME (KHARIF) NET AVG INCOME(RABI) NET AVG TOTAL INCOME NET AVG INCOME (KHARIF) NET AVG INCOME(RABI) NET AVG TOTAL INCOME YEAR (2011-12) YEAR (2013-14) YEAR (2016-17) CHANGE IN ANNUAL NET INCOME PER HOUSEHOLD Small and marginal farmer Medium farmer Large farmer Overall The overall change of production in kharif and rabi season is remarkable mostly in kharif the production is much more better than base year. As there is more than 60% change recorded in the kharif season, which is all due to the the water available for irrigating from the dam. Overall change in annual income
- 17. 17 Criteria Index Total Land Total Kharif Land Total Kharif Production Total Rabi Land Total Rabi Production Up to 5 Bigha 5 274 222 648 222 781 5 to 10 Bigha 10 505 203 1055 202 1623 10 to 20 Bigha 20 836 244 1614 243 1867 More than 20 Bigha >20 1173 231 2047 231 2754 Total Area 2789 900 5365 898 7025 Area/ Household 11 10 21 6 27 Production Per ha 10 Production Per hectare 20 Production Criteria Before interventions of RF After interventions Criteria Inde x No of farmer s Total land(in ha) total cultivat e land from dam Total kharif land under df( in ha) Total kharif producti on under df in (qntl) Total rabi land under df (in ha) Totalrabi producti on under df in (qntl) Small and marginal farmer <=2 51 59 46 54 812 53 1555 Medium farmer >2 and <=4 24 78 36 36 548 36 998 Large farmer >4 16 146 54 54 746 54 1712 Total 91 283 136 144 2106 142 4265 Area/househ old 3 1 1 23 1 46 production/Hect are 14 production/Hect are 29 Crop production increases in both the seasons after RF interventions. During kharif production(qntl)/bigha increases from 10 to 14 and in rabi it increases from 20 to 29
- 18. 18 80 1 5 2 1 2 0 0 0 0 0 31 30 15 3 4 2 1 1 1 0 3 0 10 20 30 40 50 60 70 80 90 Before intervention After intervention Change in annual income:- Increase in production leads to increase in annual income which is clearly visible from the above graph. Before RF intervention there were only 11 farmers whose earnings was above 1 lakhs but after intervention there are now 60 farmers whose annual earnings is more than 1 lakhs.
- 19. 19 Change in production during rabi season:- before intervention, 2150, 34% after intervention, 4261, 66% before intervention after intervention Production increases by 101% afte RF intervention
- 20. 20 Major Impacts • Jhalara Dam – Major income source • Social and economical change • Drinking water secured • Increased water level in wells • Enhanced gender equality • Water available in summer too ! • Reverse migration – employment within the village
- 21. 21 Improved perspective on education of girl children
- 22. 22 What about sustainability of jhalara earthen dam??
- 23. 23 The villagers had also found out a solution for this as a result of which they would not depend on RF in future for any kind of maintenance of the dam, To maintain its sustainability, the members of Jhalara VA had organized a meeting and formed a water user group and decided that those farmers who are utilizing dam water for irrigation purpose should pay an amount of Rs.1000/bigha for the current year and it is Rs 500/bigha from next year own wards. So further if any kind of problem occurs in the dam, the villagers should repair through the money collected and also some rules were created by the water user group embers that no unnecessary usage of water should be there.
- 24. 24 Still miles to go!!!....
- 25. 25 Thank you