1. CHAPTER 4. SOIL SOLUTION COMPOSITION
4.1 Introduction
This chapter investigates the chemical composition of saturated paste extracts,
which can be considered a fair reflection of the soil solution (Sposito, 1989). An
attempt is made to characterise the intensity of the chemical parameters of the soil
solution as opposed to the quantity parameters dealt with in Chapter 3.
Interpreting the composition of the soil solution and assigning conclusions based
on those interpretations is not simple. This is due to the fact that generally, the
elemental concentration in the soil solution is relatively small in comparison with
that on the solid phase (Lindsay, 1979). Due to the chemical sensitivity of the soil
solution to mineral dissolution and ion exchange, it is however, a valuable index of
relative changes in soil chemical status. Apart from a recent study by Nowicki
(1997), there has been no systematic investigation of soil solution composition with
respect to the effects of afforestation in Southern Africa.
4.2 Materials and methods
The soil samples were air dried and passed through a 2mm sieve. A 300 g
subsample was wetted with deionised water to the point of saturation and allowed
to equilibrate for 24 hours, before extracting the solutions under vacuum using a
plastic Buchner funnel (Rowell, 1994). The saturated paste extract was then
centrifuged and passed through a 0.45µm membrane filter. pH was measured both
prior to extraction in the saturated paste, and after extraction in the supernatant.
Solution pH was measured using a Metrohm 691 pH meter and combination
electrode. EC levels were measured using a Crison microCM 2201 conductivity
meter. Major ions were determined by ion chromatography, using a Dionex DX300
ion chromatography (IC) system (Appendix B). Trace elements were determined
using a Perkin-Elmer ELAN-6000 inductively coupled plasma - mass spectrometer
(ICP-MS) system. Prior to analysis by ICP-MS and IC, the samples were filtered
43
2. (0.2µm) and diluted, to a concentration below 100µS/cm.
Aluminium was determined colorimetrically using the Cr-Azurol S (CAS) method of
Kennedy and Powell (1986) (Appendix B). Dissolved monomeric silica (H4SiO4) was
colorimetrically determined using the molybdosilicate method (Method No. 4500-Si
D, Eaton et al., 1995). Dissolved organic carbon analysis was conducted on
0.45µm filtered samples. The analysis was conducted using a variation of the
persulphate oxidation method as found in Eaton et al. (1995) and described in
detail in Appendix B.
Chemical speciation calculations were carried out for all solutions using the
MINTEQA2 mathematical model (Alison et al., 1991). The Davies equation option
was selected for calculating activity coefficients.
4.3 Results and discussion
The chemical composition of the saturated paste extracts is presented in Table 4.1.
Data reproducibility and precision are presented and discussed in Appendix C.
4.3.1 pH of the saturated paste
The pH levels of the saturated pastes range from 4.36 to 4.91, indicating a highly
acidic environment which coincides with the state of soil acidity discussed in
Chapter 3. The differences in pH values were observed to be generally higher in
the supernatant than in the paste. The reason may lie with the suspension effect
(greater ionic activity near the soil particles) and the variation of CO2
concentrations between the soil:water suspension and the supernatant (McLean,
1982). The pH values discussed in this chapter are those of the saturated paste,
since it can be assumed that the paste provides a better indication of the chemical
characteristics of the solution phase in a saturated soil, than does the extracted,
partially re-equilibrated supernatant.
table
44
3. 4.3.2 General composition of the saturated paste extracts
The major anion and cation composition of the saturated paste extracts is
summarised in Figures 4.1 and 4.2.
The chemical composition of the saturated paste extracts portrays a considerable
excess of cations (up to 3.68 mmolc/l). The acidic environment indicates that
45
4. carbonates are likely to be present in insignificant concentrations. The presence of
DOC levels (up to 193 mg/l), may provide a possible explanation for the high levels
of cation excess. Dissolved organic matter is acknowledged to be high if it accedes
70 mg/l of C (Drever, 1997) and is widely recognised to have an overall anionic
character (McBride, 1994). Thus, it is likely that the DOC may contribute
substantially to the negative charge of the solutions investigated in the current
study.
Additional major anions in solution which are present in a relatively similar order of
magnitude are Cl−
(0.14-0.88 mmolc/l), F−
(0.02-0.63 mmolc/l) and SO4
2-
(0.07-0.92
mmolc/l). The presence of F−
as a co-dominant anion to Cl−
and SO4
2-
in solution is
unexpected, but may be related to the influence of parent material. Shale is known
to contain fluorine in significant concentrations, though variation in the chemical
compositions of a single type of rock may vary (Drever, 1997). The possibility of
chemical variation within the shale may explain some observations made in
previous studies in the Sabie area, where the absence of such significant amounts
of fluorine in soil solutions (of surface soils) under pine plantations was noted
(Nowicki, 1997).
In addition to the previous statement, fluoride was not detected in concentrations of
similar magnitude in studies of pine forest soil solutions in the Northern
Hemisphere (Binkley and Richter, 1987; Pritchett and Fisher, 1987; Ross and
Bartlett, 1992; Bockheim and Langley-Turnbaugh, 1997).
46
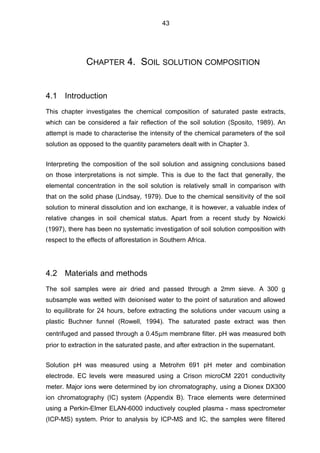
6. SO4
2−
0
1
2
3
4
K1 I1 I2 I3 I4 I5 I6 I7 G1 G2 G3 R1 R2 R3 R4 R5 R6 B1 B2 B3 B4 B5
Figure 4.2: Major anion composition of saturated paste extracts of the soil
collection. Concentrations (Y axis) are presented in mmolc/l. Anion
deficit was calculated as the difference between the sum of inorganic
cations (Figure 4.1) and anions.
The importance of F−
in solution is magnified in the presence of Al under acidic
conditions. The Al-F complexing is widely discussed in the context of acid soils
(Gibson et al., 1992; Schecher and Driscoll, 1995) and phytotoxicity (Nagata et al.,
1993; Stevens et al., 1997). The complexation of Al with F dramatically affects the
speciation of Al in solution. Consequently the monomeric Al determined by the
Chrome-Azurol S (CAS) method, which according to Kennedy and Powell (1986) is
likely to largely exclude Al-F complexes, underestimates the soluble Al present in
solution.
Anionic compounds of nitrogen (NO3
-
, NO2
-
) were detected in very low
concentrations that were orders of magnitude lower than that of NH4
+
(Table 4.1).
This suggests a possible inhibition of nitrification processes by the highly acidic
environment (Tisdale et al., 1985). The low concentrations of nitrite are in
contradiction to previous studies conducted in pine plantations in the eastern
escarpment where nitrate levels were observed to range between 0.02mmolc/l to
2.65mmolc/l, and were orders of magnitude similar to that of ammonium (Nowicki,
1997).
48
7. 4.3.3 Electrical conductivity (EC)
The values of EC range from 76 to 232 µS/cm with a mean of 134 µS/cm (Table
4.1). The soil collection exhibits EC levels similar to those presented by Nowicki
(1997) for forest soils studied in the same area (85-452 µS/cm, mean: 185).
The soil collection also exhibits a significant correlation between EC and the period
of afforestation (Figure 4.3a). The correlation suggests a significant decrease in the
ionic strength of the soil solution as the age of the plantation increases. This
decrease indicates a state of decline in nutrient availability in surface soils of
commercial pine forests. The decline in salinity can be attributed to leaching
processes, presumably enhanced by the afforestation - induced acidity, taking
place in the soil over a long period of time. Possible sources of anions in the soil
solution could be decomposition of organic matter, soil respiration, fertiliser
application, anthropogenic atmospheric emissions and marine inputs (Khanna and
Ulrich, 1984).
r
2
= 0.59
p<0.01
0
50
100
150
200
250
300
350
400
450
500
0 10 20 30 40 50 60 70 80
Compartment age
EC(uS/cm)
Current study
a
49
8. 0
50
100
150
200
250
300
350
400
450
500
0 10 20 30 40 50 60 70 80
Compartment age
EC(uS/cm)
Nowicki (1997)
Forest
Nowicki (1997)
Grassland
b
Figure 4.3: EC levels in surface soils of pine forest soils of different
ages and of their adjacent Grasslands.
The decline in EC with period of afforestation should be carefully evaluated and
preferably further investigated. When relevant data from a similar study in the
Sabie area, conducted by Nowicki (1997) was plotted against compartment age, no
correlation between EC and age of afforestation was evident (Figure 4.3b). It is
important to note however, that the study conducted by Nowicki (1997) differs in
some respects from the current study, which may have caused the apparent lack of
correlation between EC and compartment age. Nowicki (1997) compared
grasslands to their adjacent forests and observed an EC decline with an increasing
distance into the forest, though the observations were not statistically significant.
An additional explanation may arise from the different site characteristics, such as
altitude and aspect. In addition, out of the 16 samples presented in Figure 4.3b,
four samples are repetitions (four sites sampled over two consecutive years).
4.3.4 Aluminium (Al)
Dissolved monomeric aluminium (Al(OH)x
3-x
) values range from 1.3 to 3.7 mg/l.
Activity of Al3+
, calculated in the absence of F and DOC ranges from 12 to 62 µM
and for monomeric Al activity from 31 to 91µM. Total dissolved Al (by ICP-MS)
ranges from 0.11 to 1.41mg/l. The data concerning the total dissolved Al was
50
9. disregarded since the it yielded Al concentrations (total dissolved Al) that were
lower than those determined colorimetrically (monomeric Al) and such a difference
can not be rationalised. A possible reason behind the low Al(total) concentration
detected is the period of time (1 month) between the extraction of the saturated
paste and the analysis by ICP-MS, in which increase in pH and precipitation
processes have decreased the concentration of Al(total) in solution.
The method used for the determination of Al follows the colorimetric procedure
suggested by Kennedy and Powell (1986). The main species of Al determined
colorimetrically, and believed to exist in solution, is inorganic monomeric aluminium
- Al(OH)x
3-x
(Kennedy and Powell, 1986; Mulder et al. 1987). Kennedy and Powell
(1986) indicate that interference by F reduces the accuracy of the Al determination
by 94% for a sample containing dissolved concentrations of 0.5 mg/l Al and 1.9
mg/l F. Kennedy and Powell (1986) did not however, report the magnitude of
interference at other concentration ranges of soluble F and Al.
Modelling (MINTEQA2) the distribution of Al species in the saturated paste was
conducted in the presence of DOC and F and in their absence. In the presence of F
and DOC, the saturated paste extracts exhibit a distribution of Al species
dominated by the presence of F (Table 4.2).
Table 4.2: Percent (%) distribution of aluminium species in solution
calculated by MINTEQA2 in the presence of DOC and F.
Sample Al-Dom AlF2+
AlF2
+
ALF3 AlF4
−
K-1 31 23 40 5 <1
I-1 <1 <1 3 76 11
I-2 <1 <1 29 67 4
I-3 <1 3 46 49 1
I-4 <1 <1 24 70 5
I-5 <1 <1 22 72 6
I-6 <1 <1 18 74 8
I-7 5 10 59 26 <1
G-1 <1 <1 28 68 4
G-2 3 6 55 36 <1
G-3 18 18 52 11 <1
51
10. R-1 <1 3 43 51 2
R-2 <1 <1 33 63 3
R-3 12 15 57 15 <1
R-4 6 12 60 30 <1
R-5 <1 <1 24 71 5
R-6 <1 <1 30 66 3
B-1 <1 <1 25 70 5
B-2 <1 <1 17 75 8
B-3 <1 <1 9 75 16
B-4 <1 <1 21 73 6
B-5 <1 <1 22 7 6
S.D. 11 8 17 23 4
Median 9 10 28 67 5
Mean 13 10 33 55 6
The distribution of Al species, when calculated in the presence of F, reveals less
than one percent of free monomeric Al3+
. The Al3+
activity (0.2 to 1 µM) is orders of
magnitude lower than that of the Al species presented in Table 4.2 such as AlF3
(5.8 to 49 µM). From Table 4.2 it is clear that the speciation of Al in solution is
dominated by the formation of various Al-F complexes that constitute almost 90% of
all Al species in solution. A representative sample of speciation calculation is
presented in Appendix E.
The speciation of Al calculated in the absence of DOC and F reveals, as expected,
a different array of Al forms (Table 4.3). The Al3+
species is the dominant form of Al
in solution comprising more than half of the Al species in solution. The hydrolysed
species of Al (Al(OH)x
3-x
) are secondary in their dominance and, in general,
comprise about one third of Al species in solution.
Table 4.3: Percent (%) distribution of aluminium species in solution
calculated by MINTEQA2 in the absence of DOC and F.
Sample Al+3 Al(OH)2+
Al(OH) 2
+
AlSO4+
Al(OH) 3
(aq)
K-1 74 18 6 2 <1
I-1 79 15 4 2 <1
I-2 46 28 22 2 2
I-3 65 21 8 6 <1
I-4 68 22 9 <1 <1
I-5 75 18 6 1 <1
I-6 79 15 4 2 <1
I-7 79 16 4 <1 <1
G-1 74 18 6 2 <1
G-2 42 29 25 <1 3
G-3 75 18 6 1 <1
52
11. R-1 62 19 7 11 <1
R-2 58 25 13 3 1
R-3 33 29 32 <1 5
R-4 65 22 10 3 <1
R-5 66 22 9 2 <1
R-6 60 25 13 2 <1
B-1 66 22 9 3 <1
B-2 66 21 9 3 <1
B-3 68 21 8 3 <1
B-4 79 13 3 5 <1
B-5 79 15 4 2 <1
S.D. 13 5 7 2 2
Median 67 21 8 2 3
Mean 66 21 10 3 3
Another important component affecting Al is organic matter. Aluminium forms
strong complexes with various functional groups inorganic ligands, which vary
among soils. Organic acids are recognised, under certain conditions, to enhance
the total solubility of Al, although quantifying the nature of alumino-organic
complexes involves difficulties which are, to date, not completely solved or
understood (Driscoll et al., 1985; Lindsay and Walthall, 1989).
As previously discussed (Section 3.3.1), the soil collection contains high levels of
organic matter, and therefore it is not surprising that the soil solutions contain quite
high levels of DOC (44-193 mg/l) compared to other studies of forest soils such as
that of Tipping et al. (1995) who found between 1 to 23 mg/l. They are, however, of
similar magnitude to the DOC levels reported by Nowicki (1997; 50-490mg/l for his
Eastern Escarpment soils).
Mineral saturation indices (SI) were also calculated using the MINTEQA2 program.
The SI is commonly used to identify the possible minerals that may be in
equilibrium with the soil solution (McBride, 1994). Accordingly, solutions exhibiting
a positive SI for a particular mineral, are super-saturated with respect to that
mineral. It is important to note that the modelling of mineral equilibria is in many
cases indecisive and should be done with some reservation (May et al., 1986).
The modelling was done in three different ways. Firstly, excluding DOC from the
solution composition, secondly excluding DOC and F and finally including the full
chemical composition. The solubility indices of four selected minerals (quartz,
gibbsite, kaolinite and jurbanite) for the three modelling outputs are presented in
53
12. Figure 4.4.
Observing the change in the saturation index of each of the minerals indicates that
the soil solution, in all three modelling options is super saturated with respect to
quartz, indicating its possible control over the dissolution of Si. Modelling the
saturation index of gibbsite, kaolinite and jurbanite exhibits no significant change
whether DOC is incorporated into solution or not, but the addition of F markedly
changes the picture. At the presence of F the saturation indices of kaolinite,
gibbsite and jurbanite vary dramatically and are for most are under saturated with
respect to these minerals. When F is absent the solution is supersaturated with
respect to kaolinite and gibbsite and slightly undersaturated with respect to
jurbanite.
Figure 4.4
54
13. Of the three Al-minerals presented in Figure 4.4, gibbsite is more likely to be in
control of soluble Al levels. The reason being the slightly superasaturation (near
equilibrium) condition which is consistent at the pH range of the solutions under
study. Alternatively, Al dissolution may be due to the presence of Al-organic
complexes. The likelihood of organic matter abundance and its strong complexation
with Al was suggested by the organic carbon and CuCl2-extractable Al levels
discussed in Chapter 3.
A comparison is presented in Figure 4.5, as a function of pH, between the SI levels
of gibbsite and those of Al-organic matter calculated according to Fey et al. (1998),
based previous studies by Alison et al. (1990) and Cronan et al., (1986). The
calculation of the saturation index of Al-OM is based on the following equations:
SI (Al-OM complex) = log (IAP) − log Ksp
log (IAP) = log Al3+
+ 0.6pH
log Ksp = -2.52
55
14. Figure 4.5: Changes of soil solution saturation indices as a factor of pH
(saturated paste) with respect to gibbsite and Al-OM complexes.
The SI for gibbsite exhibits a general increase with the SI levels for Al-OM is less
sensitive to pH, decreasing slightly with increasing pH levels. The crossing point
between the two relationships suggests that below this pH, the solubility of Al is
controlled by Al-organic matter complexes and above this pH by gibbsite. Such a
result is generally consistent with other studies that suggest that under highly
acidic conditions, the Al-OM complexes are likely to be the more abundant soluble
forms of Al.
The consistency of gibbsite previously discussed suggests that the exclusion of F
from the MINTEQA2 calculations, on the basis of formation of Al-F complexes
preventing an accurate detection of soluble monomeric Al, was appropriate.
Consequently, the exclusion of F from calculations of Al speciation may provide a
better mean of calculating Al3+
activities.
4.3.5 Ca/Al ratio in the soil solution
The Ca/Al ratio of the soil solution ranges between 1.2 to 39 (as a molar ratio), and
between 0.58 to 12.1 (as an equivalent ratio). When calculated in the absence of F
and DOC, the Ca/Al activity ratio ranges between 0.98 to 20 for total monomeric Al
-1
0
1
2
3
4.3 4.4 4.5 4.6 4.7 4.8 4.9 5.0
pH (Saturated paste)
Saturationindex
Gibbsite
Al-OM
56
15. and between 1.6 to 54 for Al3+
, which are similar to that calculated for the molar
ratio. In the presence DOC and F, the Al3+
activity is strongly reduced, exhibiting
Ca/Al activity ratios, which are orders of magnitude higher than those calculated
without DOC and F.
A Ca/Al value of one has been suggested in the literature to represent a 50% risk
for tree growth (Cronan and Grigal, 1995). When the values of Ca/Al ratio drop
below unity, the risk for tree growth increases, and is reported to reach almost
100% at a ratio equivalent to two (Cronan and Grigal, 1995). Most studies of Ca/Al
ratio have investigated the molar ratio of Ca/Al, and employ the concept of Ca/Al =
1 as a critical threshold value for forest health (de Vries, 1991; Sverdrup and
Warfvinge, 1993). Figure 4.6 indicates a drop in the Ca/Al ratio when natural soils
such as grasslands are transformed into commercial forests. In Figure 4.6a, the
Ca/Al ratio calculated in units of mmolc/l, has the value of less than one in some
compartments.
1.E-01
1.E+00
1.E+01
1.E+02
0 10 20 30 40 50 60 70
Compartment age
Ca/Al
Nowicki
(1997)
Forest
Nowicki
(1997)
Grassland
Current
study
a
Equivalent
ratio
57
16. Figure 4.6: Distribution of various Ca/Al ratios in soil solution of pine forest
surface soils of different ages and of grasslands in the Sabie area. In
Figure a, the Ca/Al is presented in mmolc/l, and comprises of data by
Nowicki (1997) for forest soils and grasslands and of the current
study. Figure b consists of grassland soils data (Nowicki, 1997) and
forest soil data (activity and molar ratios) of the current study.
Using geochemical modelling (MINTEQA2) to calculate ion activities produced
considerable higher Ca/Al ratios in the presence of DOC and F than in their
absence. The Ca/Al activity ratios in the presence of DOC and F, presented in
Figure 4.6, exhibits a convergence of ratios with increasing plantation age, the rate
of decline is not statistically significant, and due to the complexity of evaluating Al
in the presence of F, it would be presumptuous to assign trend lines and to draw
definite conclusions regarding possible future effects on forest health.
In regard to phytotoxicity, Al-F complexes are potentially important with respect to
the transport of Al. Studies of tea plants (Camellia sinensis) have found similar Al-F
forms in tea branches and in solution (Nagata et al., 1993). Further observations
were made of Al(OH)X
3-X
species maintaining higher phytotoxicity than AlFX
3-X
species (Stevens et al., 1997). Although the studies discussed above are of crop
plants, a similar situation may possibly occur in trees. Rowell (1991) reports that
toxic levels of Al3+
activity for selected agricultural crops to range from 0.4 to 1µM.
Thus, in terms of the aAl in the soil solutions of the present study, there is no clear
1.E-01
1.E+00
1.E+01
1.E+02
1.E+03
1.E+04
1.E+05
1.E+06
1.E+07
1.E+08
0 10 20 30 40 50 60 70
Compartment age
Ca/Al
Molar
Activity
(including
DOC and F)
Grasslands
molar ratio
(Nowicki,
1997)"
Activity
(excluding
DOC and F)
b (Current study)
(Current study)
(Current study)
58
17. likelihood of Al toxicity. Further research is nevertheless vital for establishing
whether Al-F complexes are likely to affect trees in general and conifers in
particular.
4.3.6 Ammonium (NH4
+
)
The soil solution analysis (Table 4.1) showed relatively high levels of NH4
+
(4.8-
36.5 mg/l), and together with Na+
, these are the dominant cations in solution.
Similar studies conducted in pine plantations in the Eastern Escarpment (Nowicki,
1997) indicate NH4
+
levels (0.09-1.1 mmolc/l) which are similar to those detected in
this study (0.2-1.2 mmolc/l).
The main N species recognised to be present in the forest floor include NH4
+
, NO3
−
and dissolved organic nitrogen (DON), of which the latter (DON), is believed to
associate with humic substances and to represent the dominant form of N transport
(Northup et al., 1995). As the decomposition of organic matter proceeds, nitrogen
compounds are released into the forest floor. Reaching the rhizosphere, N is taken
up in the form of DON, supplying the trees with the necessary N. In a controlled
experiment of pine needle leachate, the loss of nitrogen from the F and H horizons
(forest floor) to the upper mineral horizon was recorded to consist mainly of NH4
+
-N,
whereas the loss of N from the A horizon was found to consist mainly of NO3
−
-N
(Parfitt et al., 1997). This might explain the high concentrations of NH4
+
and low
concentrations of NO3
−
found in soil solutions.
An additional factor that is likely to influence the determination of nitrogen species
in solution involves the procedure of saturated paste preparation. The soil samples
are re-wetted after being air dried and are left for a period of 24 hours to allow
chemical equilibration. Subsequently, the activity of nitrifying bacteria may be
enhanced and processes such as dinitrification may take place, thus reducing, to
an unknown extent, the potential for detecting nitrite and nitrate in solution, and
may create favouring conditions for Nitrosomonas over Nitrobacter.
The present silvicultural policy applied in the plantations under study promotes
accumulation of cuttings from pruning and thinning on the forest floor, and thus
enhances the amount of organic matter in the forest floor and consequently the
59
18. release of nitrogen species into the forest floor. Evaluating with greater accuracy
the possible sources of nitrogen saturation in the soil collection would require
further research involving nitrogen tracer techniques (Hauck, 1982; Drever, 1997).
4.3.7 Fluoride (F−
)
Soluble fluoride concentrations range from 1.9 to 12 mg/l. The forest soils exhibit
high levels of F−
in comparison with previous studies of pine plantations in the
Sabie area (Nowicki, 1997). When the type of underlying bedrock is taken into
account (shale), the magnitude of fluoride levels found in this study are
comprehensible. Drever (1997) presents typical concentrations of selected
elements in various rocks and shows that shale contains Si, Al, Ti and Fe as major
elements and F, Mn and Cs as additional abundant elements (>500 mg/kg).
Granitic rocks (underlying bedrock of sample K1) are also recognised to have
similar levels of fluoride (Drever, 1997). Consequently, in the context of this study
one would expect to find high levels of F in the soils under favourable conditions.
Under acidic surroundings, the dissolution rate of most silicate minerals increases
exponentially, with increasing hydrogen ion concentration. Leaching creates
preferential conditions for mineral weathering and the dissolution of acidic cations,
such as aluminium (Drever, 1997). As previously discussed, in the presence of F,
the formation of Al-F complexes is strongly favoured. Thus, considering the fact
that the elemental composition of shales may include F, and that the waters
draining shales may promote Al dissolution, it would be very likely to detect F in
solution and most probably in various forms of Al-F comprising an abundant form of
monomeric Al in solution (Driscoll et al., 1985; McBride, 1994). Previous sections
discussed the complexation between F and Al and its chemical significance
(sections 4.3.2 and 4.3.4).
The F ion and F complexes present possible toxic effects for plants. Plant uptake of
F was observed to increase with increasing ionic strength of nutrient solutions
(Stevens et al., 1998). As already noted, however, F complexes strongly with Al
and thus may reduce the phytotoxicity associated with soluble Al.
The dominant species of fluoride in solution calculated by MINTEQA2 modelling
are F−
(mean: 33.5%) and AlF3 (mean: 36.7%). Other F species, such as AlF4
−
and
60
19. HF are present in only small concentrations (<5%). The levels of free F−
in acid soil
solutions are reported to drop as the pH of the solution drops (Munns et al., 1992;
Schecher and Driscoll, 1995). Following the observations made in Chapter 3,
where a decline in pH was observed in natural soils converted to forest plantations,
it is reasonable to assume that a drop in pH would decrease the activity of free F−
in solution, since increased concentrations of free Al induced by a drop in pH may
have promoted the formation of AlFx complexes, at the expense of free F−
. This
could also account for the observed reduction of free F−
with increasing plantation
age.
As previously discussed, F−
is the dominant ligand bound to Al in solution.
However, fluoride may not always have this effect on the detection of Al3+
in
solution. Moore and Ritchie (1988) have found that although adding F−
to acid soil
solutions increased total concentrations of Al, it did not decrease the Al3+
concentrations in all cases. These findings were later confirmed by Gibson et al.
(1992).
4.3.8 Dissolved organic carbon (DOC)
The DOC levels in the saturated paste extracts range from 53 to 193mg/l. In
conjunction with the organic carbon levels presented in Chapter 3, and with the
high anionic charge deficit, being probably accounted for by DOC, the soil
collection exhibits a strong "organic" signature. Consequently, and as previously
indicated (section 4.3.4), DOC may have a dominant influence on the dissolution of
Al with respect to mineral saturation indices. In addition, the DOC found in the soil
collection constitute a dominant portion of the anions in solution, and as such, may
affect pH control, enhance acidification, mineral weathering, nitrogen mineralisation
and, as a result, various processes involved in the nitrogen cycle (Parfitt et al.,
1997; Drever, 1997).
Nowicki (1997), while studying various pine forests in South Africa, demonstrated a
correlation between DOC and excess cation charge in solution, suggesting that
61
20. dissolved organic anions account for the apparent deficit of negative charge.
Adopting this concept in the current study has yielded poor results that prevented
the formation of a statistically meaningful trend such as that generated by Nowicki
(1997). The reasons may lie with the limited amount of samples analysed for DOC
and with chemical changes that may have taken place during storage (±4°C) in the
sample solutions prior to the DOC determination. Nevertheless, it is the author's
understanding that the anion deficit can be attributed (in the absence of analytical
errors) to the presence of negatively charged soluble organic matter (McBride,
1994). This assumption was used as a basis for incorporating DOC into the
geochemical modelling.
MINTEQA2 modelling is based on studying metal interactions with Suwannee River
fulvic acid (Lumsdon and Evans, 1995). The model treats dissolved organic matter
as a complex material consisting of various types of monoprotic acid sites. The
concentration of these ligand sites is normally distributed with respect to their log K
values for protons or metals. The nature of the geochemical modelling does not
necessarily represent in an accurate manner of DOC speciation in solutions. For
example, the model is generally restricted to predetermined ionic strength at which
the modelling parameters were determined, as they do not consider electrostatic
effects resulting from polyelectrolite behaviour of humic macromolecules (Lumsdon
and Evans, 1995).
DOC is an important nutritional source for heterotrophic microbial activity that forms
NH4
+
-N (Parfitt et al., 1997). Yet, when an attempt is made to quantify the dissolved
organic acids in solution, some difficulties arise. For example, in the process of re-
wetting dry soils, organic compounds greatly increase their solubility in comparison
to their solubility in the soil prior to sample excavation in the field (Bartlett and
James, 1980).
4.4 Comparing the Ca/Al ratio between the soil solution and the
exchange sites
Combining the observations regarding the exchangeable phase and the soluble
phase results in an interesting association between the two phases. In Figure 4.7,
a summary of the BC/AC ratios is presented. This summary consists of the solution
62
21. Ca/Al molar ratio and the BC/AC ratio of the exchangeable phase as observed in
various local studies (du Toit, 1993; Nowicki, 1997). The comparison between the
Ca/Al ratio in solution to the BC/acidity on the exchange sites was done due to the
lack of data regarding exchangeable Al and Ca in some of the previous studies,
thus preventing the calculation of the Ca/Al ratio of the solid phase. It is not a
fortuitous comparison, since the aim is to show the possible changes taking place
in the soil environment with respect to the state of acidity and basic cations and to
point out some possible trends that may occur.
Figure 4.7: BC/AC ratio on the exchangeable sites and Ca/Al molar ratio in
soil solutions of forest compartments of different ages and of natural
grasslands in the Eastern Escarpment and the Natal Middlands.
It can be seen from Figure 4.7 that the quantity (solid phase) and intensity (soil
solution) of the BC/acidity ratio decreases with increasing plantation age. Both the
soluble phase and the solid phase exhibit similar trends. Although not statistically
significant (r2
<0.4) they do, however, emphasise the importance of the first 2 to 3
decades of afforestation since that period of time was not covered by this study and
consequently no significant trends were able to be calculated. Further studies are
necessary to establish the rate of BC/acidity decline in the first two decades of
afforestation. An important observation from Figure 4.7 is the difference between
the solid phase and the soluble phase with respect to unity level suggested in the
literature as a threshold for forest health. The exchangeable phase has clearly
r2
= 0.39
p<0.01
y = 1.9e
-0.045x
r
2
= 0.37
p<0.01
y = 16e
-0.032x
1.E-02
1.E-01
1.E+00
1.E+01
1.E+02
0 10 20 30 40 50 60 70 80
Compartment age
BC/AC
Exchangeable
phase -
Grassland (du
Toit, 1993;
Nowicki, 1997)
Exchangeable
phase - Pine
forests (du Toit,
1993; Nowicki,
1997; Current
Study)
Soluble phase -
Pine forests
(Current study)
Soluble phase -
Grasslands
(Nowicki, 1997)
63
22. dropped below unity, yet the soluble phase is still above unity. A possible reason
for the higher levels of Ca/Al ratio in solution in comparison with the solid phase is
due to the presence of F. The fluoride ion complexes strongly with Al, thereby
reducing the pool of F-free monomeric Al in solution, consequently creating higher
ratios of Ca/Al which do not account for the monomeric Al-F complexes in solution.
4.5 Conclusions
Interesting trends have appeared of declining levels of ionic strength in solution as
the period of afforestation increases (r2
= 0.59), and of a clear drop in the Ca/Al
ratio as grassland soils are converted to forests, coupled with indications of Ca/Al
ratios falling below unity in some forest compartments. Activity ratios of Ca/Al were
calculated under different conditions showing a state of decline with plantation age
when DOC and F are included in the calculation, and an over all drop in Ca/Al ratio
when DOC and F are excluded, indicating a markedly depletion of basic cations
from the soil solution over the first two decades following afforestation. Further
study and monitoring is necessary for following the changes in the Ca/Al ratio since
ratios falling below unity are associated with growth stress and consequently
reduction in productivity.
Monomeric Al is present in concentrations (1.3-3.8 mg/l) which may be considered
low in such an environment. Yet, due to the overwhelming mass dominance of F
over Al in solution and the strong complexing potential of F with Al, it is reasonable
to expect lower levels of monomeric Al than might have been otherwise anticipated.
The concentrations of soluble monomeric Al would normally be dominated by Al-F
species, and the colorimetric method used for the determination of soluble
monomeric Al is thereby likely to underestimate the total dissolved Al
concentrations in solution. Consequently, Al activity calculations are probably
performed in a better manner when the Al-F complexation reactions are excluded.
This finding may be confirmed through the calculations of mineral solubility
equilibria. The exclusion of F from the calculations of the mineral solubility
equilibria proved beneficial in the sense that the Al-minerals (gibbsite, kaolinite and
jurbanite) have shown greater consistency at the absence of F than in the presence
of F. Further calculations in the absence of F have indicated that gibbsite may
control Al solubility in the studied solutions whereas under the higher acidic
64
23. conditions of the studied solutions, Al-organic matter complexes may dominate the
solubility of Al.
The soil solution contains surprisingly high levels of F−
(1.9-12 mg/l) and NH4
+
(4.8-
36.5 mg/l). The high levels of F found in solution are believed to originate from the
underlying bedrock (shale). Abundance of NH4
+
-N coupled with smaller
concentrations of NO2
−
may be the cause of the method used for the preparation of
the saturated soil pastes and consequently interruption of biochemical processes
such as nitrification taking place in the soil environment. Low pH and certain
organic acids are known to inhibit nitrification processes and alter the balance
between the two main bacterial communities responsible for nitrification. Thus,
altering the balance between the intermediate, and the end products of nitrification.
This is exhibited in this study by the relative abundance of NO2
−
over NO3
−
.
Bearing in mind the high levels of organic carbon found in the solid phase (Chapter
3), it was not surprising to find high levels of DOC in the soil solution (53-193 mg/l).
Based on the assumption that anionic deficit can be attributed to the presence of
negatively charged soluble organic matter, the anionic deficit was ascribed to DOC,
thus adding to the observations of a strong organic matter signature in the upper
mineral horizon of the studied pine plantations.
65