More Related Content
Similar to TABLE3-1.RTF (20)
More from David Sugarman (20)
TABLE3-1.RTF
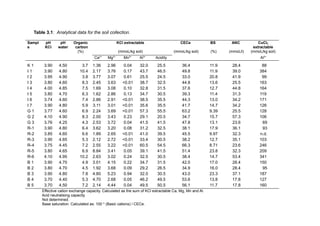
- 1. Table 3.1: Analytical data for the soil collection.
Sampl
e
pH
KCl
pH
water
Organic
carbon
KCl extractable CECe BS ANC CuCl2
extractable
(%) (mmolc/kg soil) (mmolc/kg soil) (%) (mmolc/l) (mmolc/kg soil)
Ca2+
Mg2+
Mn2+
Al3+
Acidity2+
Al3+
K 1 3.90 4.50 3.7 1.36 2.96 0.04 32.0 25.5 36.4 11.9 28.4 88
I 1 3.90 4.80 10.4 2.17 3.76 0.17 43.7 46.5 49.8 11.9 39.0 384
I 2 3.95 4.90 3.8 3.77 3.07 0.61 25.5 24.5 33.0 20.8 41.9 99
I 3 3.80 4.60 8.3 2.45 3.63 <0.01 38.7 32.5 44.8 13.6 25.5 163
I 4 4.00 4.85 7.5 1.69 3.08 0.10 32.8 31.5 37.6 12.7 44.8 164
I 5 3.80 4.70 6.3 1.62 2.86 0.13 34.7 30.5 39.3 11.4 31.3 119
I 6 3.74 4.60 7.4 2.86 2.91 <0.01 38.5 35.5 44.3 13.0 34.2 171
I 7 3.90 4.80 5.9 3.11 3.01 <0.01 35.6 35.5 41.7 14.7 34.2 126
G 1 3.77 4.60 6.9 2.24 3.69 <0.01 57.3 55.5 63.2 9.39 25.5 128
G 2 4.10 4.90 8.3 2.00 3.43 0.23 29.1 20.5 34.7 15.7 57.3 106
G 3 3.76 4.25 4.3 2.53 3.72 0.04 41.5 41.5 47.8 13.1 23.6 69
R-1 3.90 4.80 6.4 3.62 3.20 0.08 31.2 32.5 38.1 17.9 36.1 93
R-2 3.85 4.60 6.6 1.89 2.65 <0.01 41.0 39.5 45.5 9.97 32.3 n.d.
R-3 3.90 4.65 5.3 2.12 2.72 <0.01 33.4 30.5 38.2 12.7 35.1 103
R-4 3.75 4.45 7.2 2.55 3.22 <0.01 60.5 54.5 66.3 8.71 23.6 246
R-5 3.80 4.65 6.9 8.84 3.41 0.05 39.1 41.5 51.4 23.8 32.3 209
R-6 4.10 4.95 10.2 2.63 3.02 0.24 32.5 30.5 38.4 14.7 53.4 341
B 1 3.90 4.70 4.9 3.01 4.15 0.22 34.7 31.5 42.0 17.0 28.4 150
B 2 3.80 4.70 4.5 1.92 3.68 0.09 29.2 26.5 34.9 16.0 28.4 95
B 3 3.90 4.80 7.8 4.80 5.23 0.94 32.0 30.5 43.0 23.3 37.1 187
B 4 3.70 4.40 5.3 4.70 2.68 0.05 46.2 49.5 53.6 13.8 17.8 127
B 5 3.70 4.50 7.2 2.14 4.44 0.04 49.5 50.5 56.1 11.7 17.8 160
Effective cation exchange capacity. Calculated as the sum of KCl extractable Ca, Mg, Mn and Al.
Acid neutralising capacity.
Not determined.
Base saturation. Calculated as: 100 * (Basic cations) / CECe.