SlideShare a Scribd company logo
1 of 9
Download to read offline
1 | P a g e M e a s u r e m e n t & A n a l y t i c s | D a t a B a c k b o n e T e a m
-------------------------------------------
Seresto | YTD | Channel - Media | Baseline Performance
Reviewing Seresto's baseline performance based solely on this Channel Performance data view, we can clearly
see Display outperforms all channels for impressions, clicks and ultimately conversions, whereas digital video
consumes a large share of the budget but underperforms for clicks and conversions.
This basic baseline view suggests the prime KPI and Conversion is likely different for each Channel and for each
Funnel Objective. Therefore, to find spend efficiencies for our media budget, we will need to run modeling at a
deeper level to consider Channel + Platform + Objective.
The net takeaway (which applies to virtually all modeling) is analysis of performance for a single dimension in
isolation without linking other dimensions becomes less meaningful with fewer insights. And in the case of
Elanco's media spends, it may be further complicated when Primary Channel and/or Platform KPIs are
considered.
Channel Percent Spend Percent Impressions Percent Clicks Percent Conversions
Digital Audio 2.01 % 1.38 % 0.09 % 0.20 %
Digital Display 31.78 % 71.72 % 79.12 % 58.90 %
Digital Search 6.87 % 0.14 % 3.28 % 25.71 %
Digital Social 4.55 % 2.17 % 4.12 % 0.78 %
Digital Video 35.13 % 20.71 % 6.27 % 8.30 %
N/A 1.86 % 0.42 % 0.88 % 0.77 %
Retailer Websites 17.80 % 3.47 % 6.25 % 5.32 %
Grand Total 100.00% 100.00% 100.00% 100.00%
Brand Media Cost Impressions Clicks Conversions
Galliprant Baseline $11,954,392.84 1,778,627,237 6,938,517 2,458,172
Digital Audio $240,603.50 24,500,192 5,992 5,033
Digital Display $3,799,591.61 1,275,567,798 5,489,447 1,447,804
Digital Search $820,806.88 2,487,697 227,654 632,106
Digital Social $543,991.78 38,519,375 285,523 19,275
Digital Video $4,199,175.83 368,283,840 435,157 204,125
N/A $222,549.79 7,545,040 61,068 18,954
Retailer Websites $2,127,673.45 61,723,295 433,676 130,875
To effectively build predictive models, we will need to build a linked dataset to include Objective, Channel and
Platform to analyze how baseline spends could be optimized by Objective for future consideration.
To represent what is possible, a Data Model proof case follows for Seresto to demonstrate how baseline
performance metrics can be used for predicting future media spend outcomes.
Seresto | Sample Predictive Modeling (Media Optimization)
Jan. 01 - Nov. 09, 2021
2 | P a g e M e a s u r e m e n t & A n a l y t i c s | D a t a B a c k b o n e T e a m
-------------------------------------------
Brand: Seresto | BASELINE OPTIMIZATION TEST 1 Demonstration
Media Objective: AWARENESS
Data Model Technique: Evolutionary Algorithm
Goal: Analyze media performance by CHANNEL placement spend based on 2021 YTD benchmarks without changing spend
and/or channel inclusion parameters to compare legacy performance against the model's predicted outcome.
Objective: Optimize for Conversion by Channel Spend for the Brand AWARENESS Objective.
What would spend look like by Channel and Platform if we optimized for conversion without changing total media
budget allocation while maintaining all channels and platforms in the media mix.
Model Assumption: A correlation exists between channel spend efficiencies, and impressions, clicks, and CPC which
ultimately lead to greater conversions.
Modeling Setup Parameters
Constraint Criteria - Evolutionary Model - Baseline Optimization Test 1
Target Beta (Max Assumed CPC Risk) $3.63
Average CPC used as the assumed dynamic Beta (b) risk variable coefficient.
(Find an optimum solution with an average CPC at or below $0.62.)
Max Budget Share 0.25
Maximum spend allocation for a single dynamic variable (%)
(Maximum spend per channel placement.)
Min Target Pools Inclusion 16
Minimum inclusion of dynamic variables in model calculation.
(Channel placements.)
Target Pool Inclusion Count 16
Total count of all dynamic variables in model calculation.
(Channel placements.)
Budget Spend $5,694,516
Total budget to be applied in model calculation.
(Benchmark budget spend to represent potential gains in model prediction.)
Constant Model Variables CTR, CPM, CPA, CVR
Data Model Outcome on following page.
Seresto | Sample Predictive Modeling (Media Spend Optimization)
3 | P a g e M e a s u r e m e n t & A n a l y t i c s | D a t a B a c k b o n e T e a m
-------------------------------------------
Brand: Seresto | Data Model | Predicted Outcome
Media Objective: AWARENESS | Based on Defined Constraint Criteria
Channel Platform Media Cost $$ Share Impressions Clicks CPC Conversions
Digital Audio Spotify $5.73 0.00000 583 0 $40.15 0
Digital Video Amobee $1.68 0.00000 42 0 $4,792.99 0
Digital Video Spotify $30.89 0.00001 536 3 $9.80 1
Digital Video Reddit $5.05 0.00000 1,169 1 $5.42 0
Digital Video DV360 $1,423,625.06 0.25000 194,999,916 287,877 $4.95 135,774
Digital Video ABC $2.97 0.00000 0 0 $0.00 0
Digital Video CBS Local $53.01 0.00001 0 0 $0.00 0
Digital Video
NBC
Broadband
$10.62 0.00000 0 0 $0.00 0
Digital Video Hulu $2.54 0.00000 89 0 $0.00 0
Digital Video
Pandora
Streaming
$1.00 0.00000 10 0 $0.00 0
Digital Social Facebook $7.76 0.00000 2,989 4 $1.96 0
Digital Display
Pandora
Streaming
$974.25 0.00017 61,120 100 $9.70 67
Digital Display Spotify $1,408.32 0.00025 97,946 198 $7.10 94
Digital Display WebMD $1,423,627.23 0.25000 89,851,200 214,184 $6.65 189,838
Digital Display Reddit $1,421,111.50 0.24956 322,647,358 555,057 $2.56 130,355
Digital Display DV360 $1,423,628.95 0.25000 984,665,008 1,748,429 $0.81 1,345,164
Model Prediction Core KPIs $5,694,496.54 1.00000 1,592,327,966 2,805,855 $2.03 1,801,293
YTD Comparative Baseline $5,694,515.94 1.00000 1,027,718,204 1,570,773 $3.63 1,058,139
Model Prediction Gain | Loss constraint constraint 55% 79% -44% 70%
This PREDICTIVE Model LEVERAGING BASELINE MEASURED PERFORMANCE DATA demonstrates significant
performance gains could be realized for each BRAND OBJECTIVE simply by adjusting media placement spends when
aligned to optimizing for conversion. (A final results table after demonstration results showcases final potential
impact.)
Without any other media buy consideration, Impressions, Clicks, CPC and Conversions all improve by optimizing
channels and platforms for Conversion to eliminate inefficiencies in media spend.
The Model's design is flexible and capable for adjusting to specified conditional media execution criteria.
Seresto | Sample Predictive Modeling (Media Spend Optimization)
4 | P a g e M e a s u r e m e n t & A n a l y t i c s | D a t a B a c k b o n e T e a m
-------------------------------------------
Brand: Seresto | BASELINE OPTIMIZATION TEST 2 Demonstration
Media Objective: ACQUISITION
Data Model Technique: Evolutionary Algorithm
Goal: Analyze media performance by CHANNEL placement spend based on 2021 YTD benchmarks without changing spend
and/or channel inclusion parameters to compare legacy performance against the model's predicted outcome.
Objective: Optimize for Conversion by Channel Spend for the Brand ACQUISITION Objective.
What would spend look like by Channel and Platform if we optimized for conversion without changing total media
budget allocation while maintaining all channels and platforms in the media mix.
Model Assumption: A correlation exists between channel spend efficiencies, and impressions, clicks, and CPC which
ultimately lead to greater conversions.
Modeling Setup Parameters
Constraint Criteria - Evolutionary Model - Baseline Optimization Test 1
Target Beta (Max Assumed CPC Risk) $3.92
Average CPC used as the assumed dynamic Beta (b) risk variable coefficient.
(Find an optimum solution with an average CPC at or below $0.62.)
Max Budget Share 0.625
Maximum spend allocation for a single dynamic variable (%)
(Maximum spend per channel placement.)
Min Target Pools Inclusion 5
Minimum inclusion of dynamic variables in model calculation.
(Channel placements.)
Target Pool Inclusion Count 5
Total count of all dynamic variables in model calculation.
(Channel placements.)
Budget Spend $2,853,038
Total budget to be applied in model calculation.
(Benchmark budget spend to represent potential gains in model prediction.)
Constant Model Variables CTR, CPM, CPA, CVR
Data Model | Predicted Outcome Based on Defined Constraint Criteria | Spend Allocation Optimization Test 2
Channel Platform Media Cost $$ Share Impressions Clicks CPC Conversions
Retailer Websites Amazon $1,072,172.66 0.37580 27,074,942 229,756 $4.67 72,700
N/A Amazon $15,701.99 0.00550 576,214 5,053 $3.11 1,626
Digital Search Google Ads $851,323.03 0.29839 2,530,667 252,822 $3.37 770,911
Digital Search Bing Ads $898,166.79 0.31481 5,236,841 274,462 $3.27 1,027,517
Digital Social Facebook $15,673.54 0.00549 518,480 5,972 $2.62 976
Model Prediction Core KPIs $2,853,038.02 1.00000 35,937,143 768,065 $3.71 1,873,729
YTD Comparative Baseline $2,853,038.02 1.00000 62,303,476 726,904 $3.92 725,649
Model Prediction Gain | Loss 0% 0% -42% 6% -5% 158%
Seresto | Sample Predictive Modeling (Media Spend Optimization)
5 | P a g e M e a s u r e m e n t & A n a l y t i c s | D a t a B a c k b o n e T e a m
-------------------------------------------
Brand: Seresto | BASELINE OPTIMIZATION TEST 3 Demonstration
Media Objective: CONSIDERATION
Data Model Technique: Evolutionary Algorithm
Goal: Analyze media performance by CHANNEL placement spend based on 2021 YTD benchmarks without changing spend
and/or channel inclusion parameters to compare legacy performance against the model's predicted outcome.
Objective: Optimize for Conversion by Channel Spend for the Brand CONSIDERATION Objective.
What would spend look like by Channel and Platform if we optimized for conversion without changing total media
budget allocation while maintaining all channels and platforms in the media mix.
Model Assumption: A correlation exists between channel spend efficiencies, and impressions, clicks, and CPC which
ultimately lead to greater conversions.
Modeling Setup Parameters
Constraint Criteria - Evolutionary Model - Baseline Optimization Test 1
Target Beta (Max Assumed CPC Risk) $3.09
Average CPC used as the assumed dynamic Beta (b) risk variable coefficient.
(Find an optimum solution with an average CPC at or below $0.62.)
Max Budget Share 0.40
Maximum spend allocation for a single dynamic variable (%)
(Maximum spend per channel placement.)
Min Target Pools Inclusion 6
Minimum inclusion of dynamic variables in model calculation.
(Channel placements.)
Target Pool Inclusion Count 6
Total count of all dynamic variables in model calculation.
(Channel placements.)
Budget Spend $850,596
Total budget to be applied in model calculation.
(Benchmark budget spend to represent potential gains in model prediction.)
Constant Model Variables CTR, CPM, CPA, CVR
Data Model | Predicted Outcome Based on Defined Constraint Criteria | Spend Allocation Optimization Test 2
Channel Platform Media Cost $$ Share Impressions Clicks CPC Conversions
Retailer Websites Amazon $34,241.85 0.04026 1,660,987 5,120 $6.69 988
N/A Amazon $36,703.41 0.04315 857,483 3,506 $10.47 578
Digital Search Google Ads $340,238.59 0.40000 986,237 72,555 $4.69 106,873
Digital Search Bing Ads $340,238.59 0.40000 5,744,765 154,513 $2.20 410,244
Digital Social Pinterest $0.30 0.00000 51 0 $1.71 0
Digital Social Facebook $100,151.75 0.11774 5,073,596 72,560 $1.38 1,424
Model Prediction Core KPIs $851,574.49 1.00115 14,323,119 308,255 $2.76 520,107
YTD Comparative Baseline $850,596.47 1.00000 43,587,069 275,209 $3.09 75,494
Model Prediction Gain | Loss 0% 0% -67% 12% -11% 589%
Seresto | Sample Predictive Modeling (Media Spend Optimization)
$$ Share: decimal rounding digit representation
6 | P a g e M e a s u r e m e n t & A n a l y t i c s | D a t a B a c k b o n e T e a m
-------------------------------------------
Brand: Seresto | BASELINE OPTIMIZATION TEST 4 Demonstration
Media Objective: REVENUE/SALES
Data Model Technique: Evolutionary Algorithm
Goal: Analyze media performance by CHANNEL placement spend based on 2021 YTD benchmarks without changing spend
and/or channel inclusion parameters to compare legacy performance against the model's predicted outcome.
Objective: Optimize for Conversion by Channel Spend for the Brand REVENUE/SALES Objective.
What would spend look like by Channel and Platform if we optimized for conversion without changing total media
budget allocation while maintaining all channels and platforms in the media mix.
Model Assumption: A correlation exists between channel spend efficiencies, and impressions, clicks, and CPC which
ultimately lead to greater conversions.
Modeling Setup Parameters
Constraint Criteria - Evolutionary Model - Baseline Optimization Test 1
Target Beta (Max Assumed CPC Risk) $0.59
Average CPC used as the assumed dynamic Beta (b) risk variable coefficient.
(Find an optimum solution with an average CPC at or below $0.62.)
Max Budget Share 0.88
Maximum spend allocation for a single dynamic variable (%)
(Maximum spend per channel placement.)
Min Target Pools Inclusion 2
Minimum inclusion of dynamic variables in model calculation.
(Channel placements.)
Target Pool Inclusion Count 2
Total count of all dynamic variables in model calculation.
(Channel placements.)
Budget Spend $2,556,242
Total budget to be applied in model calculation.
(Benchmark budget spend to represent potential gains in model prediction.)
Constant Model Variables CTR, CPM, CPA, CVR
Data Model | Predicted Outcome Based on Defined Constraint Criteria | Spend Allocation Optimization Test 2
Channel Platform Media Cost $$ Share Impressions Clicks CPC Conversions
Digital Display Epsilon $311,830.33 0.12199 48,373,832 27,451 $11.36 20,019
Digital Display DV360 $2,249,493.32 0.88000 597,810,180 4,344,914 $0.52 579,857
Model Prediction Core KPIs $2,561,323.65 1.00199 646,184,012 4,372,365 $0.59 599,876
YTD Comparative Baseline $2,556,242.41 1.00000 645,018,488 4,365,631 $0.59 598,890
Model Prediction Gain | Loss 0% 0% 0.2% 0.2% 0% 0.2%
Of note: model found no significant gains based on current channel/platform selection indicating spend is already
aligned for best optimization outcomes for the Revenue/Sales objective.
Seresto | Sample Predictive Modeling (Media Spend Optimization)
$$ Share: decimal rounding digit representation
7 | P a g e M e a s u r e m e n t & A n a l y t i c s | D a t a B a c k b o n e T e a m
-------------------------------------------
Brand: Seresto
BASELINE OPTIMIZATION TEST ROLLUP COMPARATIVE RESULTS
Media Objectives: AWARENESS, ACQUISITION, CONSIDERATION, REVENUE/SALES
Data Model Technique: Evolutionary Algorithm
Predictive Modeling Impact
When we model each campaign objective separately, we can begin to find deeper inefficiencies in media spend. The model
demonstration reveals significant performance gains can be reasonably realized simply by optimizing to benchmarked
platform performance.
Of note, the benchmarking period used within this demonstration was longer than would be recommended, but was used
to demonstrate the potential of performance gains using a sizeable budget allocation. Typically, it would be advised
optimization and modeling occur no frequent than in 90-day cycles. This allows for media to perform to the best possible
outcomes leveraging platform AI algorithms. Optimizing too frequent in shorter time cycles can have a reverse intended
effect with poorer performance as the platforms are continuously attempting to re-optimize based on changing spends
aligned with selected objectives and performance metrics.
The real power behind this demonstration is that we can show the baseline "what if" scenario if we didn't change media
buy parameters. Larger gains, much larger gains, could potentially be realized if we were to purely optimize to the best
performing channels and platforms.
And, for consideration, we did not apply audience targeting to the model or any other performance dimension such as
creative, format, messaging, CTA et al - all of which could potentially allow us to optimize deeper for each objective,
channel and platform.
As the data transformation effort begins to be adopted, data analysis and performance optimization does
become a highly strategic and valued direction for greater marketing performance and business ROI.
Modeled Objective Media Cost Impressions Clicks CPC Conversions
Awareness Model $5,694,496.54 1,592,327,966 2,805,855 $2.03 1,801,293
YTD Awareness Baseline $5,694,515.94 1,027,718,204 1,570,773 $3.63 1,058,139
Acquisition Model $2,853,038.02 35,937,143 768,065 $3.71 1,873,729
YTD Acquisition Baseline $2,853,038.02 62,303,476 726,904 $3.92 725,649
Consideration Model $851,574.49 14,323,119 308,255 $2.76 520,107
YTD Consideration Baseline $850,596.47 43,587,069 275,209 $3.09 75,494
Revenue/Sales Model $2,561,323.65 646,184,012 4,372,365 $0.59 599,876
YTD Revenue/Sales Baseline $2,556,242.41 645,018,488 4,365,631 $0.59 598,890
Model Objective Totals $851,574.49 2,288,772,240 8,254,540 $0.10 4,795,005
YTD Comparative Baseline Totals $850,596.47 1,778,627,237 6,938,517 $0.12 2,458,172
Optimization Impact 0% 29% 19% -16% 95%
Seresto | Sample Predictive Modeling (Media Optimization Impact)
8 | P a g e M e a s u r e m e n t & A n a l y t i c s | D a t a B a c k b o n e T e a m
-------------------------------------------
CHANNEL | PLATFORM | OBJECTIVE | AUDIENCE | CAMPAIGN NAME | MEDIA BUY SIZE | CREATIVE FORMAT | PRIMARY KPI
Data Modeling Impact
We can use data modeling in an assortment of ways across digital marketing. For paid media, if we have the data points
linking attribution dimensions to metric performance, we can likely build a model to optimize future spends.
In the examples just demonstrated, significant performance gains were predicted for all leading KPIs. In the case of
allowing the model to optimize spend by Objective and Platform, we have demonstrated double digit gains for impressions
and clicks, reduced CPC by as much as 16 percent, and improved conversion gains by as much as 96%.
The data used which was linked and cross-tabbed into a separate dataset for exploration as shown on the following page.
Upon request, we can explore the data using data modeling to demonstrate to interested key stakeholders how we can
predict "best buy" scenarios for future media spends.
Deeper multi-dimensional ACTIONABLE analyses based on a 90-day benchmarks which can be explored include:
� channel (as demonstrated),
� channel + platform,
� channel + platform + objective (as demonstrated),
� channel + platform + objective + audience, or
� any combination of dimensions which can be linked to data metrics.
As more expansive data becomes available and ingested into the dashboard environment including rebates and revenues,
the same process could be applied to gather additional business insights and intelligence for maximizing marketing ROI and
steering 2022 strategic business and marketing directions.
With adoption, Data Modeling Best practices include:
1. Clearly define and understand the desired optimization objective.
2. Identify the dimensions and metrics that are directly correlated to the objective's performance.
3. Define a baseline benchmark period to measure and compare predicted results (most recent 90 days optimal).
4. Collect the required data and groom as needed into a workable dataset.
5. Build, test and validate the data model.
6. Define the model's constraint criteria (applicable considerations, limitations, restrictions).
7. Develop a list of the "what if" scenarios based on the constraint criteria.
8. Run and log the "what if" scenario results to find the best possible outcome.
9. Implement the parameters defined for the best chosen optimization outcome.
10. Allow the applied changes sufficient time to re-adjust and optimize by platform and where applicable for AI
algorithms.
11. Continue to measure ongoing performance.
12. Measure, adjust and/or re-optimize periodically per scheduled timelines.
Final Notes | Predictive Modeling (Media Optimization)
9 | P a g e M e a s u r e m e n t & A n a l y t i c s | D a t a B a c k b o n e T e a m
-------------------------------------------
2021 YTD Multi-Dimensional Baseline Paid Media Performance x Channel, Objective, Platform
Brand Media Cost Impressions Clicks CTR CPC CPM CPA Conversions CVR
Galliprant Baseline $6,466,681.92 2,102,527,024 10,553,494 0.50% $0.61 $3.08 $6.25 1,034,899 9.81%
Digital Audio $201,776.20 18,699,108 96,690 0.52% $2.09 $10.79 $5.42 37,197 38.47%
Awareness $201,776.20 18,699,108 96,690 0.52% $2.09 $10.79 $5.42 37,197 38.47%
Pandora Stream $125,302.61 12,219,029 94,727 0.78% $1.32 $10.25 $3.38 37,074 39.14%
Spotify $76,473.59 6,480,079 1,963 0.03% $38.96 $11.80 $621.74 123 6.27%
Digital Display $1,261,827.30 1,359,828,708 1,067,852 0.08% $1.18 $0.93 $1.67 757,780 70.96%
Awareness $1,261,827.30 1,359,828,708 1,067,852 0.08% $1.18 $0.93 $1.67 757,780 70.96%
DV360 $1,147,274.66 1,338,535,865 992,910 0.07% $1.16 $0.86 $1.55 740,516 74.58%
Spotify $114,552.64 9,112,188 57,410 0.63% $2.00 $12.57 $8.00 14,316 24.94%
Kargo $0.00 1,974,467 552 0.03% $0.00 $0.00 $0.00 756 136.96%
PadSquad $0.00 1,851,648 5,640 0.30% $0.00 $0.00 $0.00 322 5.71%
Reddit $0.00 8,354,540 11,340 0.14% $0.00 $0.00 $0.00 1,870 16.49%
Digital Search $550,312.91 2,016,101 91,405 4.53% $6.02 $272.96 $8.98 61,293 67.06%
Acquisition $274,609.07 1,328,249 56,027 4.22% $4.90 $206.75 $11.42 24,054 42.93%
Google Ads $220,192.06 828,768 31,531 3.80% $6.98 $265.69 $9.20 23,937 75.92%
Bing Ads $54,417.01 499,481 24,496 4.90% $2.22 $108.95 $465.10 117 0.48%
Consideration $275,703.84 687,852 35,378 5.14% $7.79 $400.82 $7.40 37,239 105.26%
Google Ads $269,723.33 632,913 33,801 5.34% $7.98 $426.16 $7.25 37,201 110.06%
Bing Ads $5,980.51 54,939 1,577 2.87% $3.79 $108.86 $157.38 38 2.41%
Digital Social $1,538,367.55 349,654,194 8,441,948 2.41% $0.18 $4.40 $656.86 2,342 0.03%
Awareness $754,419.89 265,848,211 788,532 0.30% $0.96 $2.84 $1,022.25 738 0.09%
Facebook $467,501.70 140,810,782 225,065 0.16% $2.08 $3.32 $834.82 560 0.25%
Instagram $286,918.19 125,037,429 563,467 0.45% $0.51 $2.29 $1,611.90 178 0.03%
Consideration $783,947.66 83,805,983 7,653,416 9.13% $0.10 $9.35 $488.75 1,604 0.02%
Facebook $62,795.65 2,463,208 68,625 2.79% $0.92 $25.49 $119.16 527 0.77%
Instagram $721,152.01 81,342,775 7,584,791 9.32% $0.10 $8.87 $669.59 1,077 0.01%
Digital Video $2,914,397.96 372,328,913 855,599 0.23% $3.41 $7.83 $16.53 176,287 20.60%
Awareness $2,914,397.96 372,328,913 855,599 0.23% $3.41 $7.83 $16.53 176,287 20.60%
Hulu $460,383.98 17,208,111 2 0.00% $230,191.99 $26.75 $46,038.40 10 500.00%
Amobee $1,198,827.04 45,855,741 1,019 0.00% $1,176.47 $26.14 $4,610.87 260 25.52%
DV360 $1,255,186.94 301,520,325 835,013 0.28% $1.50 $4.16 $7.22 173,965 20.83%
Reddit $0.00 7,744,736 19,565 0.25% $0.00 $0.00 $0.00 2,052 10.49%
Channel Benchmarks $6,466,681.92 2,102,527,024 10,553,494 0.5019% $0.61 $3.08 $6.25 1,034,899 9.81%
Objective Benchmarks $6,466,681.92 2,102,527,024 10,553,494 0.5019% $0.61 $3.08 $0.00 1,034,899 9.81%
Sample Dataset for Data Modeling (Media Optimization)

More Related Content

Similar to Predictive Data Model

Microsoft Advertising Growth Solutions Bootcamp - Afternoon Session
Microsoft Advertising Growth Solutions Bootcamp - Afternoon SessionMicrosoft Advertising Growth Solutions Bootcamp - Afternoon Session
Microsoft Advertising Growth Solutions Bootcamp - Afternoon SessionMSFTAdvertising
 
Lucie Sperkova - Pioneering multi-channel attribution for the lack of compreh...
Lucie Sperkova - Pioneering multi-channel attribution for the lack of compreh...Lucie Sperkova - Pioneering multi-channel attribution for the lack of compreh...
Lucie Sperkova - Pioneering multi-channel attribution for the lack of compreh...Marketing Festival
 
The guide to A/B testing
The guide to A/B testingThe guide to A/B testing
The guide to A/B testingSarah Dentes
 
Presentación de Peter Minnium en IAB Conecta 2013
Presentación de Peter Minnium en IAB Conecta 2013Presentación de Peter Minnium en IAB Conecta 2013
Presentación de Peter Minnium en IAB Conecta 2013IAB México
 
Good, Better, Best: Three Ways to Calculate the ROI of CX Initiatives
Good, Better, Best: Three Ways to Calculate the ROI of CX InitiativesGood, Better, Best: Three Ways to Calculate the ROI of CX Initiatives
Good, Better, Best: Three Ways to Calculate the ROI of CX InitiativesErin Washington
 
Optimal Search Engine Marketing
Optimal Search Engine MarketingOptimal Search Engine Marketing
Optimal Search Engine MarketingBernd Skiera
 
Criteo | Retargeting | BTO 2016 | Daniele Beccari
Criteo | Retargeting | BTO 2016 | Daniele BeccariCriteo | Retargeting | BTO 2016 | Daniele Beccari
Criteo | Retargeting | BTO 2016 | Daniele BeccariBTO Educational
 
Data science in online marketing briefly
Data science in online marketing brieflyData science in online marketing briefly
Data science in online marketing brieflyMarkus Ojala
 
Marketing Mix Models In a Changing Environment
Marketing Mix Models In a Changing EnvironmentMarketing Mix Models In a Changing Environment
Marketing Mix Models In a Changing EnvironmentAquent
 
Marketing effectiveness analytics & ROI measurement for Auto Services Retailing
Marketing effectiveness analytics & ROI measurement for Auto Services RetailingMarketing effectiveness analytics & ROI measurement for Auto Services Retailing
Marketing effectiveness analytics & ROI measurement for Auto Services RetailingMichael Wolfe
 
Choosing the Right Trading Desk for Your Display Programmatic Buying
Choosing the Right Trading Desk for Your Display Programmatic BuyingChoosing the Right Trading Desk for Your Display Programmatic Buying
Choosing the Right Trading Desk for Your Display Programmatic BuyingAcquisio
 
State Of Display 5 12
State Of Display 5 12State Of Display 5 12
State Of Display 5 12DM2EVENTS
 
Getting Started with Car Dealer Digital Advertising by Ralph Paglia
Getting Started with Car Dealer Digital Advertising by Ralph PagliaGetting Started with Car Dealer Digital Advertising by Ralph Paglia
Getting Started with Car Dealer Digital Advertising by Ralph PagliaRalph Paglia
 

Similar to Predictive Data Model (20)

STIMA Congress 2015: Stuart Wilkinson - Comscore
STIMA Congress 2015: Stuart Wilkinson - ComscoreSTIMA Congress 2015: Stuart Wilkinson - Comscore
STIMA Congress 2015: Stuart Wilkinson - Comscore
 
Microsoft Advertising Growth Solutions Bootcamp - Afternoon Session
Microsoft Advertising Growth Solutions Bootcamp - Afternoon SessionMicrosoft Advertising Growth Solutions Bootcamp - Afternoon Session
Microsoft Advertising Growth Solutions Bootcamp - Afternoon Session
 
Lucie Sperkova - Pioneering multi-channel attribution for the lack of compreh...
Lucie Sperkova - Pioneering multi-channel attribution for the lack of compreh...Lucie Sperkova - Pioneering multi-channel attribution for the lack of compreh...
Lucie Sperkova - Pioneering multi-channel attribution for the lack of compreh...
 
Bionic Demonstration
Bionic DemonstrationBionic Demonstration
Bionic Demonstration
 
The guide to A/B testing
The guide to A/B testingThe guide to A/B testing
The guide to A/B testing
 
Digital Performance Master Class - Aida Sahraoui, WONE Digital Agency
Digital Performance Master Class - Aida Sahraoui, WONE Digital AgencyDigital Performance Master Class - Aida Sahraoui, WONE Digital Agency
Digital Performance Master Class - Aida Sahraoui, WONE Digital Agency
 
Presentación de Peter Minnium en IAB Conecta 2013
Presentación de Peter Minnium en IAB Conecta 2013Presentación de Peter Minnium en IAB Conecta 2013
Presentación de Peter Minnium en IAB Conecta 2013
 
Good, Better, Best: Three Ways to Calculate the ROI of CX Initiatives
Good, Better, Best: Three Ways to Calculate the ROI of CX InitiativesGood, Better, Best: Three Ways to Calculate the ROI of CX Initiatives
Good, Better, Best: Three Ways to Calculate the ROI of CX Initiatives
 
Adaptive Forecasting: Building a Case for the Right Digital Budget
Adaptive Forecasting: Building a Case for the Right Digital BudgetAdaptive Forecasting: Building a Case for the Right Digital Budget
Adaptive Forecasting: Building a Case for the Right Digital Budget
 
Optimal Search Engine Marketing
Optimal Search Engine MarketingOptimal Search Engine Marketing
Optimal Search Engine Marketing
 
Criteo | Retargeting | BTO 2016 | Daniele Beccari
Criteo | Retargeting | BTO 2016 | Daniele BeccariCriteo | Retargeting | BTO 2016 | Daniele Beccari
Criteo | Retargeting | BTO 2016 | Daniele Beccari
 
Data science in online marketing briefly
Data science in online marketing brieflyData science in online marketing briefly
Data science in online marketing briefly
 
ROI of Machine Learning In IoT
ROI of Machine Learning In IoTROI of Machine Learning In IoT
ROI of Machine Learning In IoT
 
Marketing Mix Models In a Changing Environment
Marketing Mix Models In a Changing EnvironmentMarketing Mix Models In a Changing Environment
Marketing Mix Models In a Changing Environment
 
Marketing effectiveness analytics & ROI measurement for Auto Services Retailing
Marketing effectiveness analytics & ROI measurement for Auto Services RetailingMarketing effectiveness analytics & ROI measurement for Auto Services Retailing
Marketing effectiveness analytics & ROI measurement for Auto Services Retailing
 
Choosing the Right Trading Desk for Your Display Programmatic Buying
Choosing the Right Trading Desk for Your Display Programmatic BuyingChoosing the Right Trading Desk for Your Display Programmatic Buying
Choosing the Right Trading Desk for Your Display Programmatic Buying
 
State Of Display 5 12
State Of Display 5 12State Of Display 5 12
State Of Display 5 12
 
Post Campaign En
Post Campaign EnPost Campaign En
Post Campaign En
 
Getting Started with Car Dealer Digital Advertising by Ralph Paglia
Getting Started with Car Dealer Digital Advertising by Ralph PagliaGetting Started with Car Dealer Digital Advertising by Ralph Paglia
Getting Started with Car Dealer Digital Advertising by Ralph Paglia
 
Jonathan beeston
Jonathan beestonJonathan beeston
Jonathan beeston
 

More from Daniel McKean

Data Framework Design: A Practical Guide
Data Framework Design: A Practical GuideData Framework Design: A Practical Guide
Data Framework Design: A Practical GuideDaniel McKean
 
MASTERING DIGITAL TRANSFORMATION IN THE NEW BUSINESS ERA
MASTERING DIGITAL TRANSFORMATION IN THE NEW BUSINESS ERAMASTERING DIGITAL TRANSFORMATION IN THE NEW BUSINESS ERA
MASTERING DIGITAL TRANSFORMATION IN THE NEW BUSINESS ERADaniel McKean
 
Go-To Market Strategy Framework
Go-To Market Strategy FrameworkGo-To Market Strategy Framework
Go-To Market Strategy FrameworkDaniel McKean
 
Harnessing the Power of Predictive Models for Marketing Campaign Optimization...
Harnessing the Power of Predictive Models for Marketing Campaign Optimization...Harnessing the Power of Predictive Models for Marketing Campaign Optimization...
Harnessing the Power of Predictive Models for Marketing Campaign Optimization...Daniel McKean
 
Unlocking Growth: Full-Funnel Marketing
Unlocking Growth: Full-Funnel MarketingUnlocking Growth: Full-Funnel Marketing
Unlocking Growth: Full-Funnel MarketingDaniel McKean
 
Maximizing Business ROI
Maximizing Business ROIMaximizing Business ROI
Maximizing Business ROIDaniel McKean
 
Attribution Analysis
Attribution AnalysisAttribution Analysis
Attribution AnalysisDaniel McKean
 
Media Campaign Reporting
Media Campaign ReportingMedia Campaign Reporting
Media Campaign ReportingDaniel McKean
 
Website Journey Flow Analysis
Website Journey Flow AnalysisWebsite Journey Flow Analysis
Website Journey Flow AnalysisDaniel McKean
 
Community Activation
Community ActivationCommunity Activation
Community ActivationDaniel McKean
 
Value-Added Services
Value-Added ServicesValue-Added Services
Value-Added ServicesDaniel McKean
 
Topic + Influencer Research
Topic + Influencer ResearchTopic + Influencer Research
Topic + Influencer ResearchDaniel McKean
 
Performance Metrics Reporting
Performance Metrics ReportingPerformance Metrics Reporting
Performance Metrics ReportingDaniel McKean
 
Target Audience Research
Target Audience ResearchTarget Audience Research
Target Audience ResearchDaniel McKean
 
Content Marketing Plan
Content Marketing PlanContent Marketing Plan
Content Marketing PlanDaniel McKean
 
Audit Scope and Process
Audit Scope and ProcessAudit Scope and Process
Audit Scope and ProcessDaniel McKean
 
Social Monthly Reporting
Social Monthly Reporting Social Monthly Reporting
Social Monthly Reporting Daniel McKean
 

More from Daniel McKean (20)

Data Framework Design: A Practical Guide
Data Framework Design: A Practical GuideData Framework Design: A Practical Guide
Data Framework Design: A Practical Guide
 
MASTERING DIGITAL TRANSFORMATION IN THE NEW BUSINESS ERA
MASTERING DIGITAL TRANSFORMATION IN THE NEW BUSINESS ERAMASTERING DIGITAL TRANSFORMATION IN THE NEW BUSINESS ERA
MASTERING DIGITAL TRANSFORMATION IN THE NEW BUSINESS ERA
 
Go-To Market Strategy Framework
Go-To Market Strategy FrameworkGo-To Market Strategy Framework
Go-To Market Strategy Framework
 
Harnessing the Power of Predictive Models for Marketing Campaign Optimization...
Harnessing the Power of Predictive Models for Marketing Campaign Optimization...Harnessing the Power of Predictive Models for Marketing Campaign Optimization...
Harnessing the Power of Predictive Models for Marketing Campaign Optimization...
 
Unlocking Growth: Full-Funnel Marketing
Unlocking Growth: Full-Funnel MarketingUnlocking Growth: Full-Funnel Marketing
Unlocking Growth: Full-Funnel Marketing
 
Maximizing Business ROI
Maximizing Business ROIMaximizing Business ROI
Maximizing Business ROI
 
Paid Media Analysis
Paid Media AnalysisPaid Media Analysis
Paid Media Analysis
 
Attribution Analysis
Attribution AnalysisAttribution Analysis
Attribution Analysis
 
Media Campaign Reporting
Media Campaign ReportingMedia Campaign Reporting
Media Campaign Reporting
 
Website Journey Flow Analysis
Website Journey Flow AnalysisWebsite Journey Flow Analysis
Website Journey Flow Analysis
 
Brand Intel Audit
Brand Intel AuditBrand Intel Audit
Brand Intel Audit
 
Community Activation
Community ActivationCommunity Activation
Community Activation
 
Value-Added Services
Value-Added ServicesValue-Added Services
Value-Added Services
 
Business ROI Impact
Business ROI ImpactBusiness ROI Impact
Business ROI Impact
 
Topic + Influencer Research
Topic + Influencer ResearchTopic + Influencer Research
Topic + Influencer Research
 
Performance Metrics Reporting
Performance Metrics ReportingPerformance Metrics Reporting
Performance Metrics Reporting
 
Target Audience Research
Target Audience ResearchTarget Audience Research
Target Audience Research
 
Content Marketing Plan
Content Marketing PlanContent Marketing Plan
Content Marketing Plan
 
Audit Scope and Process
Audit Scope and ProcessAudit Scope and Process
Audit Scope and Process
 
Social Monthly Reporting
Social Monthly Reporting Social Monthly Reporting
Social Monthly Reporting
 

Recently uploaded

DGR_Digital Advertising Strategies for a Cookieless World_Presentation.pdf
DGR_Digital Advertising Strategies for a Cookieless World_Presentation.pdfDGR_Digital Advertising Strategies for a Cookieless World_Presentation.pdf
DGR_Digital Advertising Strategies for a Cookieless World_Presentation.pdfDemandbase
 
How To Utilize Calculated Properties in your HubSpot Setup
How To Utilize Calculated Properties in your HubSpot SetupHow To Utilize Calculated Properties in your HubSpot Setup
How To Utilize Calculated Properties in your HubSpot Setupssuser4571da
 
Uncover Insightful User Journey Secrets Using GA4 Reports
Uncover Insightful User Journey Secrets Using GA4 ReportsUncover Insightful User Journey Secrets Using GA4 Reports
Uncover Insightful User Journey Secrets Using GA4 ReportsVWO
 
VIP 7001035870 Find & Meet Hyderabad Call Girls Film Nagar high-profile Call ...
VIP 7001035870 Find & Meet Hyderabad Call Girls Film Nagar high-profile Call ...VIP 7001035870 Find & Meet Hyderabad Call Girls Film Nagar high-profile Call ...
VIP 7001035870 Find & Meet Hyderabad Call Girls Film Nagar high-profile Call ...aditipandeya
 
Local SEO Domination: Put your business at the forefront of local searches!
Local SEO Domination:  Put your business at the forefront of local searches!Local SEO Domination:  Put your business at the forefront of local searches!
Local SEO Domination: Put your business at the forefront of local searches!dstvtechnician
 
Avoid the 2025 web accessibility rush: do not fear WCAG compliance
Avoid the 2025 web accessibility rush: do not fear WCAG complianceAvoid the 2025 web accessibility rush: do not fear WCAG compliance
Avoid the 2025 web accessibility rush: do not fear WCAG complianceDamien ROBERT
 
VIP Call Girls In Green Park 9654467111 Escorts Service
VIP Call Girls In Green Park 9654467111 Escorts ServiceVIP Call Girls In Green Park 9654467111 Escorts Service
VIP Call Girls In Green Park 9654467111 Escorts ServiceSapana Sha
 
SORA AI: Will It Be the Future of Video Creation?
SORA AI: Will It Be the Future of Video Creation?SORA AI: Will It Be the Future of Video Creation?
SORA AI: Will It Be the Future of Video Creation?Searchable Design
 
The Pitfalls of Keyword Stuffing in SEO Copywriting
The Pitfalls of Keyword Stuffing in SEO CopywritingThe Pitfalls of Keyword Stuffing in SEO Copywriting
The Pitfalls of Keyword Stuffing in SEO CopywritingJuan Pineda
 
Forecast of Content Marketing through AI
Forecast of Content Marketing through AIForecast of Content Marketing through AI
Forecast of Content Marketing through AIRinky
 
GreenSEO April 2024: Join the Green Web Revolution
GreenSEO April 2024: Join the Green Web RevolutionGreenSEO April 2024: Join the Green Web Revolution
GreenSEO April 2024: Join the Green Web RevolutionWilliam Barnes
 
Call Us ➥9654467111▻Call Girls In Delhi NCR
Call Us ➥9654467111▻Call Girls In Delhi NCRCall Us ➥9654467111▻Call Girls In Delhi NCR
Call Us ➥9654467111▻Call Girls In Delhi NCRSapana Sha
 
Social Samosa Guidebook for SAMMIES 2024.pdf
Social Samosa Guidebook for SAMMIES 2024.pdfSocial Samosa Guidebook for SAMMIES 2024.pdf
Social Samosa Guidebook for SAMMIES 2024.pdfSocial Samosa
 
Netflix Ads The Game Changer in Video Ads – Who Needs YouTube.pptx (Chester Y...
Netflix Ads The Game Changer in Video Ads – Who Needs YouTube.pptx (Chester Y...Netflix Ads The Game Changer in Video Ads – Who Needs YouTube.pptx (Chester Y...
Netflix Ads The Game Changer in Video Ads – Who Needs YouTube.pptx (Chester Y...ChesterYang6
 
Best Persuasive selling skills presentation.pptx
Best Persuasive selling skills  presentation.pptxBest Persuasive selling skills  presentation.pptx
Best Persuasive selling skills presentation.pptxMasterPhil1
 
2024 SEO Trends for Business Success (WSA)
2024 SEO Trends for Business Success (WSA)2024 SEO Trends for Business Success (WSA)
2024 SEO Trends for Business Success (WSA)Jomer Gregorio
 

Recently uploaded (20)

Top 5 Breakthrough AI Innovations Elevating Content Creation and Personalizat...
Top 5 Breakthrough AI Innovations Elevating Content Creation and Personalizat...Top 5 Breakthrough AI Innovations Elevating Content Creation and Personalizat...
Top 5 Breakthrough AI Innovations Elevating Content Creation and Personalizat...
 
DGR_Digital Advertising Strategies for a Cookieless World_Presentation.pdf
DGR_Digital Advertising Strategies for a Cookieless World_Presentation.pdfDGR_Digital Advertising Strategies for a Cookieless World_Presentation.pdf
DGR_Digital Advertising Strategies for a Cookieless World_Presentation.pdf
 
How To Utilize Calculated Properties in your HubSpot Setup
How To Utilize Calculated Properties in your HubSpot SetupHow To Utilize Calculated Properties in your HubSpot Setup
How To Utilize Calculated Properties in your HubSpot Setup
 
Uncover Insightful User Journey Secrets Using GA4 Reports
Uncover Insightful User Journey Secrets Using GA4 ReportsUncover Insightful User Journey Secrets Using GA4 Reports
Uncover Insightful User Journey Secrets Using GA4 Reports
 
VIP 7001035870 Find & Meet Hyderabad Call Girls Film Nagar high-profile Call ...
VIP 7001035870 Find & Meet Hyderabad Call Girls Film Nagar high-profile Call ...VIP 7001035870 Find & Meet Hyderabad Call Girls Film Nagar high-profile Call ...
VIP 7001035870 Find & Meet Hyderabad Call Girls Film Nagar high-profile Call ...
 
Local SEO Domination: Put your business at the forefront of local searches!
Local SEO Domination:  Put your business at the forefront of local searches!Local SEO Domination:  Put your business at the forefront of local searches!
Local SEO Domination: Put your business at the forefront of local searches!
 
Avoid the 2025 web accessibility rush: do not fear WCAG compliance
Avoid the 2025 web accessibility rush: do not fear WCAG complianceAvoid the 2025 web accessibility rush: do not fear WCAG compliance
Avoid the 2025 web accessibility rush: do not fear WCAG compliance
 
VIP Call Girls In Green Park 9654467111 Escorts Service
VIP Call Girls In Green Park 9654467111 Escorts ServiceVIP Call Girls In Green Park 9654467111 Escorts Service
VIP Call Girls In Green Park 9654467111 Escorts Service
 
SORA AI: Will It Be the Future of Video Creation?
SORA AI: Will It Be the Future of Video Creation?SORA AI: Will It Be the Future of Video Creation?
SORA AI: Will It Be the Future of Video Creation?
 
The Pitfalls of Keyword Stuffing in SEO Copywriting
The Pitfalls of Keyword Stuffing in SEO CopywritingThe Pitfalls of Keyword Stuffing in SEO Copywriting
The Pitfalls of Keyword Stuffing in SEO Copywriting
 
BUY GMAIL ACCOUNTS PVA USA IP INDIAN IP GMAIL
BUY GMAIL ACCOUNTS PVA USA IP INDIAN IP GMAILBUY GMAIL ACCOUNTS PVA USA IP INDIAN IP GMAIL
BUY GMAIL ACCOUNTS PVA USA IP INDIAN IP GMAIL
 
Forecast of Content Marketing through AI
Forecast of Content Marketing through AIForecast of Content Marketing through AI
Forecast of Content Marketing through AI
 
GreenSEO April 2024: Join the Green Web Revolution
GreenSEO April 2024: Join the Green Web RevolutionGreenSEO April 2024: Join the Green Web Revolution
GreenSEO April 2024: Join the Green Web Revolution
 
Call Us ➥9654467111▻Call Girls In Delhi NCR
Call Us ➥9654467111▻Call Girls In Delhi NCRCall Us ➥9654467111▻Call Girls In Delhi NCR
Call Us ➥9654467111▻Call Girls In Delhi NCR
 
Social Samosa Guidebook for SAMMIES 2024.pdf
Social Samosa Guidebook for SAMMIES 2024.pdfSocial Samosa Guidebook for SAMMIES 2024.pdf
Social Samosa Guidebook for SAMMIES 2024.pdf
 
Brand Strategy Master Class - Juntae DeLane
Brand Strategy Master Class - Juntae DeLaneBrand Strategy Master Class - Juntae DeLane
Brand Strategy Master Class - Juntae DeLane
 
Netflix Ads The Game Changer in Video Ads – Who Needs YouTube.pptx (Chester Y...
Netflix Ads The Game Changer in Video Ads – Who Needs YouTube.pptx (Chester Y...Netflix Ads The Game Changer in Video Ads – Who Needs YouTube.pptx (Chester Y...
Netflix Ads The Game Changer in Video Ads – Who Needs YouTube.pptx (Chester Y...
 
How to Create a Social Media Plan Like a Pro - Jordan Scheltgen
How to Create a Social Media Plan Like a Pro - Jordan ScheltgenHow to Create a Social Media Plan Like a Pro - Jordan Scheltgen
How to Create a Social Media Plan Like a Pro - Jordan Scheltgen
 
Best Persuasive selling skills presentation.pptx
Best Persuasive selling skills  presentation.pptxBest Persuasive selling skills  presentation.pptx
Best Persuasive selling skills presentation.pptx
 
2024 SEO Trends for Business Success (WSA)
2024 SEO Trends for Business Success (WSA)2024 SEO Trends for Business Success (WSA)
2024 SEO Trends for Business Success (WSA)
 

Predictive Data Model

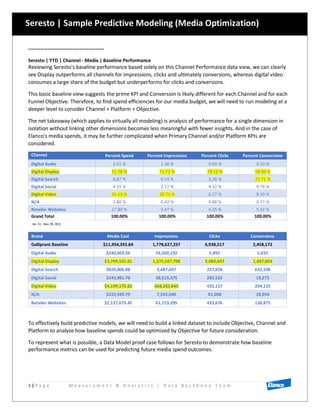
  • 1. 1 | P a g e M e a s u r e m e n t & A n a l y t i c s | D a t a B a c k b o n e T e a m ------------------------------------------- Seresto | YTD | Channel - Media | Baseline Performance Reviewing Seresto's baseline performance based solely on this Channel Performance data view, we can clearly see Display outperforms all channels for impressions, clicks and ultimately conversions, whereas digital video consumes a large share of the budget but underperforms for clicks and conversions. This basic baseline view suggests the prime KPI and Conversion is likely different for each Channel and for each Funnel Objective. Therefore, to find spend efficiencies for our media budget, we will need to run modeling at a deeper level to consider Channel + Platform + Objective. The net takeaway (which applies to virtually all modeling) is analysis of performance for a single dimension in isolation without linking other dimensions becomes less meaningful with fewer insights. And in the case of Elanco's media spends, it may be further complicated when Primary Channel and/or Platform KPIs are considered. Channel Percent Spend Percent Impressions Percent Clicks Percent Conversions Digital Audio 2.01 % 1.38 % 0.09 % 0.20 % Digital Display 31.78 % 71.72 % 79.12 % 58.90 % Digital Search 6.87 % 0.14 % 3.28 % 25.71 % Digital Social 4.55 % 2.17 % 4.12 % 0.78 % Digital Video 35.13 % 20.71 % 6.27 % 8.30 % N/A 1.86 % 0.42 % 0.88 % 0.77 % Retailer Websites 17.80 % 3.47 % 6.25 % 5.32 % Grand Total 100.00% 100.00% 100.00% 100.00% Brand Media Cost Impressions Clicks Conversions Galliprant Baseline $11,954,392.84 1,778,627,237 6,938,517 2,458,172 Digital Audio $240,603.50 24,500,192 5,992 5,033 Digital Display $3,799,591.61 1,275,567,798 5,489,447 1,447,804 Digital Search $820,806.88 2,487,697 227,654 632,106 Digital Social $543,991.78 38,519,375 285,523 19,275 Digital Video $4,199,175.83 368,283,840 435,157 204,125 N/A $222,549.79 7,545,040 61,068 18,954 Retailer Websites $2,127,673.45 61,723,295 433,676 130,875 To effectively build predictive models, we will need to build a linked dataset to include Objective, Channel and Platform to analyze how baseline spends could be optimized by Objective for future consideration. To represent what is possible, a Data Model proof case follows for Seresto to demonstrate how baseline performance metrics can be used for predicting future media spend outcomes. Seresto | Sample Predictive Modeling (Media Optimization) Jan. 01 - Nov. 09, 2021
  • 2. 2 | P a g e M e a s u r e m e n t & A n a l y t i c s | D a t a B a c k b o n e T e a m ------------------------------------------- Brand: Seresto | BASELINE OPTIMIZATION TEST 1 Demonstration Media Objective: AWARENESS Data Model Technique: Evolutionary Algorithm Goal: Analyze media performance by CHANNEL placement spend based on 2021 YTD benchmarks without changing spend and/or channel inclusion parameters to compare legacy performance against the model's predicted outcome. Objective: Optimize for Conversion by Channel Spend for the Brand AWARENESS Objective. What would spend look like by Channel and Platform if we optimized for conversion without changing total media budget allocation while maintaining all channels and platforms in the media mix. Model Assumption: A correlation exists between channel spend efficiencies, and impressions, clicks, and CPC which ultimately lead to greater conversions. Modeling Setup Parameters Constraint Criteria - Evolutionary Model - Baseline Optimization Test 1 Target Beta (Max Assumed CPC Risk) $3.63 Average CPC used as the assumed dynamic Beta (b) risk variable coefficient. (Find an optimum solution with an average CPC at or below $0.62.) Max Budget Share 0.25 Maximum spend allocation for a single dynamic variable (%) (Maximum spend per channel placement.) Min Target Pools Inclusion 16 Minimum inclusion of dynamic variables in model calculation. (Channel placements.) Target Pool Inclusion Count 16 Total count of all dynamic variables in model calculation. (Channel placements.) Budget Spend $5,694,516 Total budget to be applied in model calculation. (Benchmark budget spend to represent potential gains in model prediction.) Constant Model Variables CTR, CPM, CPA, CVR Data Model Outcome on following page. Seresto | Sample Predictive Modeling (Media Spend Optimization)
  • 3. 3 | P a g e M e a s u r e m e n t & A n a l y t i c s | D a t a B a c k b o n e T e a m ------------------------------------------- Brand: Seresto | Data Model | Predicted Outcome Media Objective: AWARENESS | Based on Defined Constraint Criteria Channel Platform Media Cost $$ Share Impressions Clicks CPC Conversions Digital Audio Spotify $5.73 0.00000 583 0 $40.15 0 Digital Video Amobee $1.68 0.00000 42 0 $4,792.99 0 Digital Video Spotify $30.89 0.00001 536 3 $9.80 1 Digital Video Reddit $5.05 0.00000 1,169 1 $5.42 0 Digital Video DV360 $1,423,625.06 0.25000 194,999,916 287,877 $4.95 135,774 Digital Video ABC $2.97 0.00000 0 0 $0.00 0 Digital Video CBS Local $53.01 0.00001 0 0 $0.00 0 Digital Video NBC Broadband $10.62 0.00000 0 0 $0.00 0 Digital Video Hulu $2.54 0.00000 89 0 $0.00 0 Digital Video Pandora Streaming $1.00 0.00000 10 0 $0.00 0 Digital Social Facebook $7.76 0.00000 2,989 4 $1.96 0 Digital Display Pandora Streaming $974.25 0.00017 61,120 100 $9.70 67 Digital Display Spotify $1,408.32 0.00025 97,946 198 $7.10 94 Digital Display WebMD $1,423,627.23 0.25000 89,851,200 214,184 $6.65 189,838 Digital Display Reddit $1,421,111.50 0.24956 322,647,358 555,057 $2.56 130,355 Digital Display DV360 $1,423,628.95 0.25000 984,665,008 1,748,429 $0.81 1,345,164 Model Prediction Core KPIs $5,694,496.54 1.00000 1,592,327,966 2,805,855 $2.03 1,801,293 YTD Comparative Baseline $5,694,515.94 1.00000 1,027,718,204 1,570,773 $3.63 1,058,139 Model Prediction Gain | Loss constraint constraint 55% 79% -44% 70% This PREDICTIVE Model LEVERAGING BASELINE MEASURED PERFORMANCE DATA demonstrates significant performance gains could be realized for each BRAND OBJECTIVE simply by adjusting media placement spends when aligned to optimizing for conversion. (A final results table after demonstration results showcases final potential impact.) Without any other media buy consideration, Impressions, Clicks, CPC and Conversions all improve by optimizing channels and platforms for Conversion to eliminate inefficiencies in media spend. The Model's design is flexible and capable for adjusting to specified conditional media execution criteria. Seresto | Sample Predictive Modeling (Media Spend Optimization)
  • 4. 4 | P a g e M e a s u r e m e n t & A n a l y t i c s | D a t a B a c k b o n e T e a m ------------------------------------------- Brand: Seresto | BASELINE OPTIMIZATION TEST 2 Demonstration Media Objective: ACQUISITION Data Model Technique: Evolutionary Algorithm Goal: Analyze media performance by CHANNEL placement spend based on 2021 YTD benchmarks without changing spend and/or channel inclusion parameters to compare legacy performance against the model's predicted outcome. Objective: Optimize for Conversion by Channel Spend for the Brand ACQUISITION Objective. What would spend look like by Channel and Platform if we optimized for conversion without changing total media budget allocation while maintaining all channels and platforms in the media mix. Model Assumption: A correlation exists between channel spend efficiencies, and impressions, clicks, and CPC which ultimately lead to greater conversions. Modeling Setup Parameters Constraint Criteria - Evolutionary Model - Baseline Optimization Test 1 Target Beta (Max Assumed CPC Risk) $3.92 Average CPC used as the assumed dynamic Beta (b) risk variable coefficient. (Find an optimum solution with an average CPC at or below $0.62.) Max Budget Share 0.625 Maximum spend allocation for a single dynamic variable (%) (Maximum spend per channel placement.) Min Target Pools Inclusion 5 Minimum inclusion of dynamic variables in model calculation. (Channel placements.) Target Pool Inclusion Count 5 Total count of all dynamic variables in model calculation. (Channel placements.) Budget Spend $2,853,038 Total budget to be applied in model calculation. (Benchmark budget spend to represent potential gains in model prediction.) Constant Model Variables CTR, CPM, CPA, CVR Data Model | Predicted Outcome Based on Defined Constraint Criteria | Spend Allocation Optimization Test 2 Channel Platform Media Cost $$ Share Impressions Clicks CPC Conversions Retailer Websites Amazon $1,072,172.66 0.37580 27,074,942 229,756 $4.67 72,700 N/A Amazon $15,701.99 0.00550 576,214 5,053 $3.11 1,626 Digital Search Google Ads $851,323.03 0.29839 2,530,667 252,822 $3.37 770,911 Digital Search Bing Ads $898,166.79 0.31481 5,236,841 274,462 $3.27 1,027,517 Digital Social Facebook $15,673.54 0.00549 518,480 5,972 $2.62 976 Model Prediction Core KPIs $2,853,038.02 1.00000 35,937,143 768,065 $3.71 1,873,729 YTD Comparative Baseline $2,853,038.02 1.00000 62,303,476 726,904 $3.92 725,649 Model Prediction Gain | Loss 0% 0% -42% 6% -5% 158% Seresto | Sample Predictive Modeling (Media Spend Optimization)
  • 5. 5 | P a g e M e a s u r e m e n t & A n a l y t i c s | D a t a B a c k b o n e T e a m ------------------------------------------- Brand: Seresto | BASELINE OPTIMIZATION TEST 3 Demonstration Media Objective: CONSIDERATION Data Model Technique: Evolutionary Algorithm Goal: Analyze media performance by CHANNEL placement spend based on 2021 YTD benchmarks without changing spend and/or channel inclusion parameters to compare legacy performance against the model's predicted outcome. Objective: Optimize for Conversion by Channel Spend for the Brand CONSIDERATION Objective. What would spend look like by Channel and Platform if we optimized for conversion without changing total media budget allocation while maintaining all channels and platforms in the media mix. Model Assumption: A correlation exists between channel spend efficiencies, and impressions, clicks, and CPC which ultimately lead to greater conversions. Modeling Setup Parameters Constraint Criteria - Evolutionary Model - Baseline Optimization Test 1 Target Beta (Max Assumed CPC Risk) $3.09 Average CPC used as the assumed dynamic Beta (b) risk variable coefficient. (Find an optimum solution with an average CPC at or below $0.62.) Max Budget Share 0.40 Maximum spend allocation for a single dynamic variable (%) (Maximum spend per channel placement.) Min Target Pools Inclusion 6 Minimum inclusion of dynamic variables in model calculation. (Channel placements.) Target Pool Inclusion Count 6 Total count of all dynamic variables in model calculation. (Channel placements.) Budget Spend $850,596 Total budget to be applied in model calculation. (Benchmark budget spend to represent potential gains in model prediction.) Constant Model Variables CTR, CPM, CPA, CVR Data Model | Predicted Outcome Based on Defined Constraint Criteria | Spend Allocation Optimization Test 2 Channel Platform Media Cost $$ Share Impressions Clicks CPC Conversions Retailer Websites Amazon $34,241.85 0.04026 1,660,987 5,120 $6.69 988 N/A Amazon $36,703.41 0.04315 857,483 3,506 $10.47 578 Digital Search Google Ads $340,238.59 0.40000 986,237 72,555 $4.69 106,873 Digital Search Bing Ads $340,238.59 0.40000 5,744,765 154,513 $2.20 410,244 Digital Social Pinterest $0.30 0.00000 51 0 $1.71 0 Digital Social Facebook $100,151.75 0.11774 5,073,596 72,560 $1.38 1,424 Model Prediction Core KPIs $851,574.49 1.00115 14,323,119 308,255 $2.76 520,107 YTD Comparative Baseline $850,596.47 1.00000 43,587,069 275,209 $3.09 75,494 Model Prediction Gain | Loss 0% 0% -67% 12% -11% 589% Seresto | Sample Predictive Modeling (Media Spend Optimization) $$ Share: decimal rounding digit representation
  • 6. 6 | P a g e M e a s u r e m e n t & A n a l y t i c s | D a t a B a c k b o n e T e a m ------------------------------------------- Brand: Seresto | BASELINE OPTIMIZATION TEST 4 Demonstration Media Objective: REVENUE/SALES Data Model Technique: Evolutionary Algorithm Goal: Analyze media performance by CHANNEL placement spend based on 2021 YTD benchmarks without changing spend and/or channel inclusion parameters to compare legacy performance against the model's predicted outcome. Objective: Optimize for Conversion by Channel Spend for the Brand REVENUE/SALES Objective. What would spend look like by Channel and Platform if we optimized for conversion without changing total media budget allocation while maintaining all channels and platforms in the media mix. Model Assumption: A correlation exists between channel spend efficiencies, and impressions, clicks, and CPC which ultimately lead to greater conversions. Modeling Setup Parameters Constraint Criteria - Evolutionary Model - Baseline Optimization Test 1 Target Beta (Max Assumed CPC Risk) $0.59 Average CPC used as the assumed dynamic Beta (b) risk variable coefficient. (Find an optimum solution with an average CPC at or below $0.62.) Max Budget Share 0.88 Maximum spend allocation for a single dynamic variable (%) (Maximum spend per channel placement.) Min Target Pools Inclusion 2 Minimum inclusion of dynamic variables in model calculation. (Channel placements.) Target Pool Inclusion Count 2 Total count of all dynamic variables in model calculation. (Channel placements.) Budget Spend $2,556,242 Total budget to be applied in model calculation. (Benchmark budget spend to represent potential gains in model prediction.) Constant Model Variables CTR, CPM, CPA, CVR Data Model | Predicted Outcome Based on Defined Constraint Criteria | Spend Allocation Optimization Test 2 Channel Platform Media Cost $$ Share Impressions Clicks CPC Conversions Digital Display Epsilon $311,830.33 0.12199 48,373,832 27,451 $11.36 20,019 Digital Display DV360 $2,249,493.32 0.88000 597,810,180 4,344,914 $0.52 579,857 Model Prediction Core KPIs $2,561,323.65 1.00199 646,184,012 4,372,365 $0.59 599,876 YTD Comparative Baseline $2,556,242.41 1.00000 645,018,488 4,365,631 $0.59 598,890 Model Prediction Gain | Loss 0% 0% 0.2% 0.2% 0% 0.2% Of note: model found no significant gains based on current channel/platform selection indicating spend is already aligned for best optimization outcomes for the Revenue/Sales objective. Seresto | Sample Predictive Modeling (Media Spend Optimization) $$ Share: decimal rounding digit representation
  • 7. 7 | P a g e M e a s u r e m e n t & A n a l y t i c s | D a t a B a c k b o n e T e a m ------------------------------------------- Brand: Seresto BASELINE OPTIMIZATION TEST ROLLUP COMPARATIVE RESULTS Media Objectives: AWARENESS, ACQUISITION, CONSIDERATION, REVENUE/SALES Data Model Technique: Evolutionary Algorithm Predictive Modeling Impact When we model each campaign objective separately, we can begin to find deeper inefficiencies in media spend. The model demonstration reveals significant performance gains can be reasonably realized simply by optimizing to benchmarked platform performance. Of note, the benchmarking period used within this demonstration was longer than would be recommended, but was used to demonstrate the potential of performance gains using a sizeable budget allocation. Typically, it would be advised optimization and modeling occur no frequent than in 90-day cycles. This allows for media to perform to the best possible outcomes leveraging platform AI algorithms. Optimizing too frequent in shorter time cycles can have a reverse intended effect with poorer performance as the platforms are continuously attempting to re-optimize based on changing spends aligned with selected objectives and performance metrics. The real power behind this demonstration is that we can show the baseline "what if" scenario if we didn't change media buy parameters. Larger gains, much larger gains, could potentially be realized if we were to purely optimize to the best performing channels and platforms. And, for consideration, we did not apply audience targeting to the model or any other performance dimension such as creative, format, messaging, CTA et al - all of which could potentially allow us to optimize deeper for each objective, channel and platform. As the data transformation effort begins to be adopted, data analysis and performance optimization does become a highly strategic and valued direction for greater marketing performance and business ROI. Modeled Objective Media Cost Impressions Clicks CPC Conversions Awareness Model $5,694,496.54 1,592,327,966 2,805,855 $2.03 1,801,293 YTD Awareness Baseline $5,694,515.94 1,027,718,204 1,570,773 $3.63 1,058,139 Acquisition Model $2,853,038.02 35,937,143 768,065 $3.71 1,873,729 YTD Acquisition Baseline $2,853,038.02 62,303,476 726,904 $3.92 725,649 Consideration Model $851,574.49 14,323,119 308,255 $2.76 520,107 YTD Consideration Baseline $850,596.47 43,587,069 275,209 $3.09 75,494 Revenue/Sales Model $2,561,323.65 646,184,012 4,372,365 $0.59 599,876 YTD Revenue/Sales Baseline $2,556,242.41 645,018,488 4,365,631 $0.59 598,890 Model Objective Totals $851,574.49 2,288,772,240 8,254,540 $0.10 4,795,005 YTD Comparative Baseline Totals $850,596.47 1,778,627,237 6,938,517 $0.12 2,458,172 Optimization Impact 0% 29% 19% -16% 95% Seresto | Sample Predictive Modeling (Media Optimization Impact)
  • 8. 8 | P a g e M e a s u r e m e n t & A n a l y t i c s | D a t a B a c k b o n e T e a m ------------------------------------------- CHANNEL | PLATFORM | OBJECTIVE | AUDIENCE | CAMPAIGN NAME | MEDIA BUY SIZE | CREATIVE FORMAT | PRIMARY KPI Data Modeling Impact We can use data modeling in an assortment of ways across digital marketing. For paid media, if we have the data points linking attribution dimensions to metric performance, we can likely build a model to optimize future spends. In the examples just demonstrated, significant performance gains were predicted for all leading KPIs. In the case of allowing the model to optimize spend by Objective and Platform, we have demonstrated double digit gains for impressions and clicks, reduced CPC by as much as 16 percent, and improved conversion gains by as much as 96%. The data used which was linked and cross-tabbed into a separate dataset for exploration as shown on the following page. Upon request, we can explore the data using data modeling to demonstrate to interested key stakeholders how we can predict "best buy" scenarios for future media spends. Deeper multi-dimensional ACTIONABLE analyses based on a 90-day benchmarks which can be explored include: � channel (as demonstrated), � channel + platform, � channel + platform + objective (as demonstrated), � channel + platform + objective + audience, or � any combination of dimensions which can be linked to data metrics. As more expansive data becomes available and ingested into the dashboard environment including rebates and revenues, the same process could be applied to gather additional business insights and intelligence for maximizing marketing ROI and steering 2022 strategic business and marketing directions. With adoption, Data Modeling Best practices include: 1. Clearly define and understand the desired optimization objective. 2. Identify the dimensions and metrics that are directly correlated to the objective's performance. 3. Define a baseline benchmark period to measure and compare predicted results (most recent 90 days optimal). 4. Collect the required data and groom as needed into a workable dataset. 5. Build, test and validate the data model. 6. Define the model's constraint criteria (applicable considerations, limitations, restrictions). 7. Develop a list of the "what if" scenarios based on the constraint criteria. 8. Run and log the "what if" scenario results to find the best possible outcome. 9. Implement the parameters defined for the best chosen optimization outcome. 10. Allow the applied changes sufficient time to re-adjust and optimize by platform and where applicable for AI algorithms. 11. Continue to measure ongoing performance. 12. Measure, adjust and/or re-optimize periodically per scheduled timelines. Final Notes | Predictive Modeling (Media Optimization)
  • 9. 9 | P a g e M e a s u r e m e n t & A n a l y t i c s | D a t a B a c k b o n e T e a m ------------------------------------------- 2021 YTD Multi-Dimensional Baseline Paid Media Performance x Channel, Objective, Platform Brand Media Cost Impressions Clicks CTR CPC CPM CPA Conversions CVR Galliprant Baseline $6,466,681.92 2,102,527,024 10,553,494 0.50% $0.61 $3.08 $6.25 1,034,899 9.81% Digital Audio $201,776.20 18,699,108 96,690 0.52% $2.09 $10.79 $5.42 37,197 38.47% Awareness $201,776.20 18,699,108 96,690 0.52% $2.09 $10.79 $5.42 37,197 38.47% Pandora Stream $125,302.61 12,219,029 94,727 0.78% $1.32 $10.25 $3.38 37,074 39.14% Spotify $76,473.59 6,480,079 1,963 0.03% $38.96 $11.80 $621.74 123 6.27% Digital Display $1,261,827.30 1,359,828,708 1,067,852 0.08% $1.18 $0.93 $1.67 757,780 70.96% Awareness $1,261,827.30 1,359,828,708 1,067,852 0.08% $1.18 $0.93 $1.67 757,780 70.96% DV360 $1,147,274.66 1,338,535,865 992,910 0.07% $1.16 $0.86 $1.55 740,516 74.58% Spotify $114,552.64 9,112,188 57,410 0.63% $2.00 $12.57 $8.00 14,316 24.94% Kargo $0.00 1,974,467 552 0.03% $0.00 $0.00 $0.00 756 136.96% PadSquad $0.00 1,851,648 5,640 0.30% $0.00 $0.00 $0.00 322 5.71% Reddit $0.00 8,354,540 11,340 0.14% $0.00 $0.00 $0.00 1,870 16.49% Digital Search $550,312.91 2,016,101 91,405 4.53% $6.02 $272.96 $8.98 61,293 67.06% Acquisition $274,609.07 1,328,249 56,027 4.22% $4.90 $206.75 $11.42 24,054 42.93% Google Ads $220,192.06 828,768 31,531 3.80% $6.98 $265.69 $9.20 23,937 75.92% Bing Ads $54,417.01 499,481 24,496 4.90% $2.22 $108.95 $465.10 117 0.48% Consideration $275,703.84 687,852 35,378 5.14% $7.79 $400.82 $7.40 37,239 105.26% Google Ads $269,723.33 632,913 33,801 5.34% $7.98 $426.16 $7.25 37,201 110.06% Bing Ads $5,980.51 54,939 1,577 2.87% $3.79 $108.86 $157.38 38 2.41% Digital Social $1,538,367.55 349,654,194 8,441,948 2.41% $0.18 $4.40 $656.86 2,342 0.03% Awareness $754,419.89 265,848,211 788,532 0.30% $0.96 $2.84 $1,022.25 738 0.09% Facebook $467,501.70 140,810,782 225,065 0.16% $2.08 $3.32 $834.82 560 0.25% Instagram $286,918.19 125,037,429 563,467 0.45% $0.51 $2.29 $1,611.90 178 0.03% Consideration $783,947.66 83,805,983 7,653,416 9.13% $0.10 $9.35 $488.75 1,604 0.02% Facebook $62,795.65 2,463,208 68,625 2.79% $0.92 $25.49 $119.16 527 0.77% Instagram $721,152.01 81,342,775 7,584,791 9.32% $0.10 $8.87 $669.59 1,077 0.01% Digital Video $2,914,397.96 372,328,913 855,599 0.23% $3.41 $7.83 $16.53 176,287 20.60% Awareness $2,914,397.96 372,328,913 855,599 0.23% $3.41 $7.83 $16.53 176,287 20.60% Hulu $460,383.98 17,208,111 2 0.00% $230,191.99 $26.75 $46,038.40 10 500.00% Amobee $1,198,827.04 45,855,741 1,019 0.00% $1,176.47 $26.14 $4,610.87 260 25.52% DV360 $1,255,186.94 301,520,325 835,013 0.28% $1.50 $4.16 $7.22 173,965 20.83% Reddit $0.00 7,744,736 19,565 0.25% $0.00 $0.00 $0.00 2,052 10.49% Channel Benchmarks $6,466,681.92 2,102,527,024 10,553,494 0.5019% $0.61 $3.08 $6.25 1,034,899 9.81% Objective Benchmarks $6,466,681.92 2,102,527,024 10,553,494 0.5019% $0.61 $3.08 $0.00 1,034,899 9.81% Sample Dataset for Data Modeling (Media Optimization)