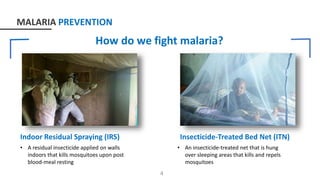
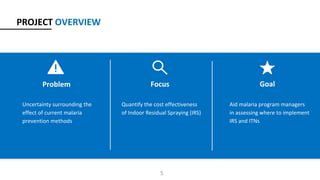
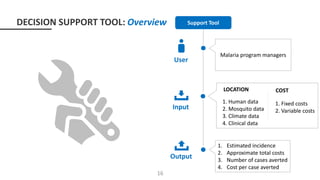
1. The document presents a proposed decision support tool to help malaria program managers in Senegal assess the cost-effectiveness of indoor residual spraying (IRS) and insecticide-treated bed nets (ITNs) for malaria prevention.
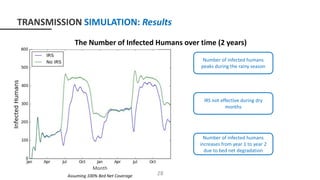
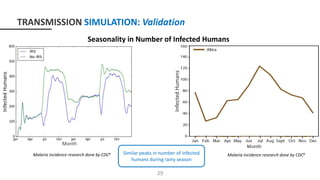
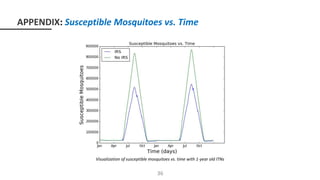
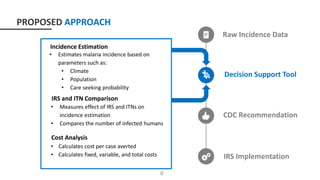
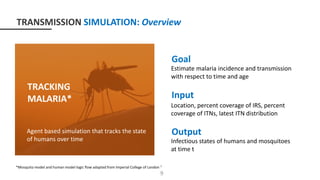
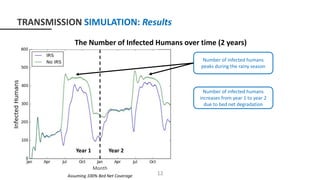
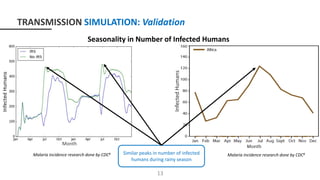
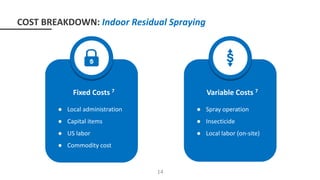
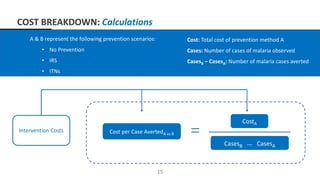
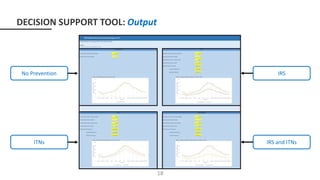
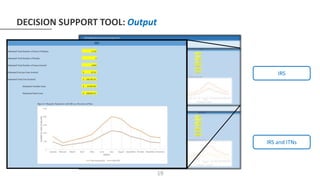
2. The tool uses an agent-based transmission simulation to estimate malaria incidence under different prevention scenarios. It also calculates the costs and number of cases averted by IRS and ITNs to determine the cost per case averted for each intervention.
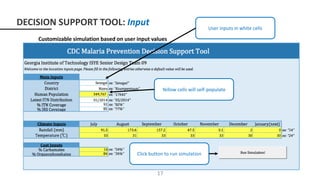
3. The goal is to provide malaria program managers with customized output to help guide decisions around where and when to implement IRS versus ITNs based on estimated impact and cost-effectiveness. This could help optimize budget allocation and intervention strategies.


![Parameter Description Value
H: Relative biting rate [1] The number of bites per human per
day relative to rest of population
Lognormal distribution(1,1.127)
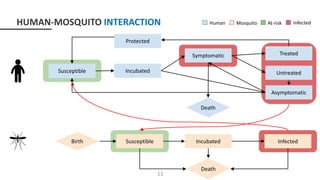
H: Status of Infection [1] Infection status of human at time t Infected, uninfected, protected,
incubated, asymptomatic, dead
H: Probability of Immunity The probability that a human will be
immune to malaria
Normal distribution (max 0.88, min
0.05)
H: Probability of death The probability that a human will die
from malaria
Normal distribution similar to
immunity
H: Probability of death after symptom The probability that a human will die
after showing symptom
0.001
H: Death time Time it takes for a human to die from
malaria
1 -5 days
H: Recovery rate [2] Time it takes for a human to recover
from malaria
Normal(14)
H: Incubation period [3] 𝑛 𝑏 Normal(14)
APPENDIX: Parameters
24](https://image.slidesharecdn.com/team09cdcvectorcontrolfinalpresentation-171118111900/85/CDC-Malaria-Vector-Control-24-320.jpg)
![Parameter Description Value
H: Infectious period[3] r 100 days
H: Care seeking probability[4] The probability that a human will visit
a health post
0.4894
H: Initial effect of human biting rate The probability that human biting rate
is effective initially
0.75
H: Age distribution The distribution of human age 0.45 (Under 15)
0.55 (15 - 64)
H: asymptomatic from infected The probability that an infected
human will be asymptomatic
0.75
H: Infectious from asymptomatic The probability that an asymptomatic
human will be infectious
0.80
H: reduction of human biting rate The probability that human biting rate
will be reduced due to ITN
0.90
APPENDIX: Parameters
25](https://image.slidesharecdn.com/team09cdcvectorcontrolfinalpresentation-171118111900/85/CDC-Malaria-Vector-Control-25-320.jpg)
![Parameter Description Value
M: Feeding rate a 2-3 bites per day
M: Number of mosquitoes at time 0[5] Initial mosquito population 25 * number of humans in simulation
M: Number of infected mosquitoes at
time 0[5]
Initial infected mosquito population 0.03 * number of mosquitoes
M: Mosquito death rate[6] Death rate based on temperature Discrete distribution
M: Lifespan of mosquitoes 1/g 10 days
M: Feeding probability The probability that a mosquito feeds
on any given day
0.33
ITN Mortality rate The probability that an ITN kills a
mosquito that flies on it
0.30 0.05 (linear decrease)
APPENDIX: Parameters
26](https://image.slidesharecdn.com/team09cdcvectorcontrolfinalpresentation-171118111900/85/CDC-Malaria-Vector-Control-26-320.jpg)
![[1] http://journals.plos.org/plosmedicine/article?id=10.1371%2Fjournal.pmed.1000324#s3
[2] https://www.medicinenet.com/is_malaria_contagious/article.htm#what_is_the_incubation_period_for_malaria
[3] https://malariajournal.biomedcentral.com/articles/10.1186/1475-2875-3-13
[4] Calculated using data from CDC(RM NATIONALE PPS DISTRICT_EPS 2014 VINALE.xlsx)
[5] https://www.ncbi.nlm.nih.gov/books/NBK2286/
[6] http://journals.plos.org/plosone/article?id=10.1371/journal.pone.0079276
APPENDIX: Parameter Resources
27](https://image.slidesharecdn.com/team09cdcvectorcontrolfinalpresentation-171118111900/85/CDC-Malaria-Vector-Control-27-320.jpg)