
Recommended
More Related Content
What's hot
What's hot (20)
Similar to Sir presentation
Similar to Sir presentation (20)
Recently uploaded
Recently uploaded (20)
Sir presentation
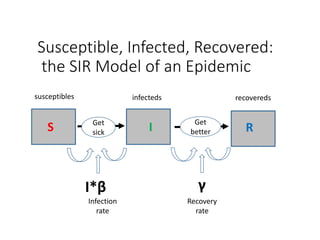
- 1. Susceptible, Infected, Recovered: the SIR Model of an Epidemic S I R I*β γ Get sick Get better Infection rate Recovery rate susceptibles infecteds recovereds
- 2. What is a Mathematical Model? • a mathematical description of the real-world • focuses on specific quantitative features of the scenario, ignores others (simplification) • involves hypotheses that can be tested against real data
- 3. Why Study Epidemic Models? • To supplement statistical extrapolation. • To learn more about the qualitative dynamics of a disease. • To test hypotheses about, for example, prevention strategies, disease transmission, significant characteristics, etc.
- 4. Why SIR models? • Infectious diseases kill millions of people world-wide • Malaria, TB, HIV/AIDS • New diseases emerge suddenly and spread quickly • SARS, West Nile Virus, HIV, Avian Influenza… • Effective and fast control measures are needed • Models allow you to predict (estimate) when you don’t KNOW • What are the costs and benefits of different control strategies? • When should there be quarantines? • Who should receive vaccinations? • When should wildlife or domestic animals be killed? • Which human populations are most vulnerable? • How many people are likely to be infected? To get sick? To die?
- 5. The SIR Epidemic Model • S = fraction of susceptibles in a population • I = fraction of infecteds in a population • R = fraction of recovereds in a population S + I + R = 1 • Consider a disease spread by contact with infected individuals. • Individuals recover from the disease and gain further immunity from it.
- 6. Simple SIR Model • Susceptibles (S) have no immunity from the disease. • Infecteds (I) have the disease and can spread it to others. • Recovereds (R) have recovered from the disease and are immune to further infection. Kermack & McKendrick, 1927
- 7. Parameters of the Model • I*beta= the infection rate • gamma= the removal rate • The basic reproduction number is obtained from these parameters: NR = infection rate / removal rate • This number represents the average number of infections caused by one infective in a totally susceptible population. As such, an epidemic can occur only if NR > 1.
- 8. Vaccination and Herd Immunity • If only a fraction S0 of the population is susceptible, the reproduction number is NRS0, and an epidemic can occur only if this number exceeds 1. • Suppose a fraction V of the population is vaccinated against the disease. In this case, S0=1-V and no epidemic can occur if V > 1 – 1/NR • The basic reproduction number NR can vary from 3 to 5 for smallpox, 16 to 18 for measles, and over 100 for malaria [Keeling, 2001].
- 9. What if ‘R’ isn’t realisitic? • Susceptibles (S) have no immunity from the disease. • Infecteds (I) have the disease and can spread it to others. If there is no immunity after being sick, individuals cycle between S and I. What do we then need to add to the model? S I I*β Get sick Infection rate susceptibles infecteds
- 10. Enhancing the SIR Model • Can consider additional populations of disease vectors (e.g. fleas, rats). • Can consider an exposed (but not yet infected) class, the SEIR model. • SIRS, SIS, and double (gendered) models are sometimes used for sexually transmitted diseases. • Can consider biased mixing, age differences, multiple types of transmission, geographic spread, etc. • Enhancements often require more compartments.
- 12. The effect of the airline transportation network Colizza et al. (2007) PLoS Medicine 4, 0095 Main modeling features (SARS, H1N1, etc.): SIR model with empirical population and airline traffic/network data homogeneous mixing within cites network connections and stochastic transport between cities
- 13. H1N1 Flu http://www.gleamviz.org/ Mobility networks in Europe (network-coupled SIR model): Left: airport network; Right: commuting network.
- 15. Today’s Agenda • Work with Stamps Flu Data • Examine the data going into the model • Think: What can it capture? What’s it leaving out? • Run statistical models in R • Get practice thinking about what each of your variables means biologically, and what you can (and cannot say) using them • Start basic coding of stats and graphs from which to draw conclusions of biological relevance • Think: What variables am I using, and why? Do my graphs tell the same story as my stats? What do I get by using both? • Work with Stamps Norovirus Data • Examine the data going into the model • Again, Think: What can it capture? What’s it leaving out? • Run Spatial Analysis • Get practice using spatial tools, and think about how this information can inform SIR models • Practice cleaning up data for more complex analysis, and argue for proposed health interventions based on your evidence (data and models) • Think: What data is most important here? How does the prognosis improve, based on my models, if I were to change a certain parameter through a specific intervention?
- 16. References • J. D. Murray, Mathematical Biology, Springer-Verlag, 1989. • O. Diekmann & A. P. Heesterbeek, Mathematical Epidemiology of Infectious Diseases, Wiley, 2000. • Matt Keeling, The Mathematics of Diseases, http://plus.maths.org, 2004. • Allyn Jackson, Modeling the Aids Epidemic, Notices of the American Mathematical Society, 36:981-983, 1989.