Downloaded 308 times


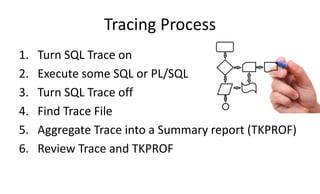
![Other ways to turn Trace on and off
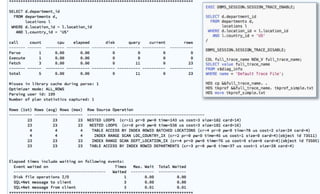
• DBMS_SESSION.SET_SQL_TRACE(TRUE|FALSE)
• ALTER SESSION SET SQL_TRACE = TRUE|FALSE
• ALTER SESSION SET EVENT 10046
• DBMS_MONITOR.SESSION_TRACE_ENABLE or DIS
• ALTER SYSTEM SET EVENTS 'sql_trace [sql:&&sql_id]
bind=true, wait=true';
• ORADEBUG
• Oracle Enterprise Manager (OEM)](https://image.slidesharecdn.com/tracetkprofexplain-170419021507/85/Understanding-SQL-Trace-TKPROF-and-Execution-Plan-for-beginners-7-320.jpg)
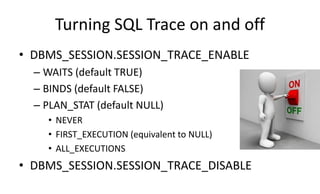
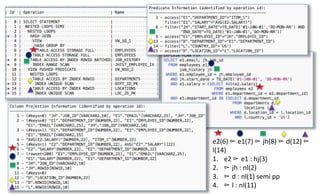
![Alter Session
• ALTER SESSION SET
– SQL_TRACE = [ TRUE | FALSE ]
– EVENTS ‘10046 trace name context forever, level N’
• N = 1: all executions (10g-) or 1st execution (11g+)
• N = 4: Binds
• N = 8: Waits
• N = 12 = 4 + 8
• N = 16: each execution (11g+)
• N = 64: 1st + each where DB time > 1min (11.2.0.2+)](https://image.slidesharecdn.com/tracetkprofexplain-170419021507/85/Understanding-SQL-Trace-TKPROF-and-Execution-Plan-for-beginners-8-320.jpg)
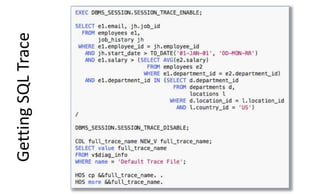
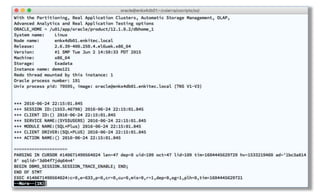
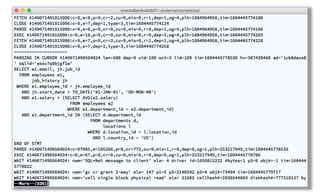
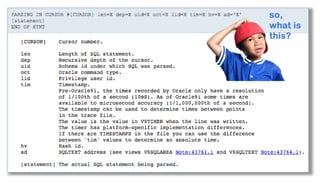
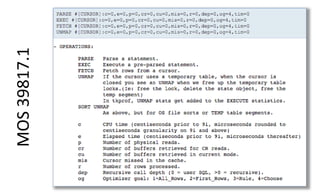
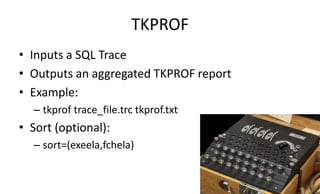
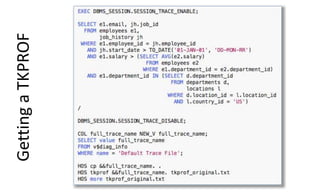
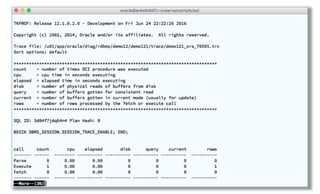
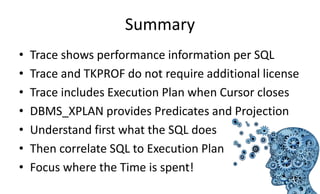


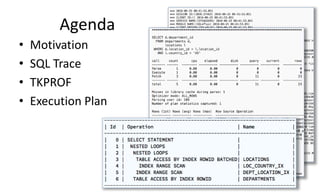
The document provides a comprehensive overview of SQL trace, TKPROF, and execution plans for beginners, emphasizing their importance in diagnosing performance issues with SQL queries. It outlines the process for enabling SQL trace, aggregating the data using TKPROF, and interpreting execution plans, including common operations and join methods. The document also includes references for further learning and practical examples for better understanding.