Download as PPSX, PPTX
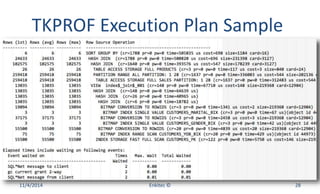
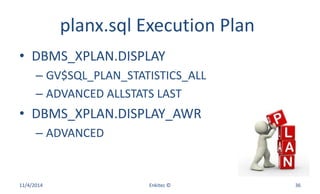
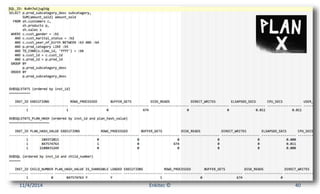
![TKPROF Syntax
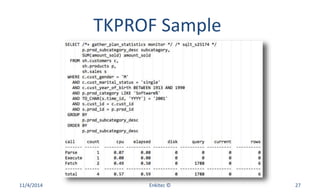
• tkprof tracefile outputfile [sort=option]
• sort=prsela fchela exeela
11/4/2014 Enkitec © 26](https://image.slidesharecdn.com/howadevelopercantroubleshootasqlperformingpoorlyonaproductiondb-141104051426-conversion-gate01/85/How-a-Developer-can-Troubleshoot-a-SQL-performing-poorly-on-a-Production-DB-26-320.jpg)

The document outlines a process for SQL performance troubleshooting in production databases, emphasizing the need for proper code instrumentation and diagnostic collection. It details common troubleshooting steps, recommended diagnostic tools, and methods for gathering SQL performance data, including various APIs and tracing techniques. Additionally, it provides references and contact information for further support and resources.


![Understanding Oracle RAC 12c Internals OOW13 [CON8806]](https://cdn.slidesharecdn.com/ss_thumbnails/understandingoraclerac12cinternalsoow13con8806-131001010807-phpapp02-thumbnail.jpg?width=640&height=640&fit=bounds)