SlideShare a Scribd company logo
1 of 14
State of N.C., Charlotte & Surrounding Cities   State of North Carolina    Charlotte
Population 2006                                                 8,856,505        630,478
Population 2000                                                 8,049,313        540,828
Percent Change 2000 to 2006                                         10.1%           11.2%
Pop. Under 18 years old 2000                                        24.4%           24.7%
Pop. 65 years and older 2000                                        12.0%            8.8%
High School graduates 25+ 2000                                      78.1%           84.9%
Atleast bechelor's degree 25+ 2000                                  22.5%           36.4%
 Total Number of Businesses                                       642,597         51,434
Retail Sales 2002 ($1000)                                     88,821,446       7,943,719
 Retail Sales per capita 2002                    $              10,685.00 $ 13,674.00
 Households 2000                                                3,132,013        215,449
Persons per household 2000                                            2.49           2.45
Predicted Total Pop. By 2020                                                   1,000,000
Pop. Percent Rise from 2006 to 2020                                                 63.0%
                        TRUE


                                                Metropolitan Statistical    Population
                       Rank                     Area                         7/1/2009
                        1                       St. George, UT                137,473
                        2                       Provo, UT                     555,551
                        3                       Raleigh, NC                 1,125,827
4              Greeley, CO             254,759
                5              Las Vegas, NV          1,902,834
                6              Bend, OR                158,629
                7              Austin, TX             1,705,075
                8              Gainesville, GA         187,743
                9              Phoenix, AZ            4,364,094
                10             Myrtle Beach, SC        263,868
                11             Fayetteville, AR        464,623
                12             Cape Coral, FL          586,908
                13             Charlotte, NC          1,745,524
                14             Boise City, ID          606,376
                15             McAllen, TX             741,152
                16             Wilmington, NC          354,525
                17             Atlanta, GA            5,475,213
                18             Prescott, AZ            215,686
                19             Coeur d'Alene, ID       139,390
                20             Kennewick, WA           245,649


      2010 Population by Age              Charlotte, NC

Age 0 to 5                                             9.50%
Age 6 to 11                                            8.02%
Age 12 to 17                                           7.78%
Age 18 to 24                                          10.49%
Age 25 to 34                                          18.88%
Age 35 to 44                                          15.37%
Age 45 to 54                                          14.00%
Age 55 to 64                                           8.46%
Age 65 to 74                                           4.00%
Age 75 to 84                                           2.49%
Age 85+                                                0.99%
Concord            Gastonia            Hickory              Huntersville    Kannapolis
           62,587              69,904               40,583        38,796           40,223
           55,977              66,277               37,222        24,960           36,910
            11.1%                3.3%                 8.3%          52.3%              8.8%
            26.2%               25.0%                23.3%          28.3%            24.2%
            11.1%               13.8%                13.6%            6.2%           15.6%
            79.2%               72.2%                79.1%          91.6%            69.4%
            22.8%               20.2%                28.0%          46.5%            12.0%
            4,874               5,039                5,230          2,941            2,453
        1,320,135           1,110,179            1,623,223       395,637          366,377
$       22,578.00 $         16,372.00 $          41,107.00 $ 12,947.00 $         9,642.00
           20,962              25,945               15,372          9,171          14,804
              2.61                2.50                 2.35            2.67            2.46


    Population      % Change 4/1/00-
     4/1/2000            7/1/09
       90,354             52.1
      376,774             47.4
      797,071             41.2
180,926         40.8
1,375,765        38.3
 115,367         37.5
1,249,763        36.4
 139,277         34.8
3,251,876        34.2
 196,629         34.2
 347,045         33.9
 440,888         33.1
1,330,448        31.2
 464,840         30.4
 569,463         30.1
 274,532         29.1
4,247,981        28.9
 167,517         28.8
 108,685         28.3
 191,822         28.1


     North Carolina     United States

               8.73%                8.84%
               7.93%                8.41%
               7.98%                8.65%
               10.38%               9.94%
               14.54%              13.40%
               13.79%              13.74%
               14.48%              14.32%
               11.08%              10.80%
               6.00%                6.11%
               3.64%                4.04%
               1.45%                1.75%
Monroe       Salisbury         Rock Hill, SC    Spartanburg, SC   Total        Average
     30,871            28,480          61,620             38,561    1,042,103      104,210
     26,228            26,462          49,765             39,673      904,302       90,430
      13.9%              -0.3%            23.4%             -3.3%                    12.9%
      26.9%             21.8%             25.3%            25.2%                     25.1%
      10.8%             19.9%             11.3%            15.4%                     12.7%
      67.6%             75.7%             75.2%            72.4%                     76.7%
      15.6%             24.1%             24.3%            26.0%                     25.6%
      2,482             2,317            3,889             3,706        84,365       8,437
    774,798           640,973        811,332            891,820 15,878,193       1,587,819
$ 27,390.00 $       23,048.00 $ 14,774.00 $            22,684.00               $ 20,421.60
      9,029            10,276          18,750             15,989      355,747       35,575
        2.83              2.29             2.49              2.33                     2.50
Max.        Min.          The Rest of NC
    630,478     28,480         7,814,402
    540,828     24,960
      52.3%       -3.3%
      28.3%      21.8%
      19.9%        6.2%
      91.6%      67.6%
      46.5%      12.0%
     51,434      2,317
  7,943,719   366,377
$ 41,107.00 $ 9,642.00
    215,449      9,029
       2.83        2.29
Charlotte's Pop. to NC's Pop.


The Rest of NC
     93%


                                         Charlotte
                                            7%
Charlotte & Surrounding Areas


                      The Rest of N.C.
                      88%


                                                                                                                        Charlotte
                                                                                                                        7%


Charlotte   Concord   Gastonia   Hickory    Huntersville   Kannapolis   Monroe   Salisbury   Rock Hill, SC   Spartanburg, SC   The Rest of NC
Age 85+


          Age 75 to 84


          Age 65 to 74


          Age 55 to 64


          Age 45 to 54


          Age 35 to 44

                                                                                            United States
          Age 25 to 34
                                                                                            North Carolina
                                                                                            Charlotte
          Age 18 to 24


          Age 12 to 17


           Age 6 to 11


            Age 0 to 5


2010 Population by Age


                         0   0.02   0.04   0.06   0.08   0.1   0.12   0.14   0.16   0.18   0.2
% Change 4/1/00-7/1/09
60


50


40


30


20


10


 0
Los Angeles, CA    San Francisco, CA    District of Columbia     Atlanta, GA    Honolulu, HA
        3,849,378              744,041                  599,657        486,411         377,357
        3,694,820              776,733                  572,055        416,474         371,657
              4.2%                -4.2%                     4.8%          16.8%            1.5%
              7.7%                 4.1%                     6.2%           6.4%            5.1%
             26.6%                14.5%                    19.0%          22.3%           19.2%
              9.7%                13.7%                    11.7%           9.7%           17.8%
             40.9%                36.8%                    12.9%           6.6%           25.3%
             66.6%                81.2%                    77.8%          76.9%           83.4%
             25.5%                45.0%                    39.1%          34.6%           31.1%
          395,667               91,873                   47,172         43,576          38,221
    30,196,646.00         8,883,316.00                            4,732,270.00    5,375,770.00
$        7,976.00 $          11,658.00                           $ 10,670.00 $       14,359.00
        1,275,412              329,700                  248,338        168,147         140,337
              2.83                  2.3                      2.2            2.3             2.6
             469.0                 46.0                     61.4          131.0            85.0
         7,876.90             16,636.0                   9,378.0      3,161.10        4,336.70
Wichita, KS   Baltimore, MD    Memphis, TN    Dallas, TX   Totals Average   Max.
    357,698           631,366       670,902 1,232,940 8,949,750     964,601 3,849,378
    344,284           651,154       650,100 1,188,580 8,665,857     934,660 3,694,820
         1.8%            -3.0%          -1.8%         3.7%            2.51%    16.80%
         8.0%             6.4%           7.8%         8.3%            6.46%      8.30%
       27.1%             24.8%         27.9%        26.6%            22.68%    27.90%
       11.9%             13.2%         10.9%          8.6%           12.33%    17.80%
         8.1%             4.6%           4.0%       24.4%            17.40%    40.90%
       83.8%             68.4%         76.4%        70.4%            76.81%    83.80%
       25.3%             19.1%         20.9%        27.7%            30.08%    45.00%


   139,087         257,996        250,721     451,833   3,261,571   351,217   1,275,412
       2.44            2.42          2.52        2.58
      135.0            80.0         279.0       342.0     1628.4 16080.00%         469
   2,536.20        8,058.80        2327.4      3469.9
Min.
357,698
344,284
  -4.20%
   4.10%
  14.50%
   9.70%
   4.00%
  66.60%
  19.10%


139,087

     46

More Related Content

What's hot

Avance de crédito Infonavit al 9 sep-12
Avance de crédito Infonavit al 9 sep-12Avance de crédito Infonavit al 9 sep-12
Avance de crédito Infonavit al 9 sep-12Sergio Velazco
 
Avance de crédito infonavit al 29 jul-12
Avance de crédito infonavit al 29 jul-12Avance de crédito infonavit al 29 jul-12
Avance de crédito infonavit al 29 jul-12Sergio Velazco
 
Comunicado a desarrolladores 2013 presupuesto (3)
Comunicado a desarrolladores 2013 presupuesto (3)Comunicado a desarrolladores 2013 presupuesto (3)
Comunicado a desarrolladores 2013 presupuesto (3)Sergio Velazco
 
F03.06 Lighting Savings Chart
F03.06 Lighting Savings ChartF03.06 Lighting Savings Chart
F03.06 Lighting Savings CharteCO Zero LLC
 
Avance de Crédito Infonavit al 08 julio 2012
Avance de Crédito Infonavit al 08 julio 2012Avance de Crédito Infonavit al 08 julio 2012
Avance de Crédito Infonavit al 08 julio 2012Sergio Velazco
 
Avance crediticio al 03 jun 12
Avance crediticio al 03 jun 12Avance crediticio al 03 jun 12
Avance crediticio al 03 jun 12Sergio Velazco
 
Avance de Crédito Infonavit al 27 may 12
Avance de Crédito Infonavit al 27 may 12Avance de Crédito Infonavit al 27 may 12
Avance de Crédito Infonavit al 27 may 12Sergio Velazco
 
Avance crediticio al 22 julio 2012
Avance crediticio al 22 julio 2012Avance crediticio al 22 julio 2012
Avance crediticio al 22 julio 2012Sergio Velazco
 
SA Facebook Stats - February 2008
SA Facebook Stats - February 2008SA Facebook Stats - February 2008
SA Facebook Stats - February 2008Justin Hartman
 
whole food market fiveyeardata
whole food market  fiveyeardatawhole food market  fiveyeardata
whole food market fiveyeardatafinance44
 
2011 Poverty Guidelines for CHIP & Children's Medicaid
2011 Poverty Guidelines for CHIP & Children's Medicaid2011 Poverty Guidelines for CHIP & Children's Medicaid
2011 Poverty Guidelines for CHIP & Children's Medicaid100% Campaign
 
Fundamental Analysis and Analyst Recommendations - China Railway
Fundamental Analysis and Analyst Recommendations - China RailwayFundamental Analysis and Analyst Recommendations - China Railway
Fundamental Analysis and Analyst Recommendations - China RailwayBCV
 
Open2012 fertility-entrepreneurship-ecosystem-down
Open2012 fertility-entrepreneurship-ecosystem-downOpen2012 fertility-entrepreneurship-ecosystem-down
Open2012 fertility-entrepreneurship-ecosystem-downthe nciia
 
Avance crediticio al 24 junio 2012
Avance crediticio al 24 junio 2012Avance crediticio al 24 junio 2012
Avance crediticio al 24 junio 2012Sergio Velazco
 
Buying power index md zip codes
Buying power index md zip codesBuying power index md zip codes
Buying power index md zip codesHarrison Marketing
 
wyeth 3Q 2008 Net Revenue Report
wyeth 3Q 2008 Net Revenue Reportwyeth 3Q 2008 Net Revenue Report
wyeth 3Q 2008 Net Revenue Reportfinance12
 
M'SIA PRESENTATION 2012
M'SIA PRESENTATION 2012M'SIA PRESENTATION 2012
M'SIA PRESENTATION 2012Ezz Ahmad
 

What's hot (20)

Houston Market Report March 2010
Houston Market Report March 2010Houston Market Report March 2010
Houston Market Report March 2010
 
Avance de crédito Infonavit al 9 sep-12
Avance de crédito Infonavit al 9 sep-12Avance de crédito Infonavit al 9 sep-12
Avance de crédito Infonavit al 9 sep-12
 
Avance de crédito infonavit al 29 jul-12
Avance de crédito infonavit al 29 jul-12Avance de crédito infonavit al 29 jul-12
Avance de crédito infonavit al 29 jul-12
 
Comunicado a desarrolladores 2013 presupuesto (3)
Comunicado a desarrolladores 2013 presupuesto (3)Comunicado a desarrolladores 2013 presupuesto (3)
Comunicado a desarrolladores 2013 presupuesto (3)
 
F03.06 Lighting Savings Chart
F03.06 Lighting Savings ChartF03.06 Lighting Savings Chart
F03.06 Lighting Savings Chart
 
The Impact of Health Care Reform on Immigrants
The Impact of Health Care Reform on ImmigrantsThe Impact of Health Care Reform on Immigrants
The Impact of Health Care Reform on Immigrants
 
Avance de Crédito Infonavit al 08 julio 2012
Avance de Crédito Infonavit al 08 julio 2012Avance de Crédito Infonavit al 08 julio 2012
Avance de Crédito Infonavit al 08 julio 2012
 
Avance crediticio al 03 jun 12
Avance crediticio al 03 jun 12Avance crediticio al 03 jun 12
Avance crediticio al 03 jun 12
 
Avance de Crédito Infonavit al 27 may 12
Avance de Crédito Infonavit al 27 may 12Avance de Crédito Infonavit al 27 may 12
Avance de Crédito Infonavit al 27 may 12
 
Avance crediticio al 22 julio 2012
Avance crediticio al 22 julio 2012Avance crediticio al 22 julio 2012
Avance crediticio al 22 julio 2012
 
SA Facebook Stats - February 2008
SA Facebook Stats - February 2008SA Facebook Stats - February 2008
SA Facebook Stats - February 2008
 
State-by-State Comparison
State-by-State ComparisonState-by-State Comparison
State-by-State Comparison
 
whole food market fiveyeardata
whole food market  fiveyeardatawhole food market  fiveyeardata
whole food market fiveyeardata
 
2011 Poverty Guidelines for CHIP & Children's Medicaid
2011 Poverty Guidelines for CHIP & Children's Medicaid2011 Poverty Guidelines for CHIP & Children's Medicaid
2011 Poverty Guidelines for CHIP & Children's Medicaid
 
Fundamental Analysis and Analyst Recommendations - China Railway
Fundamental Analysis and Analyst Recommendations - China RailwayFundamental Analysis and Analyst Recommendations - China Railway
Fundamental Analysis and Analyst Recommendations - China Railway
 
Open2012 fertility-entrepreneurship-ecosystem-down
Open2012 fertility-entrepreneurship-ecosystem-downOpen2012 fertility-entrepreneurship-ecosystem-down
Open2012 fertility-entrepreneurship-ecosystem-down
 
Avance crediticio al 24 junio 2012
Avance crediticio al 24 junio 2012Avance crediticio al 24 junio 2012
Avance crediticio al 24 junio 2012
 
Buying power index md zip codes
Buying power index md zip codesBuying power index md zip codes
Buying power index md zip codes
 
wyeth 3Q 2008 Net Revenue Report
wyeth 3Q 2008 Net Revenue Reportwyeth 3Q 2008 Net Revenue Report
wyeth 3Q 2008 Net Revenue Report
 
M'SIA PRESENTATION 2012
M'SIA PRESENTATION 2012M'SIA PRESENTATION 2012
M'SIA PRESENTATION 2012
 

Viewers also liked

Ab Ovo in het Onderwijs
Ab Ovo in het OnderwijsAb Ovo in het Onderwijs
Ab Ovo in het Onderwijsmhoeymans
 
Last ttc activity
Last ttc activityLast ttc activity
Last ttc activitycecitenorio
 
Listen Up, It's Buddy Guy
Listen Up, It's Buddy Guy Listen Up, It's Buddy Guy
Listen Up, It's Buddy Guy Donald Gibson
 
An Interview with Bill Frisell
An Interview with Bill FrisellAn Interview with Bill Frisell
An Interview with Bill FrisellDonald Gibson
 
Christian outfitters
Christian outfittersChristian outfitters
Christian outfittersCameron Boles
 
Last ttc activity
Last ttc activityLast ttc activity
Last ttc activitycecitenorio
 
08 bab 7 rencana konservasi das kuaro
08 bab 7 rencana konservasi das kuaro08 bab 7 rencana konservasi das kuaro
08 bab 7 rencana konservasi das kuaroAndri Kwin
 
Future Programming Language
Future Programming LanguageFuture Programming Language
Future Programming LanguageYLTO
 
Christian Outfitters
Christian OutfittersChristian Outfitters
Christian OutfittersCameron Boles
 
Nganhang ct tangtoctmdt
Nganhang ct tangtoctmdtNganhang ct tangtoctmdt
Nganhang ct tangtoctmdthangnguyen2701
 

Viewers also liked (16)

C.o. resume
C.o. resumeC.o. resume
C.o. resume
 
Ab Ovo in het Onderwijs
Ab Ovo in het OnderwijsAb Ovo in het Onderwijs
Ab Ovo in het Onderwijs
 
Last ttc activity
Last ttc activityLast ttc activity
Last ttc activity
 
Nhan thuc cskh 151111
Nhan thuc cskh 151111Nhan thuc cskh 151111
Nhan thuc cskh 151111
 
Listen Up, It's Buddy Guy
Listen Up, It's Buddy Guy Listen Up, It's Buddy Guy
Listen Up, It's Buddy Guy
 
An Interview with Bill Frisell
An Interview with Bill FrisellAn Interview with Bill Frisell
An Interview with Bill Frisell
 
Christian outfitters
Christian outfittersChristian outfitters
Christian outfitters
 
Charlotte's stats
Charlotte's statsCharlotte's stats
Charlotte's stats
 
Tinh bao21
Tinh bao21Tinh bao21
Tinh bao21
 
Last ttc activity
Last ttc activityLast ttc activity
Last ttc activity
 
Tinh bao 29
Tinh bao 29Tinh bao 29
Tinh bao 29
 
08 bab 7 rencana konservasi das kuaro
08 bab 7 rencana konservasi das kuaro08 bab 7 rencana konservasi das kuaro
08 bab 7 rencana konservasi das kuaro
 
Future Programming Language
Future Programming LanguageFuture Programming Language
Future Programming Language
 
Christian Outfitters
Christian OutfittersChristian Outfitters
Christian Outfitters
 
Nganhang ct tangtoctmdt
Nganhang ct tangtoctmdtNganhang ct tangtoctmdt
Nganhang ct tangtoctmdt
 
Mis 210511
Mis 210511Mis 210511
Mis 210511
 

Similar to Charlotte's stats

Housing Overhang Summary Data
Housing Overhang Summary DataHousing Overhang Summary Data
Housing Overhang Summary Databsucobe
 
Transport And Aging In Black America
Transport And Aging In Black AmericaTransport And Aging In Black America
Transport And Aging In Black Americabgward
 
Senate District 18 Election Results
Senate District 18 Election ResultsSenate District 18 Election Results
Senate District 18 Election ResultsHuey F.
 
Chicagoland Quarterly Supply/Demand Report - 7/1/2011
Chicagoland Quarterly Supply/Demand Report - 7/1/2011Chicagoland Quarterly Supply/Demand Report - 7/1/2011
Chicagoland Quarterly Supply/Demand Report - 7/1/2011chipwags
 
Caída Publicidad EEUU 2009
Caída Publicidad EEUU 2009Caída Publicidad EEUU 2009
Caída Publicidad EEUU 2009Juan Varela
 
Avance de crédito al 31 dic-12
Avance de crédito al 31 dic-12Avance de crédito al 31 dic-12
Avance de crédito al 31 dic-12Sergio Velazco
 
Languages Spoken in the Home — 2009 Breakdown
Languages Spoken in the Home — 2009 BreakdownLanguages Spoken in the Home — 2009 Breakdown
Languages Spoken in the Home — 2009 BreakdownHonolulu Civil Beat
 
H W 2010 Q3 De 12 Mo
H W 2010 Q3 De 12 MoH W 2010 Q3 De 12 Mo
H W 2010 Q3 De 12 Mochipwags
 
Chicago Real Estate Market Data - Broken Down by City
Chicago Real Estate Market Data - Broken Down by CityChicago Real Estate Market Data - Broken Down by City
Chicago Real Estate Market Data - Broken Down by Citybethrepta
 

Similar to Charlotte's stats (20)

Turkish consulate
Turkish consulateTurkish consulate
Turkish consulate
 
Boston's Economy and Demographics 2009-2010
Boston's Economy and Demographics 2009-2010Boston's Economy and Demographics 2009-2010
Boston's Economy and Demographics 2009-2010
 
Housing Overhang Summary Data
Housing Overhang Summary DataHousing Overhang Summary Data
Housing Overhang Summary Data
 
Transport And Aging In Black America
Transport And Aging In Black AmericaTransport And Aging In Black America
Transport And Aging In Black America
 
Travel Time State Rankings
Travel Time State RankingsTravel Time State Rankings
Travel Time State Rankings
 
Demographic and Socio-economic Trends in Boston
Demographic and Socio-economic Trends in BostonDemographic and Socio-economic Trends in Boston
Demographic and Socio-economic Trends in Boston
 
Senate District 18 Election Results
Senate District 18 Election ResultsSenate District 18 Election Results
Senate District 18 Election Results
 
Canada tax sumury 2012
Canada tax sumury 2012Canada tax sumury 2012
Canada tax sumury 2012
 
Chicagoland Quarterly Supply/Demand Report - 7/1/2011
Chicagoland Quarterly Supply/Demand Report - 7/1/2011Chicagoland Quarterly Supply/Demand Report - 7/1/2011
Chicagoland Quarterly Supply/Demand Report - 7/1/2011
 
Caída Publicidad EEUU 2009
Caída Publicidad EEUU 2009Caída Publicidad EEUU 2009
Caída Publicidad EEUU 2009
 
State of the Community for Chapel Hill 2020
State of the Community for Chapel Hill 2020State of the Community for Chapel Hill 2020
State of the Community for Chapel Hill 2020
 
Overview of Boston's Population
Overview of Boston's PopulationOverview of Boston's Population
Overview of Boston's Population
 
Middle Class
Middle ClassMiddle Class
Middle Class
 
Avance de crédito al 31 dic-12
Avance de crédito al 31 dic-12Avance de crédito al 31 dic-12
Avance de crédito al 31 dic-12
 
Languages Spoken in the Home — 2009 Breakdown
Languages Spoken in the Home — 2009 BreakdownLanguages Spoken in the Home — 2009 Breakdown
Languages Spoken in the Home — 2009 Breakdown
 
Departure Time State Rankings
Departure Time State RankingsDeparture Time State Rankings
Departure Time State Rankings
 
H W 2010 Q3 De 12 Mo
H W 2010 Q3 De 12 MoH W 2010 Q3 De 12 Mo
H W 2010 Q3 De 12 Mo
 
2010 State of the Community
2010 State of the Community2010 State of the Community
2010 State of the Community
 
Hawaii Towns Median Rent
Hawaii Towns Median RentHawaii Towns Median Rent
Hawaii Towns Median Rent
 
Chicago Real Estate Market Data - Broken Down by City
Chicago Real Estate Market Data - Broken Down by CityChicago Real Estate Market Data - Broken Down by City
Chicago Real Estate Market Data - Broken Down by City
 

Recently uploaded

Wellbeing inclusion and digital dystopias.pptx
Wellbeing inclusion and digital dystopias.pptxWellbeing inclusion and digital dystopias.pptx
Wellbeing inclusion and digital dystopias.pptxJisc
 
QUATER-1-PE-HEALTH-LC2- this is just a sample of unpacked lesson
QUATER-1-PE-HEALTH-LC2- this is just a sample of unpacked lessonQUATER-1-PE-HEALTH-LC2- this is just a sample of unpacked lesson
QUATER-1-PE-HEALTH-LC2- this is just a sample of unpacked lessonhttgc7rh9c
 
Introduction to TechSoup’s Digital Marketing Services and Use Cases
Introduction to TechSoup’s Digital Marketing  Services and Use CasesIntroduction to TechSoup’s Digital Marketing  Services and Use Cases
Introduction to TechSoup’s Digital Marketing Services and Use CasesTechSoup
 
OSCM Unit 2_Operations Processes & Systems
OSCM Unit 2_Operations Processes & SystemsOSCM Unit 2_Operations Processes & Systems
OSCM Unit 2_Operations Processes & SystemsSandeep D Chaudhary
 
Jamworks pilot and AI at Jisc (20/03/2024)
Jamworks pilot and AI at Jisc (20/03/2024)Jamworks pilot and AI at Jisc (20/03/2024)
Jamworks pilot and AI at Jisc (20/03/2024)Jisc
 
Transparency, Recognition and the role of eSealing - Ildiko Mazar and Koen No...
Transparency, Recognition and the role of eSealing - Ildiko Mazar and Koen No...Transparency, Recognition and the role of eSealing - Ildiko Mazar and Koen No...
Transparency, Recognition and the role of eSealing - Ildiko Mazar and Koen No...EADTU
 
NO1 Top Black Magic Specialist In Lahore Black magic In Pakistan Kala Ilam Ex...
NO1 Top Black Magic Specialist In Lahore Black magic In Pakistan Kala Ilam Ex...NO1 Top Black Magic Specialist In Lahore Black magic In Pakistan Kala Ilam Ex...
NO1 Top Black Magic Specialist In Lahore Black magic In Pakistan Kala Ilam Ex...Amil baba
 
Model Attribute _rec_name in the Odoo 17
Model Attribute _rec_name in the Odoo 17Model Attribute _rec_name in the Odoo 17
Model Attribute _rec_name in the Odoo 17Celine George
 
PANDITA RAMABAI- Indian political thought GENDER.pptx
PANDITA RAMABAI- Indian political thought GENDER.pptxPANDITA RAMABAI- Indian political thought GENDER.pptx
PANDITA RAMABAI- Indian political thought GENDER.pptxakanksha16arora
 
FSB Advising Checklist - Orientation 2024
FSB Advising Checklist - Orientation 2024FSB Advising Checklist - Orientation 2024
FSB Advising Checklist - Orientation 2024Elizabeth Walsh
 
80 ĐỀ THI THỬ TUYỂN SINH TIẾNG ANH VÀO 10 SỞ GD – ĐT THÀNH PHỐ HỒ CHÍ MINH NĂ...
80 ĐỀ THI THỬ TUYỂN SINH TIẾNG ANH VÀO 10 SỞ GD – ĐT THÀNH PHỐ HỒ CHÍ MINH NĂ...80 ĐỀ THI THỬ TUYỂN SINH TIẾNG ANH VÀO 10 SỞ GD – ĐT THÀNH PHỐ HỒ CHÍ MINH NĂ...
80 ĐỀ THI THỬ TUYỂN SINH TIẾNG ANH VÀO 10 SỞ GD – ĐT THÀNH PHỐ HỒ CHÍ MINH NĂ...Nguyen Thanh Tu Collection
 
On National Teacher Day, meet the 2024-25 Kenan Fellows
On National Teacher Day, meet the 2024-25 Kenan FellowsOn National Teacher Day, meet the 2024-25 Kenan Fellows
On National Teacher Day, meet the 2024-25 Kenan FellowsMebane Rash
 
AIM of Education-Teachers Training-2024.ppt
AIM of Education-Teachers Training-2024.pptAIM of Education-Teachers Training-2024.ppt
AIM of Education-Teachers Training-2024.pptNishitharanjan Rout
 
Spellings Wk 4 and Wk 5 for Grade 4 at CAPS
Spellings Wk 4 and Wk 5 for Grade 4 at CAPSSpellings Wk 4 and Wk 5 for Grade 4 at CAPS
Spellings Wk 4 and Wk 5 for Grade 4 at CAPSAnaAcapella
 
How to Add New Custom Addons Path in Odoo 17
How to Add New Custom Addons Path in Odoo 17How to Add New Custom Addons Path in Odoo 17
How to Add New Custom Addons Path in Odoo 17Celine George
 
How to Create and Manage Wizard in Odoo 17
How to Create and Manage Wizard in Odoo 17How to Create and Manage Wizard in Odoo 17
How to Create and Manage Wizard in Odoo 17Celine George
 
Understanding Accommodations and Modifications
Understanding  Accommodations and ModificationsUnderstanding  Accommodations and Modifications
Understanding Accommodations and ModificationsMJDuyan
 
HMCS Max Bernays Pre-Deployment Brief (May 2024).pptx
HMCS Max Bernays Pre-Deployment Brief (May 2024).pptxHMCS Max Bernays Pre-Deployment Brief (May 2024).pptx
HMCS Max Bernays Pre-Deployment Brief (May 2024).pptxEsquimalt MFRC
 
TỔNG ÔN TẬP THI VÀO LỚP 10 MÔN TIẾNG ANH NĂM HỌC 2023 - 2024 CÓ ĐÁP ÁN (NGỮ Â...
TỔNG ÔN TẬP THI VÀO LỚP 10 MÔN TIẾNG ANH NĂM HỌC 2023 - 2024 CÓ ĐÁP ÁN (NGỮ Â...TỔNG ÔN TẬP THI VÀO LỚP 10 MÔN TIẾNG ANH NĂM HỌC 2023 - 2024 CÓ ĐÁP ÁN (NGỮ Â...
TỔNG ÔN TẬP THI VÀO LỚP 10 MÔN TIẾNG ANH NĂM HỌC 2023 - 2024 CÓ ĐÁP ÁN (NGỮ Â...Nguyen Thanh Tu Collection
 

Recently uploaded (20)

Wellbeing inclusion and digital dystopias.pptx
Wellbeing inclusion and digital dystopias.pptxWellbeing inclusion and digital dystopias.pptx
Wellbeing inclusion and digital dystopias.pptx
 
QUATER-1-PE-HEALTH-LC2- this is just a sample of unpacked lesson
QUATER-1-PE-HEALTH-LC2- this is just a sample of unpacked lessonQUATER-1-PE-HEALTH-LC2- this is just a sample of unpacked lesson
QUATER-1-PE-HEALTH-LC2- this is just a sample of unpacked lesson
 
Introduction to TechSoup’s Digital Marketing Services and Use Cases
Introduction to TechSoup’s Digital Marketing  Services and Use CasesIntroduction to TechSoup’s Digital Marketing  Services and Use Cases
Introduction to TechSoup’s Digital Marketing Services and Use Cases
 
OSCM Unit 2_Operations Processes & Systems
OSCM Unit 2_Operations Processes & SystemsOSCM Unit 2_Operations Processes & Systems
OSCM Unit 2_Operations Processes & Systems
 
Jamworks pilot and AI at Jisc (20/03/2024)
Jamworks pilot and AI at Jisc (20/03/2024)Jamworks pilot and AI at Jisc (20/03/2024)
Jamworks pilot and AI at Jisc (20/03/2024)
 
Transparency, Recognition and the role of eSealing - Ildiko Mazar and Koen No...
Transparency, Recognition and the role of eSealing - Ildiko Mazar and Koen No...Transparency, Recognition and the role of eSealing - Ildiko Mazar and Koen No...
Transparency, Recognition and the role of eSealing - Ildiko Mazar and Koen No...
 
NO1 Top Black Magic Specialist In Lahore Black magic In Pakistan Kala Ilam Ex...
NO1 Top Black Magic Specialist In Lahore Black magic In Pakistan Kala Ilam Ex...NO1 Top Black Magic Specialist In Lahore Black magic In Pakistan Kala Ilam Ex...
NO1 Top Black Magic Specialist In Lahore Black magic In Pakistan Kala Ilam Ex...
 
Model Attribute _rec_name in the Odoo 17
Model Attribute _rec_name in the Odoo 17Model Attribute _rec_name in the Odoo 17
Model Attribute _rec_name in the Odoo 17
 
PANDITA RAMABAI- Indian political thought GENDER.pptx
PANDITA RAMABAI- Indian political thought GENDER.pptxPANDITA RAMABAI- Indian political thought GENDER.pptx
PANDITA RAMABAI- Indian political thought GENDER.pptx
 
FSB Advising Checklist - Orientation 2024
FSB Advising Checklist - Orientation 2024FSB Advising Checklist - Orientation 2024
FSB Advising Checklist - Orientation 2024
 
80 ĐỀ THI THỬ TUYỂN SINH TIẾNG ANH VÀO 10 SỞ GD – ĐT THÀNH PHỐ HỒ CHÍ MINH NĂ...
80 ĐỀ THI THỬ TUYỂN SINH TIẾNG ANH VÀO 10 SỞ GD – ĐT THÀNH PHỐ HỒ CHÍ MINH NĂ...80 ĐỀ THI THỬ TUYỂN SINH TIẾNG ANH VÀO 10 SỞ GD – ĐT THÀNH PHỐ HỒ CHÍ MINH NĂ...
80 ĐỀ THI THỬ TUYỂN SINH TIẾNG ANH VÀO 10 SỞ GD – ĐT THÀNH PHỐ HỒ CHÍ MINH NĂ...
 
On National Teacher Day, meet the 2024-25 Kenan Fellows
On National Teacher Day, meet the 2024-25 Kenan FellowsOn National Teacher Day, meet the 2024-25 Kenan Fellows
On National Teacher Day, meet the 2024-25 Kenan Fellows
 
AIM of Education-Teachers Training-2024.ppt
AIM of Education-Teachers Training-2024.pptAIM of Education-Teachers Training-2024.ppt
AIM of Education-Teachers Training-2024.ppt
 
Spellings Wk 4 and Wk 5 for Grade 4 at CAPS
Spellings Wk 4 and Wk 5 for Grade 4 at CAPSSpellings Wk 4 and Wk 5 for Grade 4 at CAPS
Spellings Wk 4 and Wk 5 for Grade 4 at CAPS
 
How to Add New Custom Addons Path in Odoo 17
How to Add New Custom Addons Path in Odoo 17How to Add New Custom Addons Path in Odoo 17
How to Add New Custom Addons Path in Odoo 17
 
How to Create and Manage Wizard in Odoo 17
How to Create and Manage Wizard in Odoo 17How to Create and Manage Wizard in Odoo 17
How to Create and Manage Wizard in Odoo 17
 
Understanding Accommodations and Modifications
Understanding  Accommodations and ModificationsUnderstanding  Accommodations and Modifications
Understanding Accommodations and Modifications
 
Our Environment Class 10 Science Notes pdf
Our Environment Class 10 Science Notes pdfOur Environment Class 10 Science Notes pdf
Our Environment Class 10 Science Notes pdf
 
HMCS Max Bernays Pre-Deployment Brief (May 2024).pptx
HMCS Max Bernays Pre-Deployment Brief (May 2024).pptxHMCS Max Bernays Pre-Deployment Brief (May 2024).pptx
HMCS Max Bernays Pre-Deployment Brief (May 2024).pptx
 
TỔNG ÔN TẬP THI VÀO LỚP 10 MÔN TIẾNG ANH NĂM HỌC 2023 - 2024 CÓ ĐÁP ÁN (NGỮ Â...
TỔNG ÔN TẬP THI VÀO LỚP 10 MÔN TIẾNG ANH NĂM HỌC 2023 - 2024 CÓ ĐÁP ÁN (NGỮ Â...TỔNG ÔN TẬP THI VÀO LỚP 10 MÔN TIẾNG ANH NĂM HỌC 2023 - 2024 CÓ ĐÁP ÁN (NGỮ Â...
TỔNG ÔN TẬP THI VÀO LỚP 10 MÔN TIẾNG ANH NĂM HỌC 2023 - 2024 CÓ ĐÁP ÁN (NGỮ Â...
 

Charlotte's stats

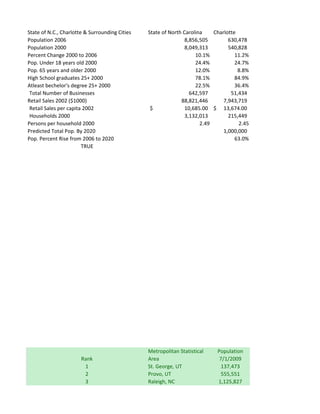
  • 1. State of N.C., Charlotte & Surrounding Cities State of North Carolina Charlotte Population 2006 8,856,505 630,478 Population 2000 8,049,313 540,828 Percent Change 2000 to 2006 10.1% 11.2% Pop. Under 18 years old 2000 24.4% 24.7% Pop. 65 years and older 2000 12.0% 8.8% High School graduates 25+ 2000 78.1% 84.9% Atleast bechelor's degree 25+ 2000 22.5% 36.4% Total Number of Businesses 642,597 51,434 Retail Sales 2002 ($1000) 88,821,446 7,943,719 Retail Sales per capita 2002 $ 10,685.00 $ 13,674.00 Households 2000 3,132,013 215,449 Persons per household 2000 2.49 2.45 Predicted Total Pop. By 2020 1,000,000 Pop. Percent Rise from 2006 to 2020 63.0% TRUE Metropolitan Statistical Population Rank Area 7/1/2009 1 St. George, UT 137,473 2 Provo, UT 555,551 3 Raleigh, NC 1,125,827
  • 2. 4 Greeley, CO 254,759 5 Las Vegas, NV 1,902,834 6 Bend, OR 158,629 7 Austin, TX 1,705,075 8 Gainesville, GA 187,743 9 Phoenix, AZ 4,364,094 10 Myrtle Beach, SC 263,868 11 Fayetteville, AR 464,623 12 Cape Coral, FL 586,908 13 Charlotte, NC 1,745,524 14 Boise City, ID 606,376 15 McAllen, TX 741,152 16 Wilmington, NC 354,525 17 Atlanta, GA 5,475,213 18 Prescott, AZ 215,686 19 Coeur d'Alene, ID 139,390 20 Kennewick, WA 245,649 2010 Population by Age Charlotte, NC Age 0 to 5 9.50% Age 6 to 11 8.02% Age 12 to 17 7.78% Age 18 to 24 10.49% Age 25 to 34 18.88% Age 35 to 44 15.37% Age 45 to 54 14.00% Age 55 to 64 8.46% Age 65 to 74 4.00% Age 75 to 84 2.49% Age 85+ 0.99%
  • 3. Concord Gastonia Hickory Huntersville Kannapolis 62,587 69,904 40,583 38,796 40,223 55,977 66,277 37,222 24,960 36,910 11.1% 3.3% 8.3% 52.3% 8.8% 26.2% 25.0% 23.3% 28.3% 24.2% 11.1% 13.8% 13.6% 6.2% 15.6% 79.2% 72.2% 79.1% 91.6% 69.4% 22.8% 20.2% 28.0% 46.5% 12.0% 4,874 5,039 5,230 2,941 2,453 1,320,135 1,110,179 1,623,223 395,637 366,377 $ 22,578.00 $ 16,372.00 $ 41,107.00 $ 12,947.00 $ 9,642.00 20,962 25,945 15,372 9,171 14,804 2.61 2.50 2.35 2.67 2.46 Population % Change 4/1/00- 4/1/2000 7/1/09 90,354 52.1 376,774 47.4 797,071 41.2
  • 4. 180,926 40.8 1,375,765 38.3 115,367 37.5 1,249,763 36.4 139,277 34.8 3,251,876 34.2 196,629 34.2 347,045 33.9 440,888 33.1 1,330,448 31.2 464,840 30.4 569,463 30.1 274,532 29.1 4,247,981 28.9 167,517 28.8 108,685 28.3 191,822 28.1 North Carolina United States 8.73% 8.84% 7.93% 8.41% 7.98% 8.65% 10.38% 9.94% 14.54% 13.40% 13.79% 13.74% 14.48% 14.32% 11.08% 10.80% 6.00% 6.11% 3.64% 4.04% 1.45% 1.75%
  • 5. Monroe Salisbury Rock Hill, SC Spartanburg, SC Total Average 30,871 28,480 61,620 38,561 1,042,103 104,210 26,228 26,462 49,765 39,673 904,302 90,430 13.9% -0.3% 23.4% -3.3% 12.9% 26.9% 21.8% 25.3% 25.2% 25.1% 10.8% 19.9% 11.3% 15.4% 12.7% 67.6% 75.7% 75.2% 72.4% 76.7% 15.6% 24.1% 24.3% 26.0% 25.6% 2,482 2,317 3,889 3,706 84,365 8,437 774,798 640,973 811,332 891,820 15,878,193 1,587,819 $ 27,390.00 $ 23,048.00 $ 14,774.00 $ 22,684.00 $ 20,421.60 9,029 10,276 18,750 15,989 355,747 35,575 2.83 2.29 2.49 2.33 2.50
  • 6.
  • 7. Max. Min. The Rest of NC 630,478 28,480 7,814,402 540,828 24,960 52.3% -3.3% 28.3% 21.8% 19.9% 6.2% 91.6% 67.6% 46.5% 12.0% 51,434 2,317 7,943,719 366,377 $ 41,107.00 $ 9,642.00 215,449 9,029 2.83 2.29
  • 8. Charlotte's Pop. to NC's Pop. The Rest of NC 93% Charlotte 7%
  • 9. Charlotte & Surrounding Areas The Rest of N.C. 88% Charlotte 7% Charlotte Concord Gastonia Hickory Huntersville Kannapolis Monroe Salisbury Rock Hill, SC Spartanburg, SC The Rest of NC
  • 10. Age 85+ Age 75 to 84 Age 65 to 74 Age 55 to 64 Age 45 to 54 Age 35 to 44 United States Age 25 to 34 North Carolina Charlotte Age 18 to 24 Age 12 to 17 Age 6 to 11 Age 0 to 5 2010 Population by Age 0 0.02 0.04 0.06 0.08 0.1 0.12 0.14 0.16 0.18 0.2
  • 12. Los Angeles, CA San Francisco, CA District of Columbia Atlanta, GA Honolulu, HA 3,849,378 744,041 599,657 486,411 377,357 3,694,820 776,733 572,055 416,474 371,657 4.2% -4.2% 4.8% 16.8% 1.5% 7.7% 4.1% 6.2% 6.4% 5.1% 26.6% 14.5% 19.0% 22.3% 19.2% 9.7% 13.7% 11.7% 9.7% 17.8% 40.9% 36.8% 12.9% 6.6% 25.3% 66.6% 81.2% 77.8% 76.9% 83.4% 25.5% 45.0% 39.1% 34.6% 31.1% 395,667 91,873 47,172 43,576 38,221 30,196,646.00 8,883,316.00 4,732,270.00 5,375,770.00 $ 7,976.00 $ 11,658.00 $ 10,670.00 $ 14,359.00 1,275,412 329,700 248,338 168,147 140,337 2.83 2.3 2.2 2.3 2.6 469.0 46.0 61.4 131.0 85.0 7,876.90 16,636.0 9,378.0 3,161.10 4,336.70
  • 13. Wichita, KS Baltimore, MD Memphis, TN Dallas, TX Totals Average Max. 357,698 631,366 670,902 1,232,940 8,949,750 964,601 3,849,378 344,284 651,154 650,100 1,188,580 8,665,857 934,660 3,694,820 1.8% -3.0% -1.8% 3.7% 2.51% 16.80% 8.0% 6.4% 7.8% 8.3% 6.46% 8.30% 27.1% 24.8% 27.9% 26.6% 22.68% 27.90% 11.9% 13.2% 10.9% 8.6% 12.33% 17.80% 8.1% 4.6% 4.0% 24.4% 17.40% 40.90% 83.8% 68.4% 76.4% 70.4% 76.81% 83.80% 25.3% 19.1% 20.9% 27.7% 30.08% 45.00% 139,087 257,996 250,721 451,833 3,261,571 351,217 1,275,412 2.44 2.42 2.52 2.58 135.0 80.0 279.0 342.0 1628.4 16080.00% 469 2,536.20 8,058.80 2327.4 3469.9
  • 14. Min. 357,698 344,284 -4.20% 4.10% 14.50% 9.70% 4.00% 66.60% 19.10% 139,087 46