SlideShare a Scribd company logo
1 of 2
Download to read offline
Geography      WORKERS 16       Percent   Rank   Percent     Rank     Percent   Rank
               YEARS AND OVER longer than        longer than          longer than
                 WHO DID NOT     30 minutes      45 minutes           60 minutes
                WORK AT HOME
Maryland               2,709,344   48.6%      1     25.1%       2       13.7%      2
New York               8,520,452   47.3%      2     26.3%       1       16.3%      1
New Jersey             3,962,961   43.5%      3     22.9%       3       13.5%      3
Illinois               5,728,106   42.5%      4     21.1%       4       11.2%      4
Massachusetts          3,080,778   41.0%      5     19.1%       5        9.7%      6
Hawaii                   602,361   40.0%      6     16.6%       9        7.8%     13
Georgia                4,098,222   39.3%      7     18.5%       6        9.4%      7
California            15,401,306   39.1%      8     17.9%       7       10.0%      5
Virginia               3,636,900   38.7%      9     17.8%       8        9.2%      8
Florida                7,721,968   38.5%     10     15.3%       14       7.1%     16
Arizona                2,627,542   36.8%     11     14.2%       17       6.5%     20
Washington             2,902,910   35.5%     12     15.5%       13       7.9%     12
New Hampshire            648,620   35.3%     13     16.4%       10       8.5%     10
Texas                 10,294,468   35.2%     14     14.7%       15       7.1%     17
Pennsylvania           5,557,865   34.8%     15     15.7%       12       7.9%     11
Colorado               2,271,439   33.1%     16     13.5%       19       6.0%     21
West Virginia            719,206   32.8%     17     16.3%       11       9.0%      9
Louisiana              1,848,573   32.5%     18     14.4%       16       7.7%     14
Tennessee              2,655,433   32.3%     19     12.4%       25       5.4%     28
Connecticut            1,636,724   32.1%     20     13.8%       18       7.5%     15
Alabama                1,929,854   32.0%     21     12.7%       22       5.8%     25
Nevada                 1,166,791   31.9%     22     10.3%       36       5.2%     33
Michigan               4,205,939   31.6%     23     12.8%       21       5.8%     24
Missouri               2,642,783   31.3%     24     11.6%       29       5.0%     35
Delaware                 393,374   31.0%     25     12.9%       20       6.7%     18
Mississippi            1,164,086   30.7%     26     12.6%       23       6.5%     19
South Carolina         1,884,406   30.7%     27     11.7%       27       5.0%     34
North Carolina         3,980,152   30.3%     28     11.7%       28       5.3%     30
Maine                    608,794   29.6%     29     12.5%       24       5.9%     22
Rhode Island             491,782   29.4%     30     11.8%       26       5.7%     26
Indiana                2,836,249   28.9%     31     11.4%       30       5.4%     27
Minnesota              2,540,378   28.9%     32     11.0%       32       4.8%     36
Ohio                   5,111,011   28.6%     33     10.3%       37       4.7%     38
Geography      WORKERS 16      Percent   Rank   Percent     Rank     Percent   Rank
               YEARS AND OVER longer than       longer than          longer than
                 WHO DID NOT    30 minutes      45 minutes           60 minutes
                WORK AT HOME
Oregon                1,620,166   28.3%     34     11.1%       31      5.3%      29
Kentucky              1,782,175   28.2%     35     10.9%       33      5.3%      31
Vermont                 300,664   27.6%     36     10.9%       34      4.8%      37
New Mexico              819,145   27.0%     37     10.9%       35      5.2%      32
Arkansas              1,183,431   25.8%     38     9.8%        38      4.6%      40
Wisconsin             2,703,294   25.3%     39     9.5%        39      4.4%      42
Utah                  1,170,647   25.3%     40     9.3%        40      4.4%      41
Oklahoma              1,566,363   23.9%     41     8.8%        43      4.2%      44
Idaho                   644,578   22.6%     42     9.3%        41      4.7%      39
Kansas                1,316,241   19.9%     43     6.8%        47      3.2%      48
Iowa                  1,439,242   19.2%     44     7.0%        46      3.3%      47
Wyoming                 255,593   17.3%     45     9.2%        42      5.9%      23
Nebraska                866,738   17.2%     46     5.8%        50      2.8%      50
Alaska                  310,642   16.5%     47     7.3%        44      4.3%      43
Montana                 431,468   16.5%     48     7.0%        45      3.9%      45
South Dakota            382,087   14.8%     49     5.9%        49      3.0%      49
North Dakota            319,206   13.4%     50     6.0%        48      3.6%      46

More Related Content

What's hot

D3wbb stat data
D3wbb stat dataD3wbb stat data
D3wbb stat dataCoryHogue2
 
D3mbb stat data
D3mbb stat dataD3mbb stat data
D3mbb stat dataCoryHogue2
 
How Raila and Kalonzo Could Win in The First Round
How Raila and Kalonzo Could Win in The First RoundHow Raila and Kalonzo Could Win in The First Round
How Raila and Kalonzo Could Win in The First RoundMAKODINGO
 
Resultado fluxodata
Resultado fluxodataResultado fluxodata
Resultado fluxodatajosey2
 
The Geographic Adoption of Commercial & Industrial Building Smart Meters in t...
The Geographic Adoption of Commercial & Industrial Building Smart Meters in t...The Geographic Adoption of Commercial & Industrial Building Smart Meters in t...
The Geographic Adoption of Commercial & Industrial Building Smart Meters in t...Urjanet
 
Biweekly Financial Commentary 09 08 17
Biweekly  Financial  Commentary 09 08 17Biweekly  Financial  Commentary 09 08 17
Biweekly Financial Commentary 09 08 17Ant Wong
 
Enriquillo Colectivos 2009 Serie Regular
Enriquillo Colectivos 2009 Serie RegularEnriquillo Colectivos 2009 Serie Regular
Enriquillo Colectivos 2009 Serie RegularAlberty Moronta
 
Languages Spoken in the Home — 2009 Breakdown
Languages Spoken in the Home — 2009 BreakdownLanguages Spoken in the Home — 2009 Breakdown
Languages Spoken in the Home — 2009 BreakdownHonolulu Civil Beat
 
2021 대한민국 소셜 미디어 벤치마크 리포트_주요 산업군 성과 분석 [SM2Networks]
2021 대한민국 소셜 미디어 벤치마크 리포트_주요 산업군 성과 분석 [SM2Networks]2021 대한민국 소셜 미디어 벤치마크 리포트_주요 산업군 성과 분석 [SM2Networks]
2021 대한민국 소셜 미디어 벤치마크 리포트_주요 산업군 성과 분석 [SM2Networks]에스엠투네트웍스 마케팅인텔리전스팀
 

What's hot (13)

D3wbb stat data
D3wbb stat dataD3wbb stat data
D3wbb stat data
 
D3mbb stat data
D3mbb stat dataD3mbb stat data
D3mbb stat data
 
Oahu Census Tracts
Oahu Census TractsOahu Census Tracts
Oahu Census Tracts
 
PRESIDENTIAL POLL
PRESIDENTIAL POLLPRESIDENTIAL POLL
PRESIDENTIAL POLL
 
Sanhuu udirdlaga
Sanhuu udirdlagaSanhuu udirdlaga
Sanhuu udirdlaga
 
Afc prevalence 06_table13
Afc prevalence 06_table13Afc prevalence 06_table13
Afc prevalence 06_table13
 
How Raila and Kalonzo Could Win in The First Round
How Raila and Kalonzo Could Win in The First RoundHow Raila and Kalonzo Could Win in The First Round
How Raila and Kalonzo Could Win in The First Round
 
Resultado fluxodata
Resultado fluxodataResultado fluxodata
Resultado fluxodata
 
The Geographic Adoption of Commercial & Industrial Building Smart Meters in t...
The Geographic Adoption of Commercial & Industrial Building Smart Meters in t...The Geographic Adoption of Commercial & Industrial Building Smart Meters in t...
The Geographic Adoption of Commercial & Industrial Building Smart Meters in t...
 
Biweekly Financial Commentary 09 08 17
Biweekly  Financial  Commentary 09 08 17Biweekly  Financial  Commentary 09 08 17
Biweekly Financial Commentary 09 08 17
 
Enriquillo Colectivos 2009 Serie Regular
Enriquillo Colectivos 2009 Serie RegularEnriquillo Colectivos 2009 Serie Regular
Enriquillo Colectivos 2009 Serie Regular
 
Languages Spoken in the Home — 2009 Breakdown
Languages Spoken in the Home — 2009 BreakdownLanguages Spoken in the Home — 2009 Breakdown
Languages Spoken in the Home — 2009 Breakdown
 
2021 대한민국 소셜 미디어 벤치마크 리포트_주요 산업군 성과 분석 [SM2Networks]
2021 대한민국 소셜 미디어 벤치마크 리포트_주요 산업군 성과 분석 [SM2Networks]2021 대한민국 소셜 미디어 벤치마크 리포트_주요 산업군 성과 분석 [SM2Networks]
2021 대한민국 소셜 미디어 벤치마크 리포트_주요 산업군 성과 분석 [SM2Networks]
 

Similar to Travel Time State Rankings

States Sorted by High School Grad
States Sorted by High School GradStates Sorted by High School Grad
States Sorted by High School GradHonolulu Civil Beat
 
State bridge rankings
State bridge rankingsState bridge rankings
State bridge rankingsartba
 
Uninsured0 138new
Uninsured0 138newUninsured0 138new
Uninsured0 138newsoder145
 
Coronavirus cases by state - projections for growther from 03-21-2020 to 04-...
Coronavirus cases by state  - projections for growther from 03-21-2020 to 04-...Coronavirus cases by state  - projections for growther from 03-21-2020 to 04-...
Coronavirus cases by state - projections for growther from 03-21-2020 to 04-...James Orr
 
Avance crediticio al 03 jun 12
Avance crediticio al 03 jun 12Avance crediticio al 03 jun 12
Avance crediticio al 03 jun 12Sergio Velazco
 
Avance de Crédito Infonavit al 27 may 12
Avance de Crédito Infonavit al 27 may 12Avance de Crédito Infonavit al 27 may 12
Avance de Crédito Infonavit al 27 may 12Sergio Velazco
 
Table 10, us hunger & poverty by state
Table 10, us hunger & poverty by stateTable 10, us hunger & poverty by state
Table 10, us hunger & poverty by stateBread for the World
 
Towns Ranked by High School Grad
Towns Ranked by High School GradTowns Ranked by High School Grad
Towns Ranked by High School GradHonolulu Civil Beat
 
Avance crediticio al 24 junio 2012
Avance crediticio al 24 junio 2012Avance crediticio al 24 junio 2012
Avance crediticio al 24 junio 2012Sergio Velazco
 
10-Year Changes — Housing Occupancy
10-Year Changes — Housing Occupancy10-Year Changes — Housing Occupancy
10-Year Changes — Housing OccupancyHonolulu Civil Beat
 

Similar to Travel Time State Rankings (20)

States Sorted by High School Grad
States Sorted by High School GradStates Sorted by High School Grad
States Sorted by High School Grad
 
State Rankings 2009
State Rankings 2009State Rankings 2009
State Rankings 2009
 
U.S. States Median Rent
U.S. States Median RentU.S. States Median Rent
U.S. States Median Rent
 
Turkish consulate
Turkish consulateTurkish consulate
Turkish consulate
 
Home Value State Rankings
Home Value State RankingsHome Value State Rankings
Home Value State Rankings
 
Heart Disease
Heart DiseaseHeart Disease
Heart Disease
 
State bridge rankings
State bridge rankingsState bridge rankings
State bridge rankings
 
State-by-State Comparison
State-by-State ComparisonState-by-State Comparison
State-by-State Comparison
 
Uninsured0 138new
Uninsured0 138newUninsured0 138new
Uninsured0 138new
 
Coronavirus cases by state - projections for growther from 03-21-2020 to 04-...
Coronavirus cases by state  - projections for growther from 03-21-2020 to 04-...Coronavirus cases by state  - projections for growther from 03-21-2020 to 04-...
Coronavirus cases by state - projections for growther from 03-21-2020 to 04-...
 
States — Place of Birth
States — Place of BirthStates — Place of Birth
States — Place of Birth
 
Charlotte's stats
Charlotte's statsCharlotte's stats
Charlotte's stats
 
State Transportation Rankings
State Transportation RankingsState Transportation Rankings
State Transportation Rankings
 
Avance crediticio al 03 jun 12
Avance crediticio al 03 jun 12Avance crediticio al 03 jun 12
Avance crediticio al 03 jun 12
 
Avance de Crédito Infonavit al 27 may 12
Avance de Crédito Infonavit al 27 may 12Avance de Crédito Infonavit al 27 may 12
Avance de Crédito Infonavit al 27 may 12
 
Race Breakdown 2009
Race Breakdown 2009Race Breakdown 2009
Race Breakdown 2009
 
Table 10, us hunger & poverty by state
Table 10, us hunger & poverty by stateTable 10, us hunger & poverty by state
Table 10, us hunger & poverty by state
 
Towns Ranked by High School Grad
Towns Ranked by High School GradTowns Ranked by High School Grad
Towns Ranked by High School Grad
 
Avance crediticio al 24 junio 2012
Avance crediticio al 24 junio 2012Avance crediticio al 24 junio 2012
Avance crediticio al 24 junio 2012
 
10-Year Changes — Housing Occupancy
10-Year Changes — Housing Occupancy10-Year Changes — Housing Occupancy
10-Year Changes — Housing Occupancy
 

More from Honolulu Civil Beat

Gov. David Ige response to U.S. Rep. Anna Eshoo
Gov. David Ige response to U.S. Rep. Anna EshooGov. David Ige response to U.S. Rep. Anna Eshoo
Gov. David Ige response to U.S. Rep. Anna EshooHonolulu Civil Beat
 
Audit of the Department of the Honolulu Prosecuting Attorney’s Policies, Proc...
Audit of the Department of the Honolulu Prosecuting Attorney’s Policies, Proc...Audit of the Department of the Honolulu Prosecuting Attorney’s Policies, Proc...
Audit of the Department of the Honolulu Prosecuting Attorney’s Policies, Proc...Honolulu Civil Beat
 
Audit of the Honolulu Police Department’s Policies, Procedures, and Controls
Audit of the Honolulu Police Department’s Policies, Procedures, and ControlsAudit of the Honolulu Police Department’s Policies, Procedures, and Controls
Audit of the Honolulu Police Department’s Policies, Procedures, and ControlsHonolulu Civil Beat
 
2019 Use of Force Annual Report HPD
2019 Use of Force Annual Report HPD 2019 Use of Force Annual Report HPD
2019 Use of Force Annual Report HPD Honolulu Civil Beat
 
Office of Health Equity Goals Draft 10
Office of Health Equity Goals Draft 10Office of Health Equity Goals Draft 10
Office of Health Equity Goals Draft 10Honolulu Civil Beat
 
ACLU Letter to HPD regarding racial profiling
ACLU Letter to HPD regarding racial profilingACLU Letter to HPD regarding racial profiling
ACLU Letter to HPD regarding racial profilingHonolulu Civil Beat
 
ACLU Letter to HPD regarding racial profiling
ACLU Letter to HPD regarding racial profilingACLU Letter to HPD regarding racial profiling
ACLU Letter to HPD regarding racial profilingHonolulu Civil Beat
 
Guam Governor's Letter to Pence
Guam Governor's Letter to Pence Guam Governor's Letter to Pence
Guam Governor's Letter to Pence Honolulu Civil Beat
 
List Of Pro Bono Legal Service Providers
List Of Pro Bono Legal Service ProvidersList Of Pro Bono Legal Service Providers
List Of Pro Bono Legal Service ProvidersHonolulu Civil Beat
 
Arbitration Hearing Transcript December 2018
Arbitration Hearing Transcript December 2018Arbitration Hearing Transcript December 2018
Arbitration Hearing Transcript December 2018Honolulu Civil Beat
 

More from Honolulu Civil Beat (20)

Gov. David Ige response to U.S. Rep. Anna Eshoo
Gov. David Ige response to U.S. Rep. Anna EshooGov. David Ige response to U.S. Rep. Anna Eshoo
Gov. David Ige response to U.S. Rep. Anna Eshoo
 
Audit of the Department of the Honolulu Prosecuting Attorney’s Policies, Proc...
Audit of the Department of the Honolulu Prosecuting Attorney’s Policies, Proc...Audit of the Department of the Honolulu Prosecuting Attorney’s Policies, Proc...
Audit of the Department of the Honolulu Prosecuting Attorney’s Policies, Proc...
 
Audit of the Honolulu Police Department’s Policies, Procedures, and Controls
Audit of the Honolulu Police Department’s Policies, Procedures, and ControlsAudit of the Honolulu Police Department’s Policies, Procedures, and Controls
Audit of the Honolulu Police Department’s Policies, Procedures, and Controls
 
2019 Use of Force Annual Report HPD
2019 Use of Force Annual Report HPD 2019 Use of Force Annual Report HPD
2019 Use of Force Annual Report HPD
 
Office of Health Equity Goals Draft 10
Office of Health Equity Goals Draft 10Office of Health Equity Goals Draft 10
Office of Health Equity Goals Draft 10
 
NHPI COVID-19 Statement
NHPI COVID-19 StatementNHPI COVID-19 Statement
NHPI COVID-19 Statement
 
DLIR Response Language Access
DLIR Response Language AccessDLIR Response Language Access
DLIR Response Language Access
 
Language Access Letter To DLIR
Language Access Letter To DLIRLanguage Access Letter To DLIR
Language Access Letter To DLIR
 
ACLU Letter to HPD regarding racial profiling
ACLU Letter to HPD regarding racial profilingACLU Letter to HPD regarding racial profiling
ACLU Letter to HPD regarding racial profiling
 
ACLU Letter to HPD regarding racial profiling
ACLU Letter to HPD regarding racial profilingACLU Letter to HPD regarding racial profiling
ACLU Letter to HPD regarding racial profiling
 
Jane Doe v. Rehab Hospital
Jane Doe v. Rehab HospitalJane Doe v. Rehab Hospital
Jane Doe v. Rehab Hospital
 
Coronavirus HPHA
Coronavirus HPHA Coronavirus HPHA
Coronavirus HPHA
 
OHA Data Request
OHA Data RequestOHA Data Request
OHA Data Request
 
Letter from Palau to Guam
Letter from Palau to GuamLetter from Palau to Guam
Letter from Palau to Guam
 
Guam Governor's Letter to Pence
Guam Governor's Letter to Pence Guam Governor's Letter to Pence
Guam Governor's Letter to Pence
 
OHA Analysis by Akina
OHA Analysis by AkinaOHA Analysis by Akina
OHA Analysis by Akina
 
Case COFA Letter
Case COFA LetterCase COFA Letter
Case COFA Letter
 
List Of Pro Bono Legal Service Providers
List Of Pro Bono Legal Service ProvidersList Of Pro Bono Legal Service Providers
List Of Pro Bono Legal Service Providers
 
Arbitration Hearing Transcript December 2018
Arbitration Hearing Transcript December 2018Arbitration Hearing Transcript December 2018
Arbitration Hearing Transcript December 2018
 
Caldwell Press Release
Caldwell Press ReleaseCaldwell Press Release
Caldwell Press Release
 

Travel Time State Rankings

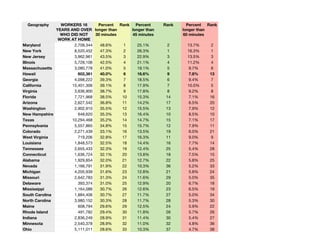
  • 1. Geography WORKERS 16 Percent Rank Percent Rank Percent Rank YEARS AND OVER longer than longer than longer than WHO DID NOT 30 minutes 45 minutes 60 minutes WORK AT HOME Maryland 2,709,344 48.6% 1 25.1% 2 13.7% 2 New York 8,520,452 47.3% 2 26.3% 1 16.3% 1 New Jersey 3,962,961 43.5% 3 22.9% 3 13.5% 3 Illinois 5,728,106 42.5% 4 21.1% 4 11.2% 4 Massachusetts 3,080,778 41.0% 5 19.1% 5 9.7% 6 Hawaii 602,361 40.0% 6 16.6% 9 7.8% 13 Georgia 4,098,222 39.3% 7 18.5% 6 9.4% 7 California 15,401,306 39.1% 8 17.9% 7 10.0% 5 Virginia 3,636,900 38.7% 9 17.8% 8 9.2% 8 Florida 7,721,968 38.5% 10 15.3% 14 7.1% 16 Arizona 2,627,542 36.8% 11 14.2% 17 6.5% 20 Washington 2,902,910 35.5% 12 15.5% 13 7.9% 12 New Hampshire 648,620 35.3% 13 16.4% 10 8.5% 10 Texas 10,294,468 35.2% 14 14.7% 15 7.1% 17 Pennsylvania 5,557,865 34.8% 15 15.7% 12 7.9% 11 Colorado 2,271,439 33.1% 16 13.5% 19 6.0% 21 West Virginia 719,206 32.8% 17 16.3% 11 9.0% 9 Louisiana 1,848,573 32.5% 18 14.4% 16 7.7% 14 Tennessee 2,655,433 32.3% 19 12.4% 25 5.4% 28 Connecticut 1,636,724 32.1% 20 13.8% 18 7.5% 15 Alabama 1,929,854 32.0% 21 12.7% 22 5.8% 25 Nevada 1,166,791 31.9% 22 10.3% 36 5.2% 33 Michigan 4,205,939 31.6% 23 12.8% 21 5.8% 24 Missouri 2,642,783 31.3% 24 11.6% 29 5.0% 35 Delaware 393,374 31.0% 25 12.9% 20 6.7% 18 Mississippi 1,164,086 30.7% 26 12.6% 23 6.5% 19 South Carolina 1,884,406 30.7% 27 11.7% 27 5.0% 34 North Carolina 3,980,152 30.3% 28 11.7% 28 5.3% 30 Maine 608,794 29.6% 29 12.5% 24 5.9% 22 Rhode Island 491,782 29.4% 30 11.8% 26 5.7% 26 Indiana 2,836,249 28.9% 31 11.4% 30 5.4% 27 Minnesota 2,540,378 28.9% 32 11.0% 32 4.8% 36 Ohio 5,111,011 28.6% 33 10.3% 37 4.7% 38
  • 2. Geography WORKERS 16 Percent Rank Percent Rank Percent Rank YEARS AND OVER longer than longer than longer than WHO DID NOT 30 minutes 45 minutes 60 minutes WORK AT HOME Oregon 1,620,166 28.3% 34 11.1% 31 5.3% 29 Kentucky 1,782,175 28.2% 35 10.9% 33 5.3% 31 Vermont 300,664 27.6% 36 10.9% 34 4.8% 37 New Mexico 819,145 27.0% 37 10.9% 35 5.2% 32 Arkansas 1,183,431 25.8% 38 9.8% 38 4.6% 40 Wisconsin 2,703,294 25.3% 39 9.5% 39 4.4% 42 Utah 1,170,647 25.3% 40 9.3% 40 4.4% 41 Oklahoma 1,566,363 23.9% 41 8.8% 43 4.2% 44 Idaho 644,578 22.6% 42 9.3% 41 4.7% 39 Kansas 1,316,241 19.9% 43 6.8% 47 3.2% 48 Iowa 1,439,242 19.2% 44 7.0% 46 3.3% 47 Wyoming 255,593 17.3% 45 9.2% 42 5.9% 23 Nebraska 866,738 17.2% 46 5.8% 50 2.8% 50 Alaska 310,642 16.5% 47 7.3% 44 4.3% 43 Montana 431,468 16.5% 48 7.0% 45 3.9% 45 South Dakota 382,087 14.8% 49 5.9% 49 3.0% 49 North Dakota 319,206 13.4% 50 6.0% 48 3.6% 46