SlideShare a Scribd company logo
1 of 6
Download to read offline
Geography      Total    Percent Percent Percent   Percent Percent     Percent   Percent Percent Percent
                  Population   Only Chinese English Japanese English        Korean     English Tagalog English
                      5+      English         very well         very well             very well        very well
United States     280,601,189 80.4%    0.9%    44.9%     0.2%    54.3%       0.4%      42.3%    0.5%    68.3%
California         33,608,542 57.8%    2.8%    43.8%     0.4%    51.0%       1.0%      38.5%    2.1%    67.2%
New Mexico          1,819,290 64.1%    0.3%    54.8%     0.1%    59.8%       0.1%      47.2%    0.1%    73.1%
Texas              21,826,536 66.4%    0.5%    51.1%     0.1%    61.5%       0.2%      45.3%    0.3%    74.0%
New York           18,202,862 71.5%    2.5%    36.0%     0.2%    46.0%       0.6%      40.7%    0.4%    70.6%
Arizona             5,823,602 72.1%    0.4%    50.1%     0.1%    60.7%       0.2%      49.6%    0.3%    71.8%
New Jersey          8,088,754 72.4%    1.2%    53.9%     0.1%    44.7%       0.9%      43.9%    0.9%    74.4%
Nevada              2,350,169 72.5%    0.8%    43.1%     0.3%    62.0%       0.3%      44.5%    2.3%    67.2%
Florida            17,076,753 74.2%    0.3%    45.4%     0.1%    59.1%       0.1%      47.6%    0.3%    70.3%
Hawaii              1,193,966 75.6%    2.4%    44.5%     4.0%    55.1%       1.4%      35.0%    4.3%    51.4%
Illinois           11,894,213 78.7%    0.7%    49.1%     0.1%    51.7%       0.4%      44.3%    0.6%    71.4%
Rhode Island          996,110 79.5%    0.4%    46.6%     0.1%    80.3%       0.1%      46.2%    0.2%    59.8%
Massachusetts       6,125,623 79.6%    1.5%    49.9%     0.1%    57.4%       0.2%      52.0%    0.1%    68.1%
Connecticut         3,281,983 80.3%    0.7%    54.5%     0.1%    59.2%       0.2%      42.6%    0.2%    72.7%
Colorado            4,490,892 83.4%    0.4%    52.1%     0.1%    59.0%       0.3%      46.6%    0.2%    70.8%
Washington          6,034,522 83.5%    1.1%    45.3%     0.4%    60.3%       0.8%      42.8%    0.8%    62.2%
Alaska                631,112 84.5%    0.2%    45.6%     0.2%    60.0%       0.6%      31.9%    2.0%    45.3%
Maryland            5,260,978 85.1%    1.0%    50.4%     0.1%    54.7%       0.7%      44.2%    0.4%    72.0%
Oregon              3,488,584 86.0%    0.6%    47.3%     0.3%    66.4%       0.3%      43.2%    0.2%    71.1%
Utah                2,392,212 86.2%    0.4%    53.9%     0.2%    71.2%       0.2%      49.6%    0.2%    77.1%
Virginia            7,200,451 86.8%    0.6%    53.6%     0.1%    61.4%       0.7%      42.8%    0.5%    70.9%
Georgia             8,769,170 88.0%    0.4%    51.3%     0.1%    59.9%       0.4%      45.0%    0.1%    74.8%
Delaware              805,530 88.4%    0.6%    56.0%     0.1%    75.1%       0.2%      47.8%    0.3%    76.3%
Idaho               1,373,794 90.0%    0.1%    48.3%     0.1%    68.5%       0.1%      42.4%    0.1%    79.1%
Kansas              2,579,136 90.1%    0.3%    43.4%     0.1%    59.6%       0.1%      45.9%    0.1%    74.7%
Minnesota           4,832,343 90.4%    0.3%    53.2%     0.1%    59.1%       0.1%      46.9%    0.1%    67.6%
North Carolina      8,410,929 90.4%    0.3%    53.0%     0.1%    56.1%       0.2%      53.5%    0.1%    77.4%
Pennsylvania       11,776,390 90.6%    0.5%    43.6%     0.1%    66.2%       0.2%      45.0%    0.1%    72.9%
Nebraska            1,641,516 90.8%    0.2%    47.0%     0.1%    64.5%       0.1%      50.5%    0.1%    78.0%
Michigan            9,406,371 91.0%    0.4%    52.3%     0.1%    43.9%       0.2%      46.2%    0.1%    75.3%
Oklahoma            3,349,937 91.6%    0.2%    47.9%     0.1%    55.4%       0.1%      55.1%    0.1%    72.3%
Louisiana           4,101,780 91.6%    0.2%    47.9%     0.0%    58.5%       0.1%      57.3%    0.1%    72.6%
Wisconsin           5,242,539 91.8%    0.2%    48.7%     0.0%    70.7%       0.1%      53.9%    0.1%    68.8%
Geography       Total    Percent Percent Percent   Percent Percent     Percent   Percent Percent Percent
                   Population   Only Chinese English Japanese English        Korean     English Tagalog English
                       5+      English         very well         very well             very well        very well
New Hampshire        1,239,553 91.9%    0.4%    50.8%     0.0%     69.4%      0.1%      30.6%     0.1%   82.9%
Maine                1,245,544 92.6%    0.2%    54.7%     0.1%     78.5%      0.1%      55.2%     0.1%   68.0%
Indiana              5,901,195 92.6%    0.3%    49.3%     0.1%     54.2%      0.1%      42.9%     0.1%   70.1%
Iowa                 2,781,968 93.6%    0.2%    53.8%     0.1%     60.6%      0.1%      34.4%     0.1%   79.8%
South Dakota           740,226 93.6%    0.1%    41.8%     0.0%     51.7%      0.0%      55.9%     0.1%   55.8%
Wyoming                487,996 93.6%    0.1%    53.4%     0.1%     77.2%      0.0%      58.1%     0.1%   64.6%
Arkansas             2,639,351 93.7%    0.1%    43.5%     0.0%     55.3%      0.1%      59.9%     0.1%   69.3%
South Carolina       4,119,061 93.8%    0.2%    45.6%     0.1%     55.0%      0.1%      46.8%     0.2%   71.9%
Ohio                10,770,578 93.9%    0.3%    48.1%     0.1%     46.3%      0.1%      45.6%     0.1%   73.6%
Tennessee            5,746,256 94.1%    0.2%    47.9%     0.1%     54.7%      0.1%      41.3%     0.1%   78.5%
Missouri             5,508,991 94.3%    0.2%    46.7%     0.0%     57.1%      0.1%      41.0%     0.1%   70.7%
North Dakota           599,081 94.6%    0.2%    45.1%     0.0%     71.6%      0.0%      68.6%     0.1%   52.0%
Vermont                587,888 94.9%    0.2%    50.8%     0.1%     66.7%      0.1%      61.1%     0.0%   68.8%
Montana                896,887 95.3%    0.1%    40.9%     0.1%     55.8%      0.1%      40.4%     0.1%   57.3%
Alabama              4,325,565 95.6%    0.2%    50.3%     0.1%     46.4%      0.1%      49.6%     0.0%   74.6%
Kentucky             3,968,808 95.6%    0.2%    45.3%     0.1%     42.0%      0.1%      52.4%     0.1%   76.0%
Mississippi          2,707,018 96.4%    0.1%    43.4%     0.1%     78.0%      0.1%      43.1%     0.1%   64.4%
West Virginia        1,706,010 97.7%    0.1%    53.0%     0.1%     46.6%      0.0%      64.2%     0.1%   77.5%
Hawaii County          161,367 81.9%    0.3%    66.4%     2.6%     59.8%      0.4%      21.7%     1.5%   51.7%
Honolulu County        840,660 73.3%    3.2%    43.9%     4.7%     53.8%      1.9%      35.5%     4.9%   52.0%
Kauai County            59,160 81.5%    0.6%    40.6%     2.2%     71.4%      0.0%      31.0%     4.1%   42.0%
Maui County            132,701 79.7%    0.6%    50.1%     1.6%     59.9%      0.5%      37.0%     4.0%   50.8%
Pahoa                      696 44.7%    0.0%              4.0%     42.9%      0.0%                3.3%   39.1%
Kaumakani                  604 45.2%    0.0%              6.0%     83.3%      0.0%               12.9%   39.7%
Waipahu                 33,650 49.6%    0.2%    20.6%     2.5%     45.0%      0.6%      10.7%    17.7%   37.0%
Ewa Villages             5,075 57.9%    0.0%              3.0%     40.8%      0.0%               10.8%   37.1%
Whitmore Village         3,494 59.8%    0.0%              0.7%    100.0%      0.0%               16.7%   45.9%
Kahului                 20,794 63.1%    0.4%    14.6%     2.6%     59.1%      1.1%      24.0%    10.2%   56.4%
Honokaa                  2,492 63.6%    0.0%              2.2%     63.0%      0.0%                4.7%   24.1%
Pakala Village             322 64.6%    0.0%              4.0%    100.0%      0.0%                4.0%   69.2%
Kilauea                  2,343 66.2%    0.0%              4.1%     89.7%      0.0%                2.3%   13.2%
Honolulu               354,931 66.4%    6.3%    41.9%     7.4%     50.7%      3.3%      33.4%     4.6%   53.6%
Lahaina                  9,544 67.0%    0.2%    25.0%     1.7%     61.8%      0.6%      14.5%     5.1%   39.2%
Geography            Total    Percent Percent Percent   Percent Percent     Percent   Percent Percent Percent
                         Population  Only Chinese English Japanese English        Korean     English Tagalog English
                            5+      English         very well         very well             very well        very well
Keaau                         2,126 67.0%    1.8%    13.2%     4.8%     72.3%      0.0%                5.8%   18.7%
Lanai City                    2,711 67.1%    0.0%              1.4%     74.4%      0.3%      100.0%    7.6%   23.2%
Ewa Gentry                    4,032 67.8%    3.0%    14.8%     3.7%     92.7%      1.0%       73.2%   10.9%   70.3%
Laie                          5,164 68.6%    3.4%    45.4%     1.5%     0.0%       1.2%       29.0%    1.5%   85.9%
Puhi                          1,193 68.9%    0.0%              1.2%     0.0%       0.0%                8.6%   32.0%
Kahuku                        2,176 69.8%    0.4%    100.0%    0.0%                0.3%      100.0%    5.2%   12.4%
Hanamaulu                     3,473 69.9%    3.4%     6.8%     1.6%     66.7%      0.0%               12.1%   56.1%
Eleele                        1,836 70.0%    0.0%              1.9%    100.0%      0.0%               11.1%   43.1%
Haliimaile                      997 70.2%    0.0%              1.9%     73.7%      0.3%      100.0%    6.6%    4.5%
Koloa                         2,137 70.4%    0.0%              3.2%     79.4%      0.0%                6.0%   10.1%
Paia                          3,030 71.3%    0.0%              0.3%    100.0%      0.0%                3.5%   57.9%
Village Park                  8,710 71.7%    0.5%    100.0%    2.4%     62.6%      1.0%       22.9%   11.1%   37.3%
Halawa                       12,110 71.8%    1.9%    63.0%     2.5%     61.4%      1.6%       36.3%    7.5%   52.4%
Ewa Beach                    13,413 72.7%    0.5%    47.6%     1.4%     60.9%      0.0%               10.9%   33.5%
Honalo                        2,046 73.5%    0.0%              3.9%     74.7%      0.5%      100.0%    2.1%   51.2%
Kealakekua                    1,762 74.1%    0.4%    100.0%    3.5%     75.4%      0.3%       0.0%     0.3%   100.0%
Hana                            524 74.2%    0.0%              0.8%     0.0%       0.0%                0.0%
Nanawale Estates              1,192 74.6%    0.0%              0.0%                0.5%       0.0%     1.7%   40.0%
Wahiawa                      14,344 74.7%    0.7%    48.5%     5.8%     37.2%      1.0%       21.5%    3.7%   53.9%
Kailua (Hawaii County)       12,451 74.7%    0.4%    24.5%     2.3%     48.4%      0.3%       61.8%    2.7%   39.8%
Napili-Honokowai              6,786 75.5%    1.6%    39.1%     0.6%     38.1%      0.4%       32.0%    6.4%   37.9%
Waihee-Waiehu                 7,458 76.3%    0.0%              1.2%     58.2%      0.9%       66.2%    4.8%   34.0%
Pepeekeo                      1,624 76.4%    1.2%    30.0%     8.1%     43.5%      0.0%                0.7%   54.5%
Halaula                         460 76.7%    0.0%              1.7%    100.0%      0.0%                5.7%   57.7%
Waimalu                      27,393 77.0%    1.0%    40.8%     5.8%     60.8%      2.5%       24.5%    4.2%   59.1%
Aiea                          7,740 77.6%    0.5%    77.8%     8.7%     60.9%      0.5%       0.0%     2.1%   57.9%
Pahala                        1,206 77.9%    0.0%              2.2%     85.2%      0.0%                0.6%    0.0%
Papaikou                      1,424 78.0%    0.0%              4.8%     88.2%      0.0%                2.1%   23.3%
Kapalua                         370 78.1%    0.5%    100.0%    5.1%     26.3%      3.0%       36.4%    0.0%
Kaunakakai                    2,447 78.2%    0.0%              3.2%     91.1%      0.0%                6.5%   96.3%
Waialua                       3,381 78.4%    0.0%              2.3%     24.7%      0.0%                6.1%   59.7%
Waipio Acres                  5,596 78.4%    1.8%    91.9%     2.4%     45.5%      1.9%       74.0%    6.6%   38.9%
Hawaiian Paradise Park        6,986 78.5%    0.4%    43.3%     1.3%    100.0%      0.0%                1.2%   14.5%
Geography          Total    Percent Percent Percent   Percent Percent     Percent   Percent Percent Percent
                       Population  Only Chinese English Japanese English        Korean     English Tagalog English
                          5+      English         very well         very well             very well        very well
Waimea (Hawaii County)      8,334 78.6%    0.2%    100.0%     1.5%    84.4%      1.6%       0.0%    3.3%    51.1%
Hawaiian Beaches            3,510 78.7%    0.0%               1.6%    0.0%       1.0%       57.1%   0.2%     0.0%
Schofield Barracks         10,554 78.8%    0.4%    95.1%      0.6%    78.8%      0.1%      100.0%   0.5%    70.0%
Pearl City                 25,681 79.0%    2.1%    70.1%      6.1%    54.6%      0.9%       56.2%   3.5%    46.9%
Kurtistown                    990 79.2%    0.0%              10.2%    48.5%      0.0%               0.6%    100.0%
Waimanalo                   3,176 79.7%    0.1%     0.0%      0.9%    48.3%      1.0%       48.4%   3.6%    59.1%
Kapaa                       9,126 79.8%    0.9%    75.0%      2.3%    68.4%      0.0%               5.3%    25.2%
Captain Cook                3,128 80.0%    0.0%               6.6%    85.9%      0.0%               1.8%    100.0%
Waipio                     11,095 80.1%    2.0%    65.8%      3.0%    46.6%      0.8%       36.2%   5.7%    60.6%
Naalehu                     1,083 80.4%    0.0%               0.3%    0.0%       0.0%               2.4%    76.9%
Holualoa                    8,369 80.5%    0.4%    100.0%     1.4%    66.1%      0.1%       0.0%    1.0%    63.2%
Waikapu                     1,174 80.7%    0.5%    100.0%     5.7%    68.7%      1.4%       47.1%   2.9%    70.6%
Nanakuli                    9,422 81.0%    0.0%               0.1%    0.0%       0.1%       0.0%    1.7%    63.0%
Kekaha                      2,958 81.0%    0.0%               1.4%   100.0%      0.0%               4.2%    56.0%
Puako                         804 81.6%    0.0%               2.7%    59.1%      0.0%               0.0%
Kaaawa                      1,019 81.6%    0.0%               4.7%    77.1%      0.3%      100.0%   2.2%    100.0%
Kihei                      18,361 81.7%    1.4%    47.3%      0.9%    37.1%      0.1%      100.0%   2.6%    46.2%
Hanapepe                    2,256 81.8%    0.4%    100.0%     2.2%    88.0%      0.0%               3.8%    31.4%
Iroquois Point              2,488 82.0%    0.0%               2.0%    71.4%      0.6%      100.0%   1.0%    37.5%
Punaluu                       722 82.3%    0.0%               6.9%    88.0%      0.0%               1.1%    100.0%
Waianae                    10,755 82.4%    0.1%    100.0%     0.6%    35.4%      0.0%               2.7%    43.6%
Mililani Town              25,917 82.7%    0.5%    50.8%      3.3%    55.1%      2.0%       47.8%   2.6%    64.5%
Lihue                       6,122 82.8%    0.3%     0.0%      5.8%    63.0%      0.0%               4.5%    55.6%
Orchidlands Estates         2,026 83.1%    0.0%               0.9%   100.0%      0.0%               2.8%    51.8%
Pupukea                     4,194 83.2%    0.0%               1.2%    76.5%      0.0%               2.0%    69.5%
Waikoloa Village            5,458 83.4%    0.4%     0.0%      0.9%    26.5%      0.0%               1.6%    47.8%
Paauilo                       602 83.4%    0.0%               1.2%    0.0%       0.0%               4.0%     0.0%
Haleiwa                     1,981 83.4%    0.2%    100.0%     3.0%    63.3%      0.0%               2.0%    70.0%
Maili                       4,700 83.5%    0.0%               0.3%   100.0%      0.8%       35.1%   1.8%    26.2%
Kualapuu                    1,589 83.8%    0.0%               0.3%   100.0%      0.0%               3.8%    41.0%
Wheeler AFB                 2,372 83.9%    0.3%    100.0%     0.0%               0.8%       68.4%   3.0%    78.6%
Hilo                       45,468 84.2%    0.5%    78.0%      4.2%    53.4%      0.8%       25.9%   1.2%    66.4%
Omao                        1,260 84.4%    1.3%    100.0%     0.6%    0.0%       0.0%               4.5%    35.1%
Geography            Total    Percent Percent Percent   Percent Percent     Percent   Percent Percent Percent
                         Population  Only Chinese English Japanese English        Korean     English Tagalog English
                            5+      English         very well         very well             very well        very well
Mokuleia                      2,111 84.5%    0.4%     0.0%     0.9%    100.0%      0.0%               1.2%    100.0%
Waimea (Kauai County)         1,445 84.6%    0.0%              3.0%     18.2%      0.0%               8.3%    45.0%
Fern Forest                     503 84.7%    8.2%    100.0%    1.2%    100.0%      0.0%               0.0%
Makakilo City                14,540 85.0%    1.0%    39.5%     1.8%     73.7%      0.2%       79.3%   4.3%    79.2%
Honomu                          514 85.0%    0.0%              5.3%     88.9%      0.0%               2.7%     0.0%
Kalaoa                        8,123 85.2%    0.0%              0.1%    100.0%      0.3%       0.0%    1.3%    100.0%
Anahola                       1,841 85.3%    0.8%    100.0%    1.5%    100.0%      0.0%               1.5%     7.4%
Wailuku                      12,791 85.5%    0.4%    66.7%     3.4%     53.5%      1.0%       25.8%   3.4%    67.3%
Wainaku                       1,473 85.7%    0.3%    100.0%    2.4%     52.8%      0.0%               2.3%    20.6%
Honaunau-Napoopoo             2,399 85.9%    0.0%              1.0%     52.2%      0.0%               0.0%
Fern Acres                      766 85.9%    0.0%              0.0%                0.0%               0.7%     0.0%
Haiku-Pauwela                 7,386 86.1%    0.7%    100.0%    0.4%    100.0%      0.1%      100.0%   1.1%    51.9%
Kaneohe Station               9,332 86.3%    0.0%              1.4%     74.6%      0.2%       0.0%    0.3%    100.0%
Kaneohe                      31,232 86.4%    0.9%    60.2%     4.1%     73.4%      0.4%       43.4%   2.0%    68.6%
Hauula                        3,069 86.6%    2.0%    25.8%     0.0%                0.0%               0.0%
Makaha Valley                 1,101 86.6%    1.8%    75.0%     0.6%    100.0%      0.0%               0.5%    100.0%
Hawaiian Acres                1,761 86.7%    0.0%              0.9%    100.0%      0.0%               0.3%    100.0%
Princeville                   1,702 86.7%    0.2%    100.0%    0.0%                0.0%               0.4%    100.0%
Kukuihaele                      332 86.7%    0.0%              0.6%     0.0%       0.0%               0.0%
Wailua                        2,490 86.9%    2.7%    16.2%     2.2%     68.5%      1.2%       31.0%   0.5%     0.0%
Makaha                        6,512 87.2%    0.4%    100.0%    1.0%     81.3%      0.0%               1.0%    89.4%
Hawaiian Ocean View           2,566 87.3%    0.0%              0.0%                0.0%               0.0%
Kalihiwai                       922 87.5%    0.0%              0.0%                0.0%               1.7%    100.0%
Hickam Housing                5,374 87.6%    0.0%              0.2%    100.0%      0.7%       50.0%   1.5%    16.3%
Lawai                         1,722 87.9%    0.5%    100.0%    3.7%     79.4%      0.0%               0.3%    50.0%
Ainaloa                       2,057 88.0%    0.2%     0.0%     1.8%    100.0%      0.4%       0.0%    0.0%
Volcano                       2,190 88.2%    1.4%    100.0%    0.8%    100.0%      0.0%               0.9%    100.0%
Ahuimanu                      8,083 88.4%    1.6%     8.7%     1.9%     54.2%      0.3%       38.1%   1.2%    64.6%
Laupahoehoe                     524 88.9%    0.0%              1.1%     33.3%      0.0%               0.0%
Hanalei                         540 89.4%    0.0%              2.8%     86.7%      0.0%               0.0%
Kapaau                        1,043 89.5%    0.0%              2.5%    100.0%      0.0%               3.0%    64.5%
Waimanalo Beach               3,957 89.6%    0.8%    100.0%    1.0%     82.9%      0.1%      100.0%   0.0%
Kailua (Honolulu County)     32,062 89.6%    0.7%    81.2%     2.4%     72.5%      0.4%       46.1%   1.3%    60.5%
Geography           Total     Percent Percent Percent   Percent Percent     Percent   Percent Percent Percent
                        Population   Only Chinese English Japanese English        Korean     English Tagalog English
                           5+       English         very well         very well             very well        very well
Maunawili                    4,598 89.6%     0.2%    100.0%    2.7%     71.5%      1.0%      70.5%    1.5%    92.8%
Paukaa                         448 89.7%     0.0%              2.9%     61.5%      0.0%               0.0%
Mountain View                2,763 90.2%     0.0%              1.3%     73.0%      0.0%               0.9%    100.0%
Kahaluu                      2,351 90.7%     0.0%              1.5%     88.9%      0.3%       0.0%    0.0%
Leilani Estates              1,268 90.9%     0.5%    100.0%    0.3%    100.0%      0.0%               0.9%    72.7%
Makawao                      5,790 90.9%     0.0%              0.7%     31.7%      0.0%               0.5%    100.0%
Pukalani                     7,946 90.9%     1.1%    53.9%     1.1%     67.0%      0.4%      65.5%    0.8%    33.3%
Poipu                          978 91.0%     0.8%    100.0%    0.0%                0.0%               0.2%     0.0%
Kaanapali                      926 91.7%     0.6%    100.0%    0.8%    100.0%      0.0%               0.0%
Kahaluu-Keauhou              2,907 92.1%     0.0%              2.6%     41.3%      0.0%               0.0%
Hawi                           967 92.8%     0.0%              0.0%                0.0%               1.7%    100.0%
Heeia                        4,115 93.0%     1.9%    22.8%     0.8%     76.5%      0.2%       0.0%    0.5%    36.4%
Wailea-Makena                6,319 93.5%     0.0%              1.2%     80.8%      0.0%               1.3%    45.7%
Kalaheo                      3,876 93.8%     0.0%              0.0%                0.0%               0.9%    100.0%
Eden Roc                       553 93.9%     0.0%              0.0%                0.0%               0.0%
Wailua Homesteads            5,079 94.0%     0.0%              1.4%     84.7%      0.0%               0.6%    100.0%
Kawela Bay                     337 95.0%     0.0%              0.6%    100.0%      0.0%               3.0%    40.0%
Maalaea                        423 95.0%     0.0%              2.8%     0.0%       0.0%               0.0%
Waikane                        927 96.9%     0.0%              0.3%     0.0%       0.0%               1.0%    66.7%
Maunaloa                       357 98.9%     0.0%              0.0%                0.0%               1.1%    100.0%
Barbers Point Housing            58 100.0%   0.0%              0.0%                0.0%               0.0%

More Related Content

What's hot

Tabela de conversao z-dpmo
Tabela de conversao   z-dpmoTabela de conversao   z-dpmo
Tabela de conversao z-dpmoHugo Oliveira
 
NCAHD 2016 Products services
NCAHD 2016 Products servicesNCAHD 2016 Products services
NCAHD 2016 Products servicesAnn Peton
 
Presentation: Health Reform in Massachusetts
Presentation: Health Reform in MassachusettsPresentation: Health Reform in Massachusetts
Presentation: Health Reform in Massachusettsmasscare
 
Décima octava encuesta presidencia de la republica
Décima octava encuesta presidencia de la republicaDécima octava encuesta presidencia de la republica
Décima octava encuesta presidencia de la republicaDesde Puebla
 
Civil beat poll sept. 7 8, 2010 mayor crosstabs and toplines
Civil beat poll sept. 7 8, 2010 mayor crosstabs and toplinesCivil beat poll sept. 7 8, 2010 mayor crosstabs and toplines
Civil beat poll sept. 7 8, 2010 mayor crosstabs and toplinesHonolulu Civil Beat
 
Nifty stock snigdha
Nifty stock snigdhaNifty stock snigdha
Nifty stock snigdhaSnigdhaRoy15
 
Copy (2) of validity and reliability of mini – arabic in
Copy (2) of validity and reliability of      mini – arabic inCopy (2) of validity and reliability of      mini – arabic in
Copy (2) of validity and reliability of mini – arabic inاحمد البحيري
 
Willis - Health and productivity_survey_2011_v3
Willis - Health and productivity_survey_2011_v3Willis - Health and productivity_survey_2011_v3
Willis - Health and productivity_survey_2011_v3Annette Wright, GBA, GBDS
 
Etfl stoxx600 secflows_060511
Etfl stoxx600 secflows_060511Etfl stoxx600 secflows_060511
Etfl stoxx600 secflows_060511papelescom
 
Real Time Enrollment of IPS and Charter Schools
Real Time Enrollment of IPS and Charter SchoolsReal Time Enrollment of IPS and Charter Schools
Real Time Enrollment of IPS and Charter SchoolsAbdul-Hakim Shabazz
 

What's hot (15)

Tabela de conversao z-dpmo
Tabela de conversao   z-dpmoTabela de conversao   z-dpmo
Tabela de conversao z-dpmo
 
Towns Race
Towns RaceTowns Race
Towns Race
 
10-Year Changes 2000-2009
10-Year Changes 2000-200910-Year Changes 2000-2009
10-Year Changes 2000-2009
 
Home Value State Rankings
Home Value State RankingsHome Value State Rankings
Home Value State Rankings
 
NCAHD 2016 Products services
NCAHD 2016 Products servicesNCAHD 2016 Products services
NCAHD 2016 Products services
 
Students Reporting Use of Selected Substances in the Last 30 Days
Students Reporting Use of Selected Substances in the Last 30 Days Students Reporting Use of Selected Substances in the Last 30 Days
Students Reporting Use of Selected Substances in the Last 30 Days
 
Ala od survey
Ala od surveyAla od survey
Ala od survey
 
Presentation: Health Reform in Massachusetts
Presentation: Health Reform in MassachusettsPresentation: Health Reform in Massachusetts
Presentation: Health Reform in Massachusetts
 
Décima octava encuesta presidencia de la republica
Décima octava encuesta presidencia de la republicaDécima octava encuesta presidencia de la republica
Décima octava encuesta presidencia de la republica
 
Civil beat poll sept. 7 8, 2010 mayor crosstabs and toplines
Civil beat poll sept. 7 8, 2010 mayor crosstabs and toplinesCivil beat poll sept. 7 8, 2010 mayor crosstabs and toplines
Civil beat poll sept. 7 8, 2010 mayor crosstabs and toplines
 
Nifty stock snigdha
Nifty stock snigdhaNifty stock snigdha
Nifty stock snigdha
 
Copy (2) of validity and reliability of mini – arabic in
Copy (2) of validity and reliability of      mini – arabic inCopy (2) of validity and reliability of      mini – arabic in
Copy (2) of validity and reliability of mini – arabic in
 
Willis - Health and productivity_survey_2011_v3
Willis - Health and productivity_survey_2011_v3Willis - Health and productivity_survey_2011_v3
Willis - Health and productivity_survey_2011_v3
 
Etfl stoxx600 secflows_060511
Etfl stoxx600 secflows_060511Etfl stoxx600 secflows_060511
Etfl stoxx600 secflows_060511
 
Real Time Enrollment of IPS and Charter Schools
Real Time Enrollment of IPS and Charter SchoolsReal Time Enrollment of IPS and Charter Schools
Real Time Enrollment of IPS and Charter Schools
 

Similar to Languages Spoken in the Home — 2009 Breakdown

Similar to Languages Spoken in the Home — 2009 Breakdown (20)

States — Place of Birth
States — Place of BirthStates — Place of Birth
States — Place of Birth
 
Departure Time State Rankings
Departure Time State RankingsDeparture Time State Rankings
Departure Time State Rankings
 
States Sorted by High School Grad
States Sorted by High School GradStates Sorted by High School Grad
States Sorted by High School Grad
 
States Race
States RaceStates Race
States Race
 
Hawaii Towns — Place of Birth
Hawaii Towns — Place of BirthHawaii Towns — Place of Birth
Hawaii Towns — Place of Birth
 
Votaciones2006
Votaciones2006Votaciones2006
Votaciones2006
 
Travel Time State Rankings
Travel Time State RankingsTravel Time State Rankings
Travel Time State Rankings
 
U.S. States Median Rent
U.S. States Median RentU.S. States Median Rent
U.S. States Median Rent
 
Towns Ranked by High School Grad
Towns Ranked by High School GradTowns Ranked by High School Grad
Towns Ranked by High School Grad
 
Owner-Occupied State Rankings
Owner-Occupied State RankingsOwner-Occupied State Rankings
Owner-Occupied State Rankings
 
State Transportation Rankings
State Transportation RankingsState Transportation Rankings
State Transportation Rankings
 
State-by-State Comparison
State-by-State ComparisonState-by-State Comparison
State-by-State Comparison
 
Middle Class
Middle ClassMiddle Class
Middle Class
 
Avance crediticio al 03 jun 12
Avance crediticio al 03 jun 12Avance crediticio al 03 jun 12
Avance crediticio al 03 jun 12
 
Turkish consulate
Turkish consulateTurkish consulate
Turkish consulate
 
Avance de Crédito Infonavit al 08 julio 2012
Avance de Crédito Infonavit al 08 julio 2012Avance de Crédito Infonavit al 08 julio 2012
Avance de Crédito Infonavit al 08 julio 2012
 
Charlotte's stats
Charlotte's statsCharlotte's stats
Charlotte's stats
 
Avance crediticio al 24 junio 2012
Avance crediticio al 24 junio 2012Avance crediticio al 24 junio 2012
Avance crediticio al 24 junio 2012
 
Hawaii Towns Median Rent
Hawaii Towns Median RentHawaii Towns Median Rent
Hawaii Towns Median Rent
 
Avance de crédito infonavit al 29 jul-12
Avance de crédito infonavit al 29 jul-12Avance de crédito infonavit al 29 jul-12
Avance de crédito infonavit al 29 jul-12
 

More from Honolulu Civil Beat

Gov. David Ige response to U.S. Rep. Anna Eshoo
Gov. David Ige response to U.S. Rep. Anna EshooGov. David Ige response to U.S. Rep. Anna Eshoo
Gov. David Ige response to U.S. Rep. Anna EshooHonolulu Civil Beat
 
Audit of the Department of the Honolulu Prosecuting Attorney’s Policies, Proc...
Audit of the Department of the Honolulu Prosecuting Attorney’s Policies, Proc...Audit of the Department of the Honolulu Prosecuting Attorney’s Policies, Proc...
Audit of the Department of the Honolulu Prosecuting Attorney’s Policies, Proc...Honolulu Civil Beat
 
Audit of the Honolulu Police Department’s Policies, Procedures, and Controls
Audit of the Honolulu Police Department’s Policies, Procedures, and ControlsAudit of the Honolulu Police Department’s Policies, Procedures, and Controls
Audit of the Honolulu Police Department’s Policies, Procedures, and ControlsHonolulu Civil Beat
 
2019 Use of Force Annual Report HPD
2019 Use of Force Annual Report HPD 2019 Use of Force Annual Report HPD
2019 Use of Force Annual Report HPD Honolulu Civil Beat
 
Office of Health Equity Goals Draft 10
Office of Health Equity Goals Draft 10Office of Health Equity Goals Draft 10
Office of Health Equity Goals Draft 10Honolulu Civil Beat
 
ACLU Letter to HPD regarding racial profiling
ACLU Letter to HPD regarding racial profilingACLU Letter to HPD regarding racial profiling
ACLU Letter to HPD regarding racial profilingHonolulu Civil Beat
 
ACLU Letter to HPD regarding racial profiling
ACLU Letter to HPD regarding racial profilingACLU Letter to HPD regarding racial profiling
ACLU Letter to HPD regarding racial profilingHonolulu Civil Beat
 
Guam Governor's Letter to Pence
Guam Governor's Letter to Pence Guam Governor's Letter to Pence
Guam Governor's Letter to Pence Honolulu Civil Beat
 
List Of Pro Bono Legal Service Providers
List Of Pro Bono Legal Service ProvidersList Of Pro Bono Legal Service Providers
List Of Pro Bono Legal Service ProvidersHonolulu Civil Beat
 
Arbitration Hearing Transcript December 2018
Arbitration Hearing Transcript December 2018Arbitration Hearing Transcript December 2018
Arbitration Hearing Transcript December 2018Honolulu Civil Beat
 

More from Honolulu Civil Beat (20)

Gov. David Ige response to U.S. Rep. Anna Eshoo
Gov. David Ige response to U.S. Rep. Anna EshooGov. David Ige response to U.S. Rep. Anna Eshoo
Gov. David Ige response to U.S. Rep. Anna Eshoo
 
Audit of the Department of the Honolulu Prosecuting Attorney’s Policies, Proc...
Audit of the Department of the Honolulu Prosecuting Attorney’s Policies, Proc...Audit of the Department of the Honolulu Prosecuting Attorney’s Policies, Proc...
Audit of the Department of the Honolulu Prosecuting Attorney’s Policies, Proc...
 
Audit of the Honolulu Police Department’s Policies, Procedures, and Controls
Audit of the Honolulu Police Department’s Policies, Procedures, and ControlsAudit of the Honolulu Police Department’s Policies, Procedures, and Controls
Audit of the Honolulu Police Department’s Policies, Procedures, and Controls
 
2019 Use of Force Annual Report HPD
2019 Use of Force Annual Report HPD 2019 Use of Force Annual Report HPD
2019 Use of Force Annual Report HPD
 
Office of Health Equity Goals Draft 10
Office of Health Equity Goals Draft 10Office of Health Equity Goals Draft 10
Office of Health Equity Goals Draft 10
 
NHPI COVID-19 Statement
NHPI COVID-19 StatementNHPI COVID-19 Statement
NHPI COVID-19 Statement
 
DLIR Response Language Access
DLIR Response Language AccessDLIR Response Language Access
DLIR Response Language Access
 
Language Access Letter To DLIR
Language Access Letter To DLIRLanguage Access Letter To DLIR
Language Access Letter To DLIR
 
ACLU Letter to HPD regarding racial profiling
ACLU Letter to HPD regarding racial profilingACLU Letter to HPD regarding racial profiling
ACLU Letter to HPD regarding racial profiling
 
ACLU Letter to HPD regarding racial profiling
ACLU Letter to HPD regarding racial profilingACLU Letter to HPD regarding racial profiling
ACLU Letter to HPD regarding racial profiling
 
Jane Doe v. Rehab Hospital
Jane Doe v. Rehab HospitalJane Doe v. Rehab Hospital
Jane Doe v. Rehab Hospital
 
Coronavirus HPHA
Coronavirus HPHA Coronavirus HPHA
Coronavirus HPHA
 
OHA Data Request
OHA Data RequestOHA Data Request
OHA Data Request
 
Letter from Palau to Guam
Letter from Palau to GuamLetter from Palau to Guam
Letter from Palau to Guam
 
Guam Governor's Letter to Pence
Guam Governor's Letter to Pence Guam Governor's Letter to Pence
Guam Governor's Letter to Pence
 
OHA Analysis by Akina
OHA Analysis by AkinaOHA Analysis by Akina
OHA Analysis by Akina
 
Case COFA Letter
Case COFA LetterCase COFA Letter
Case COFA Letter
 
List Of Pro Bono Legal Service Providers
List Of Pro Bono Legal Service ProvidersList Of Pro Bono Legal Service Providers
List Of Pro Bono Legal Service Providers
 
Arbitration Hearing Transcript December 2018
Arbitration Hearing Transcript December 2018Arbitration Hearing Transcript December 2018
Arbitration Hearing Transcript December 2018
 
Caldwell Press Release
Caldwell Press ReleaseCaldwell Press Release
Caldwell Press Release
 

Languages Spoken in the Home — 2009 Breakdown

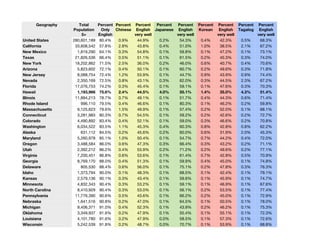
  • 1. Geography Total Percent Percent Percent Percent Percent Percent Percent Percent Percent Population Only Chinese English Japanese English Korean English Tagalog English 5+ English very well very well very well very well United States 280,601,189 80.4% 0.9% 44.9% 0.2% 54.3% 0.4% 42.3% 0.5% 68.3% California 33,608,542 57.8% 2.8% 43.8% 0.4% 51.0% 1.0% 38.5% 2.1% 67.2% New Mexico 1,819,290 64.1% 0.3% 54.8% 0.1% 59.8% 0.1% 47.2% 0.1% 73.1% Texas 21,826,536 66.4% 0.5% 51.1% 0.1% 61.5% 0.2% 45.3% 0.3% 74.0% New York 18,202,862 71.5% 2.5% 36.0% 0.2% 46.0% 0.6% 40.7% 0.4% 70.6% Arizona 5,823,602 72.1% 0.4% 50.1% 0.1% 60.7% 0.2% 49.6% 0.3% 71.8% New Jersey 8,088,754 72.4% 1.2% 53.9% 0.1% 44.7% 0.9% 43.9% 0.9% 74.4% Nevada 2,350,169 72.5% 0.8% 43.1% 0.3% 62.0% 0.3% 44.5% 2.3% 67.2% Florida 17,076,753 74.2% 0.3% 45.4% 0.1% 59.1% 0.1% 47.6% 0.3% 70.3% Hawaii 1,193,966 75.6% 2.4% 44.5% 4.0% 55.1% 1.4% 35.0% 4.3% 51.4% Illinois 11,894,213 78.7% 0.7% 49.1% 0.1% 51.7% 0.4% 44.3% 0.6% 71.4% Rhode Island 996,110 79.5% 0.4% 46.6% 0.1% 80.3% 0.1% 46.2% 0.2% 59.8% Massachusetts 6,125,623 79.6% 1.5% 49.9% 0.1% 57.4% 0.2% 52.0% 0.1% 68.1% Connecticut 3,281,983 80.3% 0.7% 54.5% 0.1% 59.2% 0.2% 42.6% 0.2% 72.7% Colorado 4,490,892 83.4% 0.4% 52.1% 0.1% 59.0% 0.3% 46.6% 0.2% 70.8% Washington 6,034,522 83.5% 1.1% 45.3% 0.4% 60.3% 0.8% 42.8% 0.8% 62.2% Alaska 631,112 84.5% 0.2% 45.6% 0.2% 60.0% 0.6% 31.9% 2.0% 45.3% Maryland 5,260,978 85.1% 1.0% 50.4% 0.1% 54.7% 0.7% 44.2% 0.4% 72.0% Oregon 3,488,584 86.0% 0.6% 47.3% 0.3% 66.4% 0.3% 43.2% 0.2% 71.1% Utah 2,392,212 86.2% 0.4% 53.9% 0.2% 71.2% 0.2% 49.6% 0.2% 77.1% Virginia 7,200,451 86.8% 0.6% 53.6% 0.1% 61.4% 0.7% 42.8% 0.5% 70.9% Georgia 8,769,170 88.0% 0.4% 51.3% 0.1% 59.9% 0.4% 45.0% 0.1% 74.8% Delaware 805,530 88.4% 0.6% 56.0% 0.1% 75.1% 0.2% 47.8% 0.3% 76.3% Idaho 1,373,794 90.0% 0.1% 48.3% 0.1% 68.5% 0.1% 42.4% 0.1% 79.1% Kansas 2,579,136 90.1% 0.3% 43.4% 0.1% 59.6% 0.1% 45.9% 0.1% 74.7% Minnesota 4,832,343 90.4% 0.3% 53.2% 0.1% 59.1% 0.1% 46.9% 0.1% 67.6% North Carolina 8,410,929 90.4% 0.3% 53.0% 0.1% 56.1% 0.2% 53.5% 0.1% 77.4% Pennsylvania 11,776,390 90.6% 0.5% 43.6% 0.1% 66.2% 0.2% 45.0% 0.1% 72.9% Nebraska 1,641,516 90.8% 0.2% 47.0% 0.1% 64.5% 0.1% 50.5% 0.1% 78.0% Michigan 9,406,371 91.0% 0.4% 52.3% 0.1% 43.9% 0.2% 46.2% 0.1% 75.3% Oklahoma 3,349,937 91.6% 0.2% 47.9% 0.1% 55.4% 0.1% 55.1% 0.1% 72.3% Louisiana 4,101,780 91.6% 0.2% 47.9% 0.0% 58.5% 0.1% 57.3% 0.1% 72.6% Wisconsin 5,242,539 91.8% 0.2% 48.7% 0.0% 70.7% 0.1% 53.9% 0.1% 68.8%
  • 2. Geography Total Percent Percent Percent Percent Percent Percent Percent Percent Percent Population Only Chinese English Japanese English Korean English Tagalog English 5+ English very well very well very well very well New Hampshire 1,239,553 91.9% 0.4% 50.8% 0.0% 69.4% 0.1% 30.6% 0.1% 82.9% Maine 1,245,544 92.6% 0.2% 54.7% 0.1% 78.5% 0.1% 55.2% 0.1% 68.0% Indiana 5,901,195 92.6% 0.3% 49.3% 0.1% 54.2% 0.1% 42.9% 0.1% 70.1% Iowa 2,781,968 93.6% 0.2% 53.8% 0.1% 60.6% 0.1% 34.4% 0.1% 79.8% South Dakota 740,226 93.6% 0.1% 41.8% 0.0% 51.7% 0.0% 55.9% 0.1% 55.8% Wyoming 487,996 93.6% 0.1% 53.4% 0.1% 77.2% 0.0% 58.1% 0.1% 64.6% Arkansas 2,639,351 93.7% 0.1% 43.5% 0.0% 55.3% 0.1% 59.9% 0.1% 69.3% South Carolina 4,119,061 93.8% 0.2% 45.6% 0.1% 55.0% 0.1% 46.8% 0.2% 71.9% Ohio 10,770,578 93.9% 0.3% 48.1% 0.1% 46.3% 0.1% 45.6% 0.1% 73.6% Tennessee 5,746,256 94.1% 0.2% 47.9% 0.1% 54.7% 0.1% 41.3% 0.1% 78.5% Missouri 5,508,991 94.3% 0.2% 46.7% 0.0% 57.1% 0.1% 41.0% 0.1% 70.7% North Dakota 599,081 94.6% 0.2% 45.1% 0.0% 71.6% 0.0% 68.6% 0.1% 52.0% Vermont 587,888 94.9% 0.2% 50.8% 0.1% 66.7% 0.1% 61.1% 0.0% 68.8% Montana 896,887 95.3% 0.1% 40.9% 0.1% 55.8% 0.1% 40.4% 0.1% 57.3% Alabama 4,325,565 95.6% 0.2% 50.3% 0.1% 46.4% 0.1% 49.6% 0.0% 74.6% Kentucky 3,968,808 95.6% 0.2% 45.3% 0.1% 42.0% 0.1% 52.4% 0.1% 76.0% Mississippi 2,707,018 96.4% 0.1% 43.4% 0.1% 78.0% 0.1% 43.1% 0.1% 64.4% West Virginia 1,706,010 97.7% 0.1% 53.0% 0.1% 46.6% 0.0% 64.2% 0.1% 77.5% Hawaii County 161,367 81.9% 0.3% 66.4% 2.6% 59.8% 0.4% 21.7% 1.5% 51.7% Honolulu County 840,660 73.3% 3.2% 43.9% 4.7% 53.8% 1.9% 35.5% 4.9% 52.0% Kauai County 59,160 81.5% 0.6% 40.6% 2.2% 71.4% 0.0% 31.0% 4.1% 42.0% Maui County 132,701 79.7% 0.6% 50.1% 1.6% 59.9% 0.5% 37.0% 4.0% 50.8% Pahoa 696 44.7% 0.0% 4.0% 42.9% 0.0% 3.3% 39.1% Kaumakani 604 45.2% 0.0% 6.0% 83.3% 0.0% 12.9% 39.7% Waipahu 33,650 49.6% 0.2% 20.6% 2.5% 45.0% 0.6% 10.7% 17.7% 37.0% Ewa Villages 5,075 57.9% 0.0% 3.0% 40.8% 0.0% 10.8% 37.1% Whitmore Village 3,494 59.8% 0.0% 0.7% 100.0% 0.0% 16.7% 45.9% Kahului 20,794 63.1% 0.4% 14.6% 2.6% 59.1% 1.1% 24.0% 10.2% 56.4% Honokaa 2,492 63.6% 0.0% 2.2% 63.0% 0.0% 4.7% 24.1% Pakala Village 322 64.6% 0.0% 4.0% 100.0% 0.0% 4.0% 69.2% Kilauea 2,343 66.2% 0.0% 4.1% 89.7% 0.0% 2.3% 13.2% Honolulu 354,931 66.4% 6.3% 41.9% 7.4% 50.7% 3.3% 33.4% 4.6% 53.6% Lahaina 9,544 67.0% 0.2% 25.0% 1.7% 61.8% 0.6% 14.5% 5.1% 39.2%
  • 3. Geography Total Percent Percent Percent Percent Percent Percent Percent Percent Percent Population Only Chinese English Japanese English Korean English Tagalog English 5+ English very well very well very well very well Keaau 2,126 67.0% 1.8% 13.2% 4.8% 72.3% 0.0% 5.8% 18.7% Lanai City 2,711 67.1% 0.0% 1.4% 74.4% 0.3% 100.0% 7.6% 23.2% Ewa Gentry 4,032 67.8% 3.0% 14.8% 3.7% 92.7% 1.0% 73.2% 10.9% 70.3% Laie 5,164 68.6% 3.4% 45.4% 1.5% 0.0% 1.2% 29.0% 1.5% 85.9% Puhi 1,193 68.9% 0.0% 1.2% 0.0% 0.0% 8.6% 32.0% Kahuku 2,176 69.8% 0.4% 100.0% 0.0% 0.3% 100.0% 5.2% 12.4% Hanamaulu 3,473 69.9% 3.4% 6.8% 1.6% 66.7% 0.0% 12.1% 56.1% Eleele 1,836 70.0% 0.0% 1.9% 100.0% 0.0% 11.1% 43.1% Haliimaile 997 70.2% 0.0% 1.9% 73.7% 0.3% 100.0% 6.6% 4.5% Koloa 2,137 70.4% 0.0% 3.2% 79.4% 0.0% 6.0% 10.1% Paia 3,030 71.3% 0.0% 0.3% 100.0% 0.0% 3.5% 57.9% Village Park 8,710 71.7% 0.5% 100.0% 2.4% 62.6% 1.0% 22.9% 11.1% 37.3% Halawa 12,110 71.8% 1.9% 63.0% 2.5% 61.4% 1.6% 36.3% 7.5% 52.4% Ewa Beach 13,413 72.7% 0.5% 47.6% 1.4% 60.9% 0.0% 10.9% 33.5% Honalo 2,046 73.5% 0.0% 3.9% 74.7% 0.5% 100.0% 2.1% 51.2% Kealakekua 1,762 74.1% 0.4% 100.0% 3.5% 75.4% 0.3% 0.0% 0.3% 100.0% Hana 524 74.2% 0.0% 0.8% 0.0% 0.0% 0.0% Nanawale Estates 1,192 74.6% 0.0% 0.0% 0.5% 0.0% 1.7% 40.0% Wahiawa 14,344 74.7% 0.7% 48.5% 5.8% 37.2% 1.0% 21.5% 3.7% 53.9% Kailua (Hawaii County) 12,451 74.7% 0.4% 24.5% 2.3% 48.4% 0.3% 61.8% 2.7% 39.8% Napili-Honokowai 6,786 75.5% 1.6% 39.1% 0.6% 38.1% 0.4% 32.0% 6.4% 37.9% Waihee-Waiehu 7,458 76.3% 0.0% 1.2% 58.2% 0.9% 66.2% 4.8% 34.0% Pepeekeo 1,624 76.4% 1.2% 30.0% 8.1% 43.5% 0.0% 0.7% 54.5% Halaula 460 76.7% 0.0% 1.7% 100.0% 0.0% 5.7% 57.7% Waimalu 27,393 77.0% 1.0% 40.8% 5.8% 60.8% 2.5% 24.5% 4.2% 59.1% Aiea 7,740 77.6% 0.5% 77.8% 8.7% 60.9% 0.5% 0.0% 2.1% 57.9% Pahala 1,206 77.9% 0.0% 2.2% 85.2% 0.0% 0.6% 0.0% Papaikou 1,424 78.0% 0.0% 4.8% 88.2% 0.0% 2.1% 23.3% Kapalua 370 78.1% 0.5% 100.0% 5.1% 26.3% 3.0% 36.4% 0.0% Kaunakakai 2,447 78.2% 0.0% 3.2% 91.1% 0.0% 6.5% 96.3% Waialua 3,381 78.4% 0.0% 2.3% 24.7% 0.0% 6.1% 59.7% Waipio Acres 5,596 78.4% 1.8% 91.9% 2.4% 45.5% 1.9% 74.0% 6.6% 38.9% Hawaiian Paradise Park 6,986 78.5% 0.4% 43.3% 1.3% 100.0% 0.0% 1.2% 14.5%
  • 4. Geography Total Percent Percent Percent Percent Percent Percent Percent Percent Percent Population Only Chinese English Japanese English Korean English Tagalog English 5+ English very well very well very well very well Waimea (Hawaii County) 8,334 78.6% 0.2% 100.0% 1.5% 84.4% 1.6% 0.0% 3.3% 51.1% Hawaiian Beaches 3,510 78.7% 0.0% 1.6% 0.0% 1.0% 57.1% 0.2% 0.0% Schofield Barracks 10,554 78.8% 0.4% 95.1% 0.6% 78.8% 0.1% 100.0% 0.5% 70.0% Pearl City 25,681 79.0% 2.1% 70.1% 6.1% 54.6% 0.9% 56.2% 3.5% 46.9% Kurtistown 990 79.2% 0.0% 10.2% 48.5% 0.0% 0.6% 100.0% Waimanalo 3,176 79.7% 0.1% 0.0% 0.9% 48.3% 1.0% 48.4% 3.6% 59.1% Kapaa 9,126 79.8% 0.9% 75.0% 2.3% 68.4% 0.0% 5.3% 25.2% Captain Cook 3,128 80.0% 0.0% 6.6% 85.9% 0.0% 1.8% 100.0% Waipio 11,095 80.1% 2.0% 65.8% 3.0% 46.6% 0.8% 36.2% 5.7% 60.6% Naalehu 1,083 80.4% 0.0% 0.3% 0.0% 0.0% 2.4% 76.9% Holualoa 8,369 80.5% 0.4% 100.0% 1.4% 66.1% 0.1% 0.0% 1.0% 63.2% Waikapu 1,174 80.7% 0.5% 100.0% 5.7% 68.7% 1.4% 47.1% 2.9% 70.6% Nanakuli 9,422 81.0% 0.0% 0.1% 0.0% 0.1% 0.0% 1.7% 63.0% Kekaha 2,958 81.0% 0.0% 1.4% 100.0% 0.0% 4.2% 56.0% Puako 804 81.6% 0.0% 2.7% 59.1% 0.0% 0.0% Kaaawa 1,019 81.6% 0.0% 4.7% 77.1% 0.3% 100.0% 2.2% 100.0% Kihei 18,361 81.7% 1.4% 47.3% 0.9% 37.1% 0.1% 100.0% 2.6% 46.2% Hanapepe 2,256 81.8% 0.4% 100.0% 2.2% 88.0% 0.0% 3.8% 31.4% Iroquois Point 2,488 82.0% 0.0% 2.0% 71.4% 0.6% 100.0% 1.0% 37.5% Punaluu 722 82.3% 0.0% 6.9% 88.0% 0.0% 1.1% 100.0% Waianae 10,755 82.4% 0.1% 100.0% 0.6% 35.4% 0.0% 2.7% 43.6% Mililani Town 25,917 82.7% 0.5% 50.8% 3.3% 55.1% 2.0% 47.8% 2.6% 64.5% Lihue 6,122 82.8% 0.3% 0.0% 5.8% 63.0% 0.0% 4.5% 55.6% Orchidlands Estates 2,026 83.1% 0.0% 0.9% 100.0% 0.0% 2.8% 51.8% Pupukea 4,194 83.2% 0.0% 1.2% 76.5% 0.0% 2.0% 69.5% Waikoloa Village 5,458 83.4% 0.4% 0.0% 0.9% 26.5% 0.0% 1.6% 47.8% Paauilo 602 83.4% 0.0% 1.2% 0.0% 0.0% 4.0% 0.0% Haleiwa 1,981 83.4% 0.2% 100.0% 3.0% 63.3% 0.0% 2.0% 70.0% Maili 4,700 83.5% 0.0% 0.3% 100.0% 0.8% 35.1% 1.8% 26.2% Kualapuu 1,589 83.8% 0.0% 0.3% 100.0% 0.0% 3.8% 41.0% Wheeler AFB 2,372 83.9% 0.3% 100.0% 0.0% 0.8% 68.4% 3.0% 78.6% Hilo 45,468 84.2% 0.5% 78.0% 4.2% 53.4% 0.8% 25.9% 1.2% 66.4% Omao 1,260 84.4% 1.3% 100.0% 0.6% 0.0% 0.0% 4.5% 35.1%
  • 5. Geography Total Percent Percent Percent Percent Percent Percent Percent Percent Percent Population Only Chinese English Japanese English Korean English Tagalog English 5+ English very well very well very well very well Mokuleia 2,111 84.5% 0.4% 0.0% 0.9% 100.0% 0.0% 1.2% 100.0% Waimea (Kauai County) 1,445 84.6% 0.0% 3.0% 18.2% 0.0% 8.3% 45.0% Fern Forest 503 84.7% 8.2% 100.0% 1.2% 100.0% 0.0% 0.0% Makakilo City 14,540 85.0% 1.0% 39.5% 1.8% 73.7% 0.2% 79.3% 4.3% 79.2% Honomu 514 85.0% 0.0% 5.3% 88.9% 0.0% 2.7% 0.0% Kalaoa 8,123 85.2% 0.0% 0.1% 100.0% 0.3% 0.0% 1.3% 100.0% Anahola 1,841 85.3% 0.8% 100.0% 1.5% 100.0% 0.0% 1.5% 7.4% Wailuku 12,791 85.5% 0.4% 66.7% 3.4% 53.5% 1.0% 25.8% 3.4% 67.3% Wainaku 1,473 85.7% 0.3% 100.0% 2.4% 52.8% 0.0% 2.3% 20.6% Honaunau-Napoopoo 2,399 85.9% 0.0% 1.0% 52.2% 0.0% 0.0% Fern Acres 766 85.9% 0.0% 0.0% 0.0% 0.7% 0.0% Haiku-Pauwela 7,386 86.1% 0.7% 100.0% 0.4% 100.0% 0.1% 100.0% 1.1% 51.9% Kaneohe Station 9,332 86.3% 0.0% 1.4% 74.6% 0.2% 0.0% 0.3% 100.0% Kaneohe 31,232 86.4% 0.9% 60.2% 4.1% 73.4% 0.4% 43.4% 2.0% 68.6% Hauula 3,069 86.6% 2.0% 25.8% 0.0% 0.0% 0.0% Makaha Valley 1,101 86.6% 1.8% 75.0% 0.6% 100.0% 0.0% 0.5% 100.0% Hawaiian Acres 1,761 86.7% 0.0% 0.9% 100.0% 0.0% 0.3% 100.0% Princeville 1,702 86.7% 0.2% 100.0% 0.0% 0.0% 0.4% 100.0% Kukuihaele 332 86.7% 0.0% 0.6% 0.0% 0.0% 0.0% Wailua 2,490 86.9% 2.7% 16.2% 2.2% 68.5% 1.2% 31.0% 0.5% 0.0% Makaha 6,512 87.2% 0.4% 100.0% 1.0% 81.3% 0.0% 1.0% 89.4% Hawaiian Ocean View 2,566 87.3% 0.0% 0.0% 0.0% 0.0% Kalihiwai 922 87.5% 0.0% 0.0% 0.0% 1.7% 100.0% Hickam Housing 5,374 87.6% 0.0% 0.2% 100.0% 0.7% 50.0% 1.5% 16.3% Lawai 1,722 87.9% 0.5% 100.0% 3.7% 79.4% 0.0% 0.3% 50.0% Ainaloa 2,057 88.0% 0.2% 0.0% 1.8% 100.0% 0.4% 0.0% 0.0% Volcano 2,190 88.2% 1.4% 100.0% 0.8% 100.0% 0.0% 0.9% 100.0% Ahuimanu 8,083 88.4% 1.6% 8.7% 1.9% 54.2% 0.3% 38.1% 1.2% 64.6% Laupahoehoe 524 88.9% 0.0% 1.1% 33.3% 0.0% 0.0% Hanalei 540 89.4% 0.0% 2.8% 86.7% 0.0% 0.0% Kapaau 1,043 89.5% 0.0% 2.5% 100.0% 0.0% 3.0% 64.5% Waimanalo Beach 3,957 89.6% 0.8% 100.0% 1.0% 82.9% 0.1% 100.0% 0.0% Kailua (Honolulu County) 32,062 89.6% 0.7% 81.2% 2.4% 72.5% 0.4% 46.1% 1.3% 60.5%
  • 6. Geography Total Percent Percent Percent Percent Percent Percent Percent Percent Percent Population Only Chinese English Japanese English Korean English Tagalog English 5+ English very well very well very well very well Maunawili 4,598 89.6% 0.2% 100.0% 2.7% 71.5% 1.0% 70.5% 1.5% 92.8% Paukaa 448 89.7% 0.0% 2.9% 61.5% 0.0% 0.0% Mountain View 2,763 90.2% 0.0% 1.3% 73.0% 0.0% 0.9% 100.0% Kahaluu 2,351 90.7% 0.0% 1.5% 88.9% 0.3% 0.0% 0.0% Leilani Estates 1,268 90.9% 0.5% 100.0% 0.3% 100.0% 0.0% 0.9% 72.7% Makawao 5,790 90.9% 0.0% 0.7% 31.7% 0.0% 0.5% 100.0% Pukalani 7,946 90.9% 1.1% 53.9% 1.1% 67.0% 0.4% 65.5% 0.8% 33.3% Poipu 978 91.0% 0.8% 100.0% 0.0% 0.0% 0.2% 0.0% Kaanapali 926 91.7% 0.6% 100.0% 0.8% 100.0% 0.0% 0.0% Kahaluu-Keauhou 2,907 92.1% 0.0% 2.6% 41.3% 0.0% 0.0% Hawi 967 92.8% 0.0% 0.0% 0.0% 1.7% 100.0% Heeia 4,115 93.0% 1.9% 22.8% 0.8% 76.5% 0.2% 0.0% 0.5% 36.4% Wailea-Makena 6,319 93.5% 0.0% 1.2% 80.8% 0.0% 1.3% 45.7% Kalaheo 3,876 93.8% 0.0% 0.0% 0.0% 0.9% 100.0% Eden Roc 553 93.9% 0.0% 0.0% 0.0% 0.0% Wailua Homesteads 5,079 94.0% 0.0% 1.4% 84.7% 0.0% 0.6% 100.0% Kawela Bay 337 95.0% 0.0% 0.6% 100.0% 0.0% 3.0% 40.0% Maalaea 423 95.0% 0.0% 2.8% 0.0% 0.0% 0.0% Waikane 927 96.9% 0.0% 0.3% 0.0% 0.0% 1.0% 66.7% Maunaloa 357 98.9% 0.0% 0.0% 0.0% 1.1% 100.0% Barbers Point Housing 58 100.0% 0.0% 0.0% 0.0% 0.0%