![The Unintended Effects of VA Teacher
Evaluation in Houston: Three Cases in Point
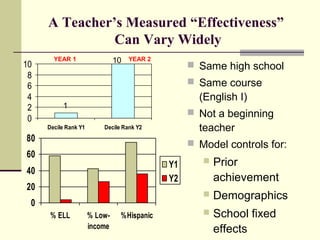
In spring of 2011, a number of HISD
teachers’ contracts were not renewed, largely
due to:
“a significant lack of student progress attributable
to the educator,” and
“insufficient student academic growth reflected by
[EVAAS] value-added scores.”
These teachers filed wrongful termination
appeals.
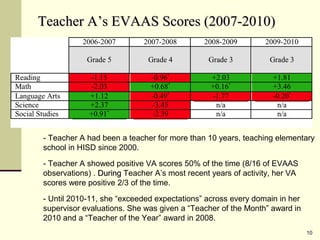
Let’s take a look at the EVAAS data for 3 of
them 9](https://image.slidesharecdn.com/developingandassessingteachereffectiveness-top101-120813112805-phpapp02/85/Developing-and-Assessing-Teacher-Effectiveness-9-320.jpg)
![UNINTENDED EFFECTS
“The most pernicious effect of these [test-
based accountability] systems is to cause
teachers to resent the children who don’t
score well.”
—Anonymous teacher,
in a workshop many years ago](https://image.slidesharecdn.com/developingandassessingteachereffectiveness-top101-120813112805-phpapp02/85/Developing-and-Assessing-Teacher-Effectiveness-14-320.jpg)
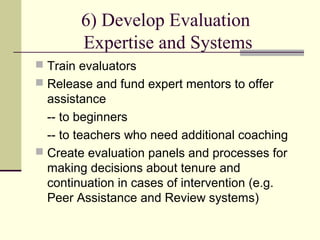
![Teacher Educators Learn
This [scoring] experience…has forced me to
revisit the question of what really matters in
the assessment of teachers, which – in turn –
means revisiting the question of what really
matters in the preparation of teachers.](https://image.slidesharecdn.com/developingandassessingteachereffectiveness-top101-120813112805-phpapp02/85/Developing-and-Assessing-Teacher-Effectiveness-27-320.jpg)
![Cooperating Teachers
Reflect on Practice
[The scoring process] forces you to be clear
about “good teaching;” what it looks like,
sounds like. It enables you to look at your
own practice critically/with new eyes.](https://image.slidesharecdn.com/developingandassessingteachereffectiveness-top101-120813112805-phpapp02/85/Developing-and-Assessing-Teacher-Effectiveness-28-320.jpg)

This document discusses developing and assessing teacher effectiveness. It notes that while value-added models (VAMs) are being promoted as tools for teacher evaluation, research shows that VAM estimates of teacher effectiveness are unstable and influenced by many factors outside a teacher's control. The document then outlines 10 recommendations for developing a comprehensive system for evaluating and supporting teacher effectiveness, including using standards-based evaluations, performance assessments, multiple measures of teaching practice and student outcomes, professional development, and addressing other influences on teaching.