Consumer Confidence Shifts Around Elections: Presidential vs Midterm
•
1 like•806 views

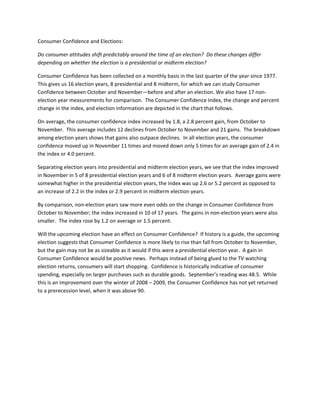
Consumer confidence tends to increase from October to November around election times. In election years, confidence rose 11 times and fell 5 times, averaging a 2.4 point gain. Gains were larger in presidential election years compared to midterm years. In non-election years, confidence was more evenly split between increases and decreases, averaging a smaller 1.2 point rise. The upcoming election suggests confidence may rise but not as much as in presidential election years.

Recommended
Recommended
More Related Content
Similar to Consumer Confidence Shifts Around Elections: Presidential vs Midterm
Similar to Consumer Confidence Shifts Around Elections: Presidential vs Midterm (9)
More from NAR Research
More from NAR Research (20)
Recently uploaded
Recently uploaded (20)
Consumer Confidence Shifts Around Elections: Presidential vs Midterm
- 2. Year October November October to November (%) October to November Type of Year Election Type President Party House Results Senate Results 1977 95.5 98.9 3.6% 3.4 No Election 1978 108.6 96.5 ‐11.1% (12.1) Election Year Midterm Carter D D ‐15 D ‐3 1979 92.3 90.2 ‐2.3% (2.1) No Election 1980 84.2 87.2 3.6% 3.0 Election Year Presidential 1981 75.6 66.9 ‐11.5% (8.7) No Election 1982 54.3 57.4 5.7% 3.1 Election Year Midterm Reagan R R ‐26 R +2 1983 92.1 96.7 5.0% 4.6 No Election 1984 99.1 105.5 6.5% 6.4 Election Year Presidential 1985 96.1 98.1 2.1% 2.0 No Election 1986 85.8 89.7 4.5% 3.9 Election Year Midterm Reagan R R ‐5 R ‐8 1987 115.1 100.8 ‐12.4% (14.3) No Election 1988 116.9 112.9 ‐3.4% (4.0) Election Year Presidential 1989 117 115.1 ‐1.6% (1.9) No Election 1990 62.6 61.7 ‐1.4% (0.9) Election Year Midterm G. H.W. Bush R R ‐8 R ‐1 1991 60.1 52.7 ‐12.3% (7.4) No Election 1992 54.6 65.6 20.1% 11.0 Election Year Presidential 1993 60.5 71.9 18.8% 11.4 No Election 1994 89.1 100.4 12.7% 11.3 Election Year Midterm Clinton D D ‐54 D ‐8 1995 96.3 101.6 5.5% 5.3 No Election 1996 107.3 109.5 2.1% 2.2 Election Year Presidential 1997 123.4 128.1 3.8% 4.7 No Election 1998 119.3 126.4 6.0% 7.1 Election Year Midterm Clinton D D +5 no change 1999 130.5 137 5.0% 6.5 No Election 2000 135.8 132.6 ‐2.4% (3.2) Election Year Presidential 2001 85.3 84.9 ‐0.5% (0.4) No Election 2002 79.6 84.9 6.7% 5.3 Election Year Midterm G. W. Bush R R +8 R +2 2003 81.7 92.5 13.2% 10.8 No Election 2004 92.9 92.6 ‐0.3% (0.3) Election Year Presidential 2005 85.2 98.3 15.4% 13.1 No Election 2006 105.1 105.3 0.2% 0.2 Election Year Midterm G.W. Bush R R ‐30 R ‐6 2007 95.2 87.8 ‐7.8% (7.4) No Election 2008 38.8 44.7 15.2% 5.9 Election Year Presidential 2009 48.7 50.6 3.90% 1.9 No Election 2010 ?? ?? ?? ?? Election Year Midterm Obama D ?? ?? Conference Board: Consumer Confidence