ABSA_ Residential Building Statistics
•
0 likes•44 views

ABSA_ Residential Building Statistics

Recommended
Recommended
More Related Content
What's hot
What's hot (20)
Similar to ABSA_ Residential Building Statistics
Similar to ABSA_ Residential Building Statistics (20)
More from Berty Van Staaden
More from Berty Van Staaden (20)
Recently uploaded
Recently uploaded (20)
ABSA_ Residential Building Statistics
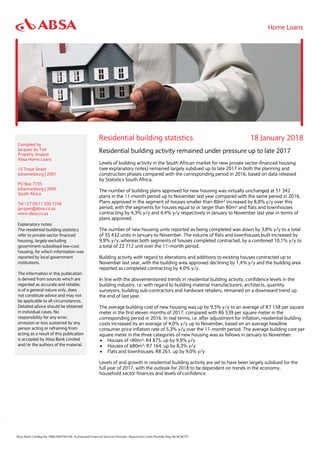
- 1. Residential building statistics 18 January 2018 Compiled by Jacques du Toit Property Analyst Absa Home Loans 15 Troye Street Johannesburg | 2001 PO Box 7735 Johannesburg | 2000 South Africa Tel +27 (0)11 350 7246 jacques@absa.co.za www.absa.co.za Explanatory notes: The residential building statistics refer to private-sector financed housing, largely excluding government-subsidised low-cost housing, for which information was reported by local government institutions. The information in this publication is derived from sources which are regarded as accurate and reliable, is of a general nature only, does not constitute advice and may not be applicable to all circumstances. Detailed advice should be obtained in individual cases. No responsibility for any error, omission or loss sustained by any person acting or refraining from acting as a result of this publication is accepted by Absa Bank Limited and/or the authors of the material. Residential building activity remained under pressure up to late 2017 Levels of building activity in the South African market for new private sector-financed housing (see explanatory notes) remained largely subdued up to late 2017 in both the planning and construction phases compared with the corresponding period in 2016, based on data released by Statistics South Africa. The number of building plans approved for new housing was virtually unchanged at 51 342 plans in the 11-month period up to November last year compared with the same period in 2016. Plans approved in the segment of houses smaller than 80m² increased by 8,8% y/y over this period, with the segments for houses equal to or larger than 80m² and flats and townhouses contracting by 4,3% y/y and 4,4% y/y respectively in January to November last year in terms of plans approved. The number of new housing units reported as being completed was down by 3,8% y/y to a total of 35 432 units in January to November. The volume of flats and townhouses built increased by 9,9% y/y, whereas both segments of houses completed contracted, by a combined 10,1% y/y to a total of 22 712 unit over the 11-month period. Building activity with regard to alterations and additions to existing houses contracted up to November last year, with the building area approved declining by 1,4% y/y and the building area reported as completed contracting by 4,0% y/y. In line with the abovementioned trends in residential building activity, confidence levels in the building industry, i.e. with regard to building material manufacturers, architects, quantity surveyors, building sub-contractors and hardware retailers, remained on a downward trend up the end of last year. The average building cost of new housing was up by 9,5% y/y to an average of R7 158 per square meter in the first eleven months of 2017, compared with R6 539 per square meter in the corresponding period in 2016. In real terms, i.e. after adjustment for inflation, residential building costs increased by an average of 4,0% y/y up to November, based on an average headline consumer price inflation rate of 5,3% y/y over the 11-month period. The average building cost per square meter in the three categories of new housing was as follows in January to November: • Houses of <80m²: R4 875, up by 9,9% y/y • Houses of ≥80m²: R7 164, up by 8,3% y/y • Flats and townhouses: R8 261, up by 9,0% y/y Levels of and growth in residential building activity are set to have been largely subdued for the full year of 2017, with the outlook for 2018 to be dependent on trends in the economy, household sector finances and levels of confidence.
- 2. Home Loans | 2 Segment Units % of total Units % of total Houses of <80m² 738 402 42.6 588 001 45.9 Houses of ≥80m² 517 519 29.9 345 368 27.0 Flats and tow nhouses 476 787 27.5 347 112 27.1 Total 1 732 708 100.0 1 280 481 100.0 1 Private-sector financed Source: Stats SA Building plans approved Buildings completed Residential building activity1 1994 - 2017 year-to-date Units m² Units m² 2016 Number %∆ 2016 m² %∆ 2016 Number %∆ 2016 m² %∆ Houses of <80m² 16 094 17 638 9.6 779 985 848 954 8.8 14 134 13 131 -7.1 683 544 640 965 -6.2 Houses of ≥80m² 14 804 14 161 -4.3 4 045 166 3 833 622 -5.2 11 124 9 581 -13.9 2 728 203 2 534 587 -7.1 Flats and tow nhouses 20 433 19 543 -4.4 2 114 854 2 159 673 2.1 11 570 12 720 9.9 1 164 220 1 357 472 16.6 Total 51 331 51 342 0.0 6 940 005 6 842 249 -1.4 36 828 35 432 -3.8 4 575 967 4 533 024 -0.9 1 Private-sector financed Source: Stats SA Segment Units 2017 Building area 2017 Units 2017 Building area 2017 Building plans approved Buildings completed Residential building activity: January - November1 Segment Period Variable WC EC NC FS KZN NW GAU MPU LIM SA Total new Jan-Nov 16 Number 15 943 3 152 262 1 943 4 901 1 849 19 757 2 591 933 51 331 houses, January - Number 17 236 3 347 184 1 415 5 651 3 869 16 906 1 745 989 51 342 flats and November % change 8.1 6.2 -29.8 -27.2 15.3 109.2 -14.4 -32.7 6.0 0.0 townhouses 2017 % of SA 33.6 6.5 0.4 2.8 11.0 7.5 32.9 3.4 1.9 100.0 Alterations Jan-Nov 16 m² 822 135 251 805 49 578 140 973 335 230 131 658 885 686 142 838 61 257 2 821 160 and additions January - m² 825 749 269 976 35 319 128 169 360 684 122 039 868 191 118 646 51 712 2 780 485 to existing November % change 0.4 7.2 -28.8 -9.1 7.6 -7.3 -2.0 -16.9 -15.6 -1.4 houses 2017 % of SA 29.7 9.7 1.3 4.6 13.0 4.4 31.2 4.3 1.9 100.0 Segment Period Variable WC EC NC FS KZN NW GAU MPU LIM SA Total new Jan-Nov 16 Number 10 780 2 220 102 1 934 1 663 2 004 15 582 1 903 640 36 828 houses, January - Number 11 454 1 030 70 831 2 147 1 409 16 189 1 288 1 014 35 432 flats and November % change 6.3 -53.6 -31.4 -57.0 29.1 -29.7 3.9 -32.3 58.4 -3.8 townhouses 2017 % of SA 32.3 2.9 0.2 2.3 6.1 4.0 45.7 3.6 2.9 100.0 Alterations Jan-Nov 16 m² 505 588 57 220 38 016 32 833 128 704 68 736 232 789 71 969 5 683 1 141 538 and additions January - m² 535 721 88 053 18 088 35 945 119 801 31 857 235 326 27 211 3 611 1 095 613 to existing November % change 6.0 53.9 -52.4 9.5 -6.9 -53.7 1.1 -62.2 -36.5 -4.0 houses 2017 % of SA 48.9 8.0 1.7 3.3 10.9 2.9 21.5 2.5 0.3 100.0 1 Private-sector financed Source: Stats SA Residential building activity by province1 Building plans approved Buildings completed
- 3. Home Loans | 3 2000 3000 4000 5000 6000 7000 8000 9000 10000 07 08 09 10 11 12 13 14 15 16 17 Source: Stats SA Residential building activity Number of houses, flats and townhouses, 3-month moving average Plans approved Buildings completed 34.4 37.1 27.6 27.0 38.1 35.9 0 10 20 30 40 50 60 70 80 90 100 Plans approved Buildings completed % Source: Stats SA Residential building activity % share January - November 2017 Houses <80m² Houses ≥80m² Flats and townhouses -60 -50 -40 -30 -20 -10 0 10 20 30 40 09 10 11 12 13 14 15 16 17 % Source: Stats SA Growth in residential building activity Houses, flats and townhouses, 3-m moving average Plans approved Buildings completed
- 4. Home Loans | 4 -60 -40 -20 0 20 40 60 09 10 11 12 13 14 15 16 17 % Source: Stats SA Growth in residential building activity Houses (<80m²), 3-month moving average Plans approved Buildings completed -50 -40 -30 -20 -10 0 10 20 30 40 09 10 11 12 13 14 15 16 17 % Source: Stats SA Growth in residential building activity Houses (≥80m²), 3-month moving average Plans approved Buildings completed -60 -40 -20 0 20 40 60 80 100 09 10 11 12 13 14 15 16 17 % Source: Stats SA Growth in residential building activity Flats and townhouses, 3-month moving average Plans approved Buildings completed
- 5. Home Loans | 5 0 10 20 30 40 50 60 70 80 90 100 06 07 08 09 10 11 12 13 14 15 16 17 Source: BER Building confidence index 50 = neutrality