In the Tucson housing market in August 2019:
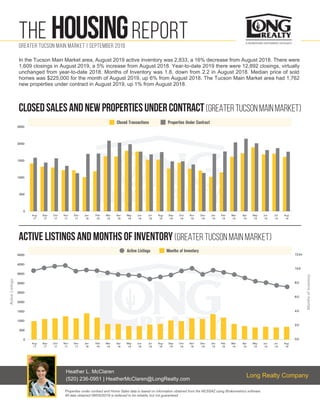
- Active inventory decreased 16% from August 2018 to 2,833 properties.
- Closed sales increased 5% to 1,609 sales.
- The median price of sold homes increased 6% to $225,000.
- New properties under contract increased 1% to 1,762.
- Months of inventory decreased to 1.8 months from 2.2 months in August 2018.
1. THE HOUSINGREPORTGreater Tucson Main Market | September 2019
0.0
2.0
4.0
6.0
8.0
10.0
12.0+
Properties Under ContractClosed Transactions
MonthsofInventory
ActiveListings
Months of InventoryActive Listings
0
500
1000
1500
2000
2500
0
500
1000
1500
2000
2500
3000
3500
4000
4500
Properties under contract and Home Sales data is based on information obtained from the MLSSAZ using Brokermetrics software.
All data obtained 09/05/2019 is believed to be reliable, but not guaranteed.
ClosedsalesANDNEWpropertiesUndercontract(GREATERTUCSONMAINMARKET)
Active Listings and Months of Inventory (GREATER TUCSON MAIN MARKET)
Aug- Sep- Oct- Nov- Dec- Jan- Feb- Mar- Apr- May- Jun- Jul- Aug- Sep- Oct- Nov- Dec- Jan- Feb- Mar- Apr- May- Jun- Jul- Aug-
17 17 17 17 17 18 18 18 18 18 18 18 18 18 18 18 18 19 19 19 19 19 19 19 19
Aug- Sep- Oct- Nov- Dec- Jan- Feb- Mar- Apr- May- Jun- Jul- Aug- Sep- Oct- Nov- Dec- Jan- Feb- Mar- Apr- May- Jun- Jul- Aug-
17 17 17 17 17 18 18 18 18 18 18 18 18 18 18 18 18 19 19 19 19 19 19 19 19
Heather L. McClaren
(520) 236-0951 | HeatherMcClaren@LongRealty.com
Long Realty Company
In the Tucson Main Market area, August 2019 active inventory was 2,833, a 16% decrease from August 2018. There were
1,609 closings in August 2019, a 5% increase from August 2018. Year-to-date 2019 there were 12,892 closings, virtually
unchanged from year-to-date 2018. Months of Inventory was 1.8, down from 2.2 in August 2018. Median price of sold
homes was $225,000 for the month of August 2019, up 6% from August 2018. The Tucson Main Market area had 1,762
new properties under contract in August 2019, up 1% from August 2018.
2. THE HOUSINGREPORTGreater Tucson Main Market | September 2019
50,000
100,000
150,000
200,000
250,000
300,000
Median List PriceMedian Sale Price
-
Median Sold Price and Median Listed Price (GREATER TUCSON MAIN MARKET)
Aug- Sep- Oct- Nov- Dec- Jan- Feb- Mar- Apr- May- Jun- Jul- Aug- Sep- Oct- Nov- Dec- Jan- Feb- Mar- Apr- May- Jun- Jul- Aug-
17 17 17 17 17 18 18 18 18 18 18 18 18 18 18 18 18 19 19 19 19 19 19 19 19
These statistics are based on information obtained from MLSSAZ and using Brokermetrics software on 09/05/2019. Information is believed to be
reliable, but not guaranteed.
30 year fixed mortgage rateMonthlyPaymentonaMedianPriced
Home (GREATER TUCSON MAIN MARKET)
Residential median sales prices. Monthly payments are based on a 5% down payment on a
median priced home.
Year Median Price Int. Rate MO. Payment
2006 $220,000 6.140% $1,271.93
2018 $212,250 4.879% $1,067.51
2019 $225,000 3.625% $974.81
New Home Permits and Closings (GREATER TUCSON MAIN MARKET)
Permits Closings
0
50
100
150
200
250
300
350
400
450
Jan-18 Feb-18 Mar-18 Apr-18 May-18 Jun-18 Jul-18 Aug-18 Sep-18 Oct-18 Nov-18 Dec-18 Jan-19 Feb-19 Mar-19 Apr-19 May-19 Jun-19 Jul-19
Source: Ginger G. Kneup of Bright Future Real Estate Research, LLC.Source: Ginger G. Kneup of Bright Future Real Estate Research, LLC.
Source: FreddieMac.com
2010 20152011 2012 2013 2014 2016 2017 2018 2019
5.00%
3.00%
3.50%
4.00%
4.50%
5.50%
For July 2019, new home permits were virtually unchanged year-to-date from 2018 and new home closings were up 14%
year to date from 2018.
Heather L. McClaren
(520) 236-0951 | HeatherMcClaren@LongRealty.com
Long Realty Company
3. THE HOUSINGREPORTGreater Tucson Main Market | September 2019
Statistics based on information obtained from MLSSAZ and using Brokermetrics software on 09/05/2019. 3 month trend in months of inventory
is the average of closed sales and active listing data from 06/01/2019-08/31/2019. Information is believed to be reliable, but not guaranteed.
$1 - 49,999
$50,000 - 74,999
$75,000 - 99,999
$100,000 - 124,999
$125,000 - 149,999
$150,000 - 174,999
$175,000 - 199,999
$200,000 - 224,999
$225,000 - 249,999
$250,000 - 274,999
$275,000 - 299,999
$300,000 - 349,999
$350,000 - 399,999
$400,000 - 499,999
$500,000 - 599,999
$600,000 - 699,999
$700,000 - 799,999
$800,000 - 899,999
$900,000 - 999,999
$1,000,000 - and over
TOTAL
15 14 13 5 10 8 8 1.9 1.5 Seller
21 29 45 28 25 22 23 0.9 1.2 Seller
53 54 71 52 48 47 45 1.2 1.1 Seller
67 84 79 70 61 40 43 1.6 1.4 Seller
113 131 120 118 120 103 112 1.0 0.9 Seller
129 183 217 203 150 170 148 0.9 0.8 Seller
197 232 237 284 228 247 230 0.9 1.0 Seller
198 178 216 201 204 200 183 1.1 1.1 Seller
282 142 143 220 174 173 178 1.6 1.6 Seller
206 112 123 150 137 139 103 2.0 1.6 Seller
226 106 88 115 107 110 104 2.2 2.3 Seller
280 139 137 166 153 161 155 1.8 1.8 Seller
243 98 98 132 106 96 81 3.0 2.6 Seller
239 105 101 132 100 121 102 2.3 2.3 Seller
140 42 49 48 59 42 35 4.0 3.2 Seller
102 25 18 33 28 32 22 4.6 3.9 Seller
81 11 24 16 23 15 14 5.8 5.2 Balanced
57 7 10 12 12 10 12 4.8 5.5 Balanced
48 5 6 4 5 19 3 16.0 5.1 Balanced
136 7 7 14 12 7 8 17.0 16.0 Buyer
2,833 1,704 1,802 2,003 1,762 1,762 1,609 1.8 1.7 Seller
Active
Listings
Last 6 Months
Closed Sales
Mar-19 Apr-19 May-19 Jun-19 Jul-19 Aug-19
Current
Months of
Inventory
Last 3 Month
Trend Months
of Inventory
Market
Conditions
Market Conditions by Price Band (GREATER TUCSON MAIN MARKET)
Heather L. McClaren
(520) 236-0951 | HeatherMcClaren@LongRealty.com
Long Realty Company
4. THE HOUSINGREPORTGreater Tucson Main Market | September 2019
This heat map represents the percentage of change in Tucson metro median sales prices from June 2018-August 2018 to June 2019-August 2019 by zip code.
These statistics are based on information obtained from the MLSSAZ on 09/05/2019. Information is believed to be reliable, but not guaranteed.
PLEASE FEEL FREE TO CONTACT ME FOR A MORE IN-DEPTH ANALYSIS.
Change in Median
Sales Price by
Zip CODE
(JUN2018-AUG 2018 TO
JUN 2019-AUG 2019)
Real Estate remains very
localized and market
conditions can vary greatly by
not only geographic area but
also by price range.
85739
8575585658
85742
85653
85743
85745
85713
85701
85719
85716
85705
85741
85704
85737
85718
85712
85750
85749
85715
857488571085711
85730
85707
85747
85706
85756
85714
85746
85757
85735
85614 85622 85629 85641
85708
85706
Percentage of Change
MARKET SHARE
(GREATER TUCSON
MAIN MARKET)
Long Realty leads the
market in successful
real estate sales.
Data Obtained 09/05/2019 from
MLSSAZ using BrokerMetrics
software for all closed residential
sales volume between
09/01/2018 – 08/31/2019
rounded to the nearest tenth of one
percent and deemed to be correct.
LONG REALTY COMPANY -------------------------- -- --------------------------- 26.2%
Tierra Antigua Realty ---------------------------- --- 14.3%
Realty Executives Tucson Elite ------ ----- ---- --- 9.2%
Coldwell Banker Residential Brokerage ----------- --- - 7.6%
Keller Williams Southern Arizona ----------- - - - 6.6%
Exp Realty ---- - - 3.6%
Heather L. McClaren
(520) 236-0951 | HeatherMcClaren@LongRealty.com
Long Realty Company