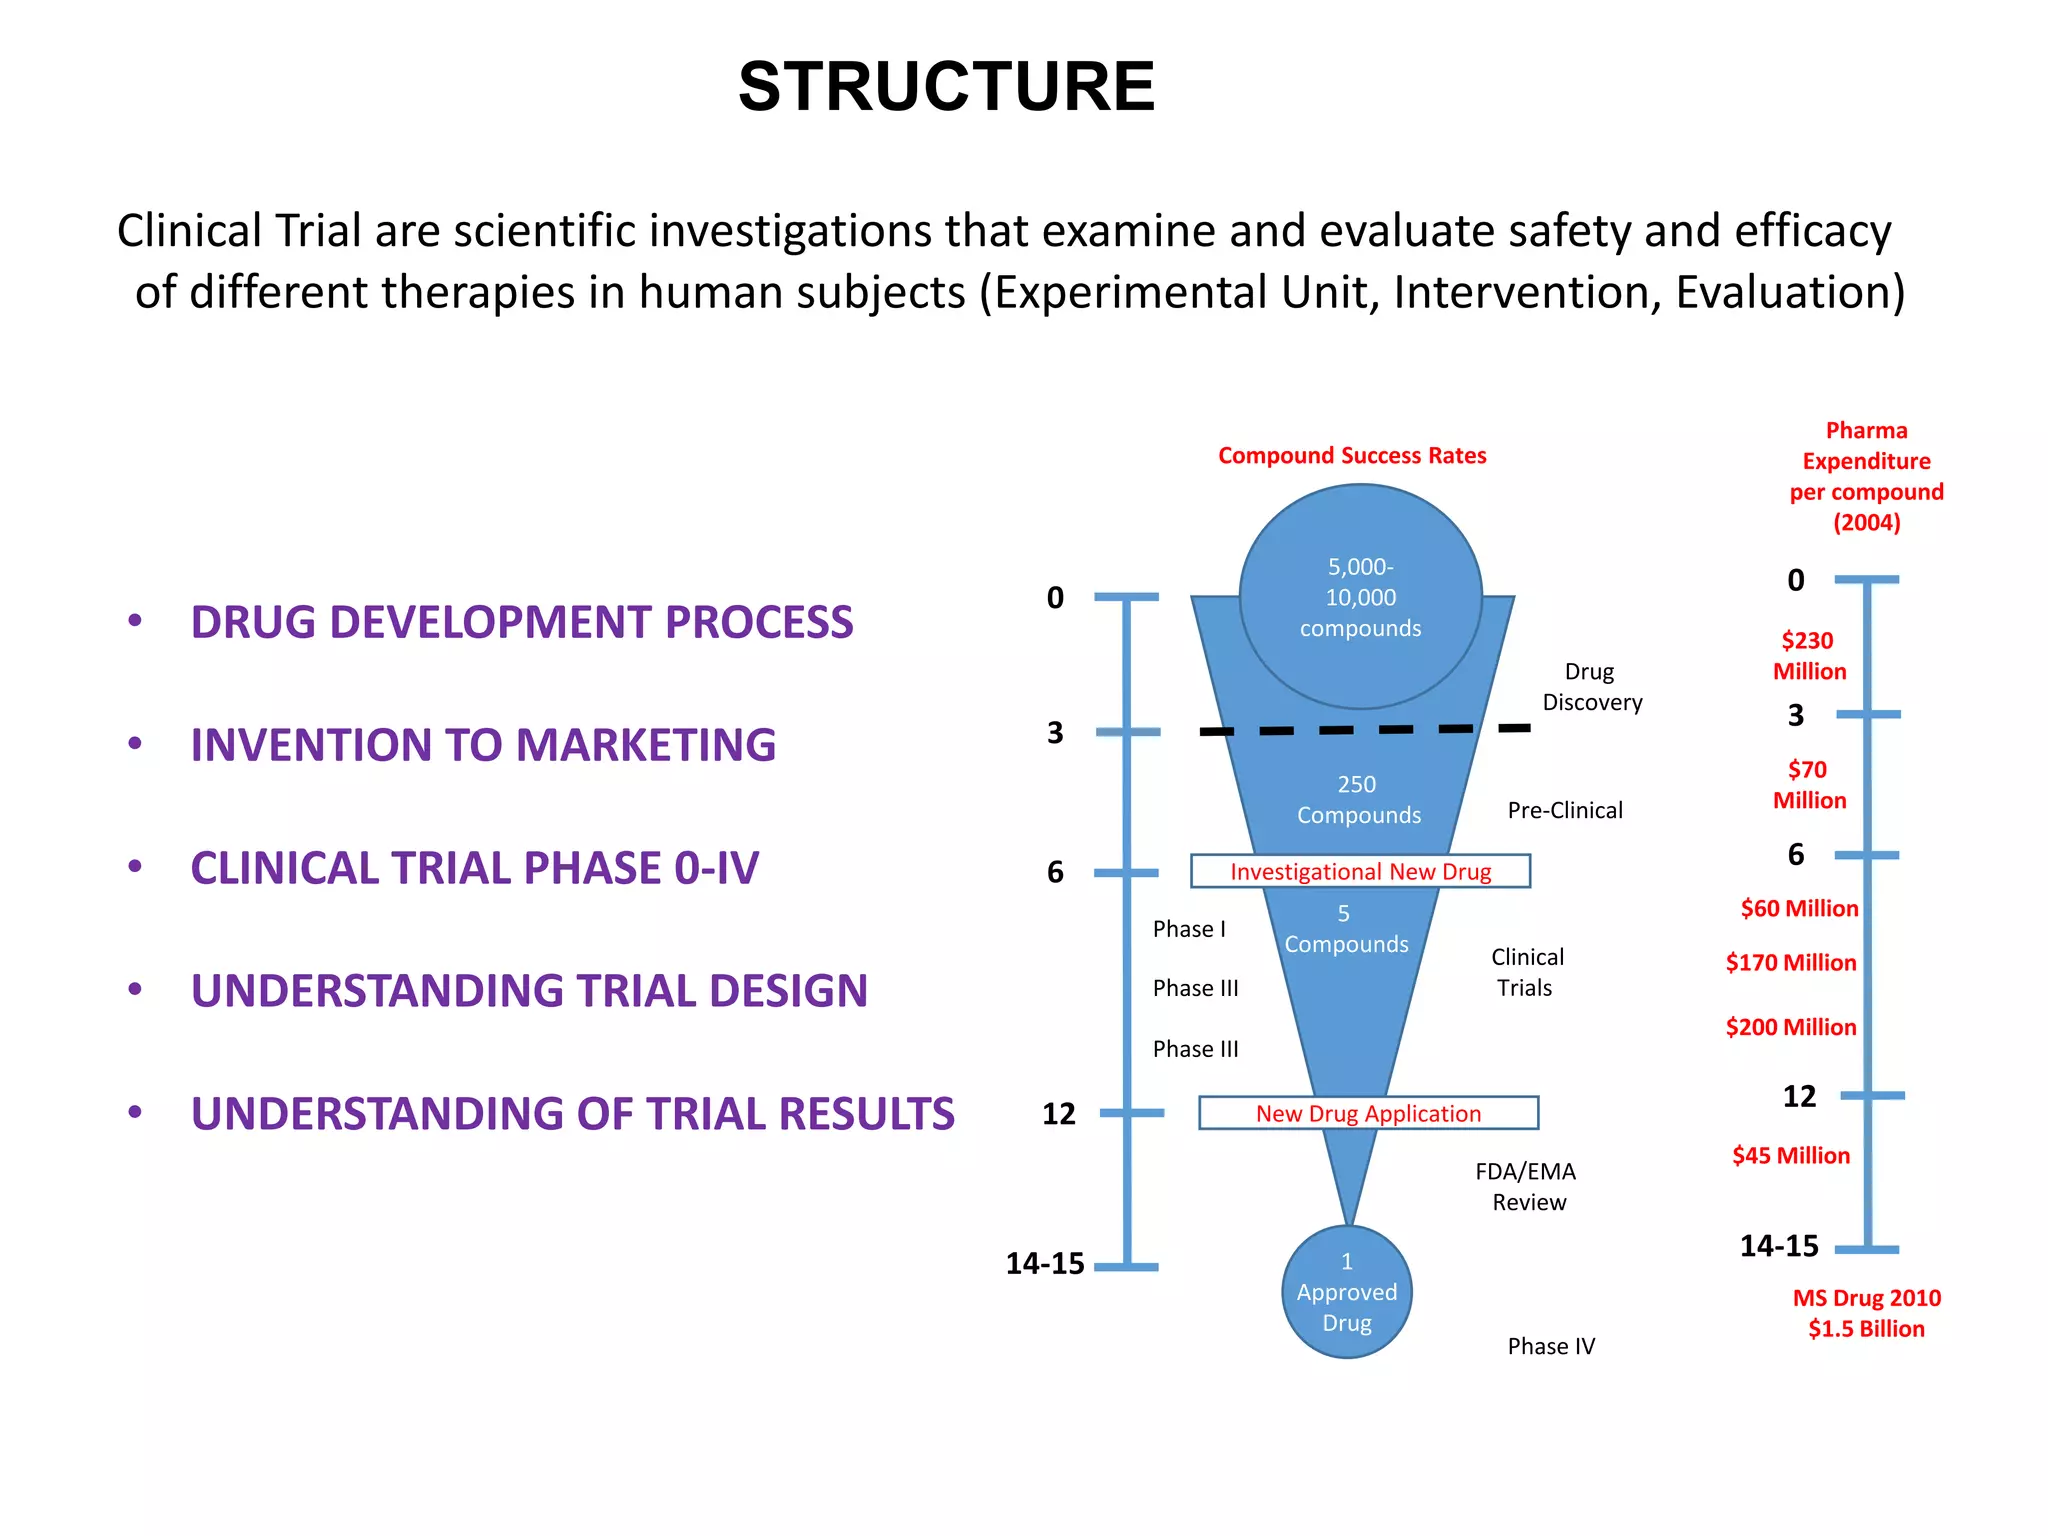
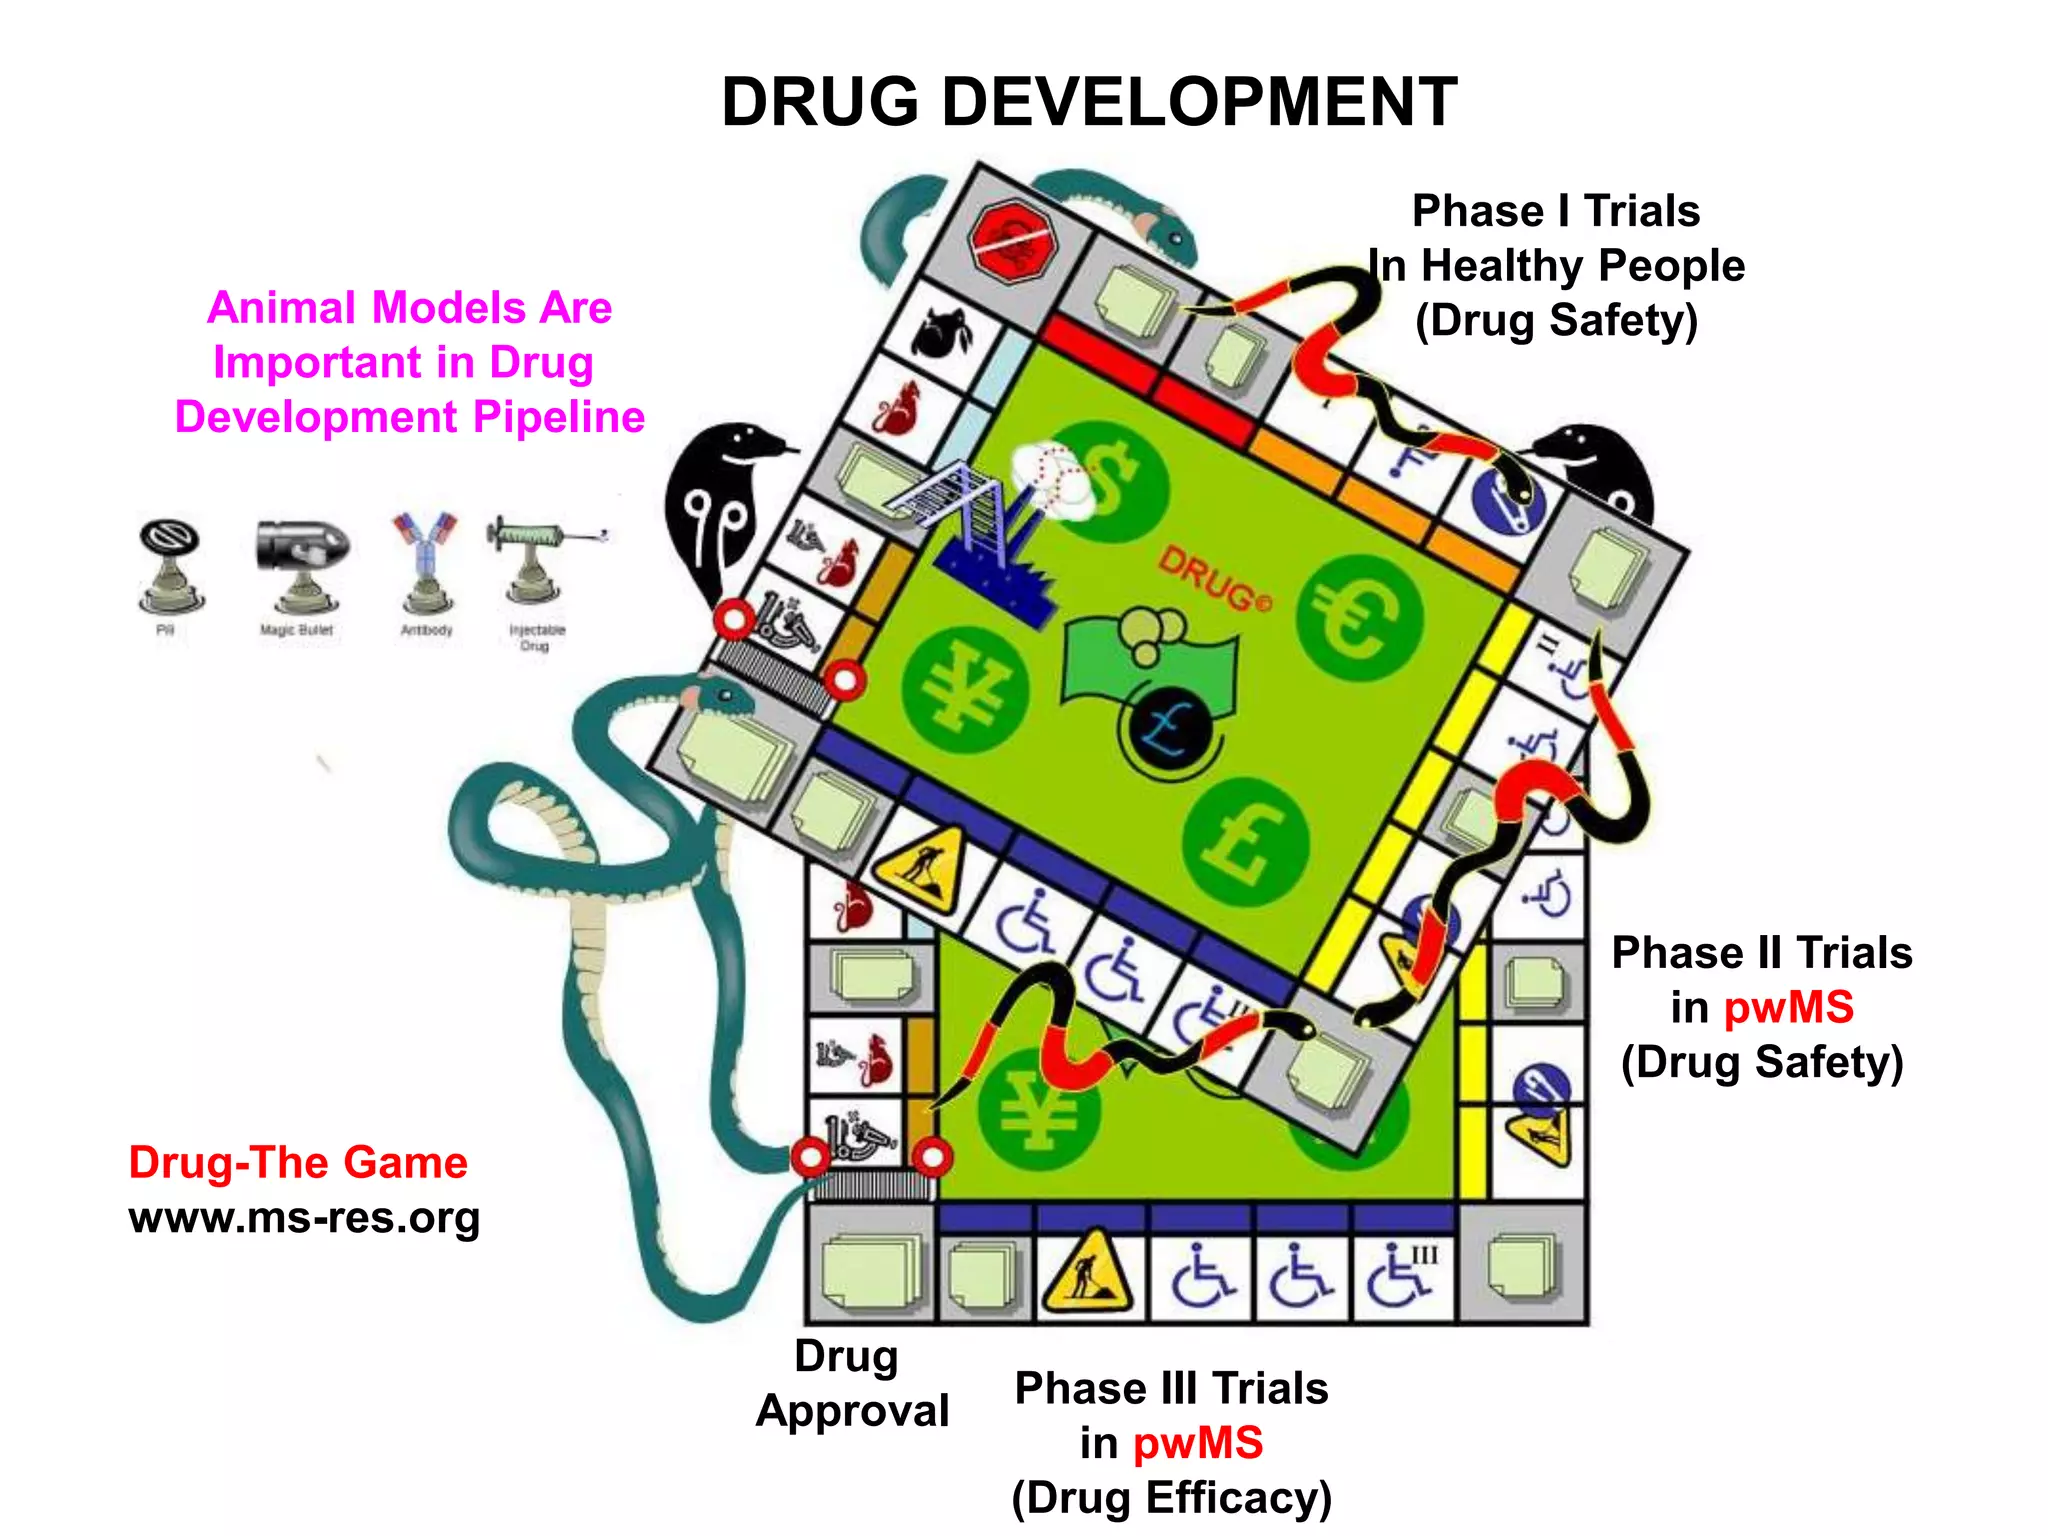
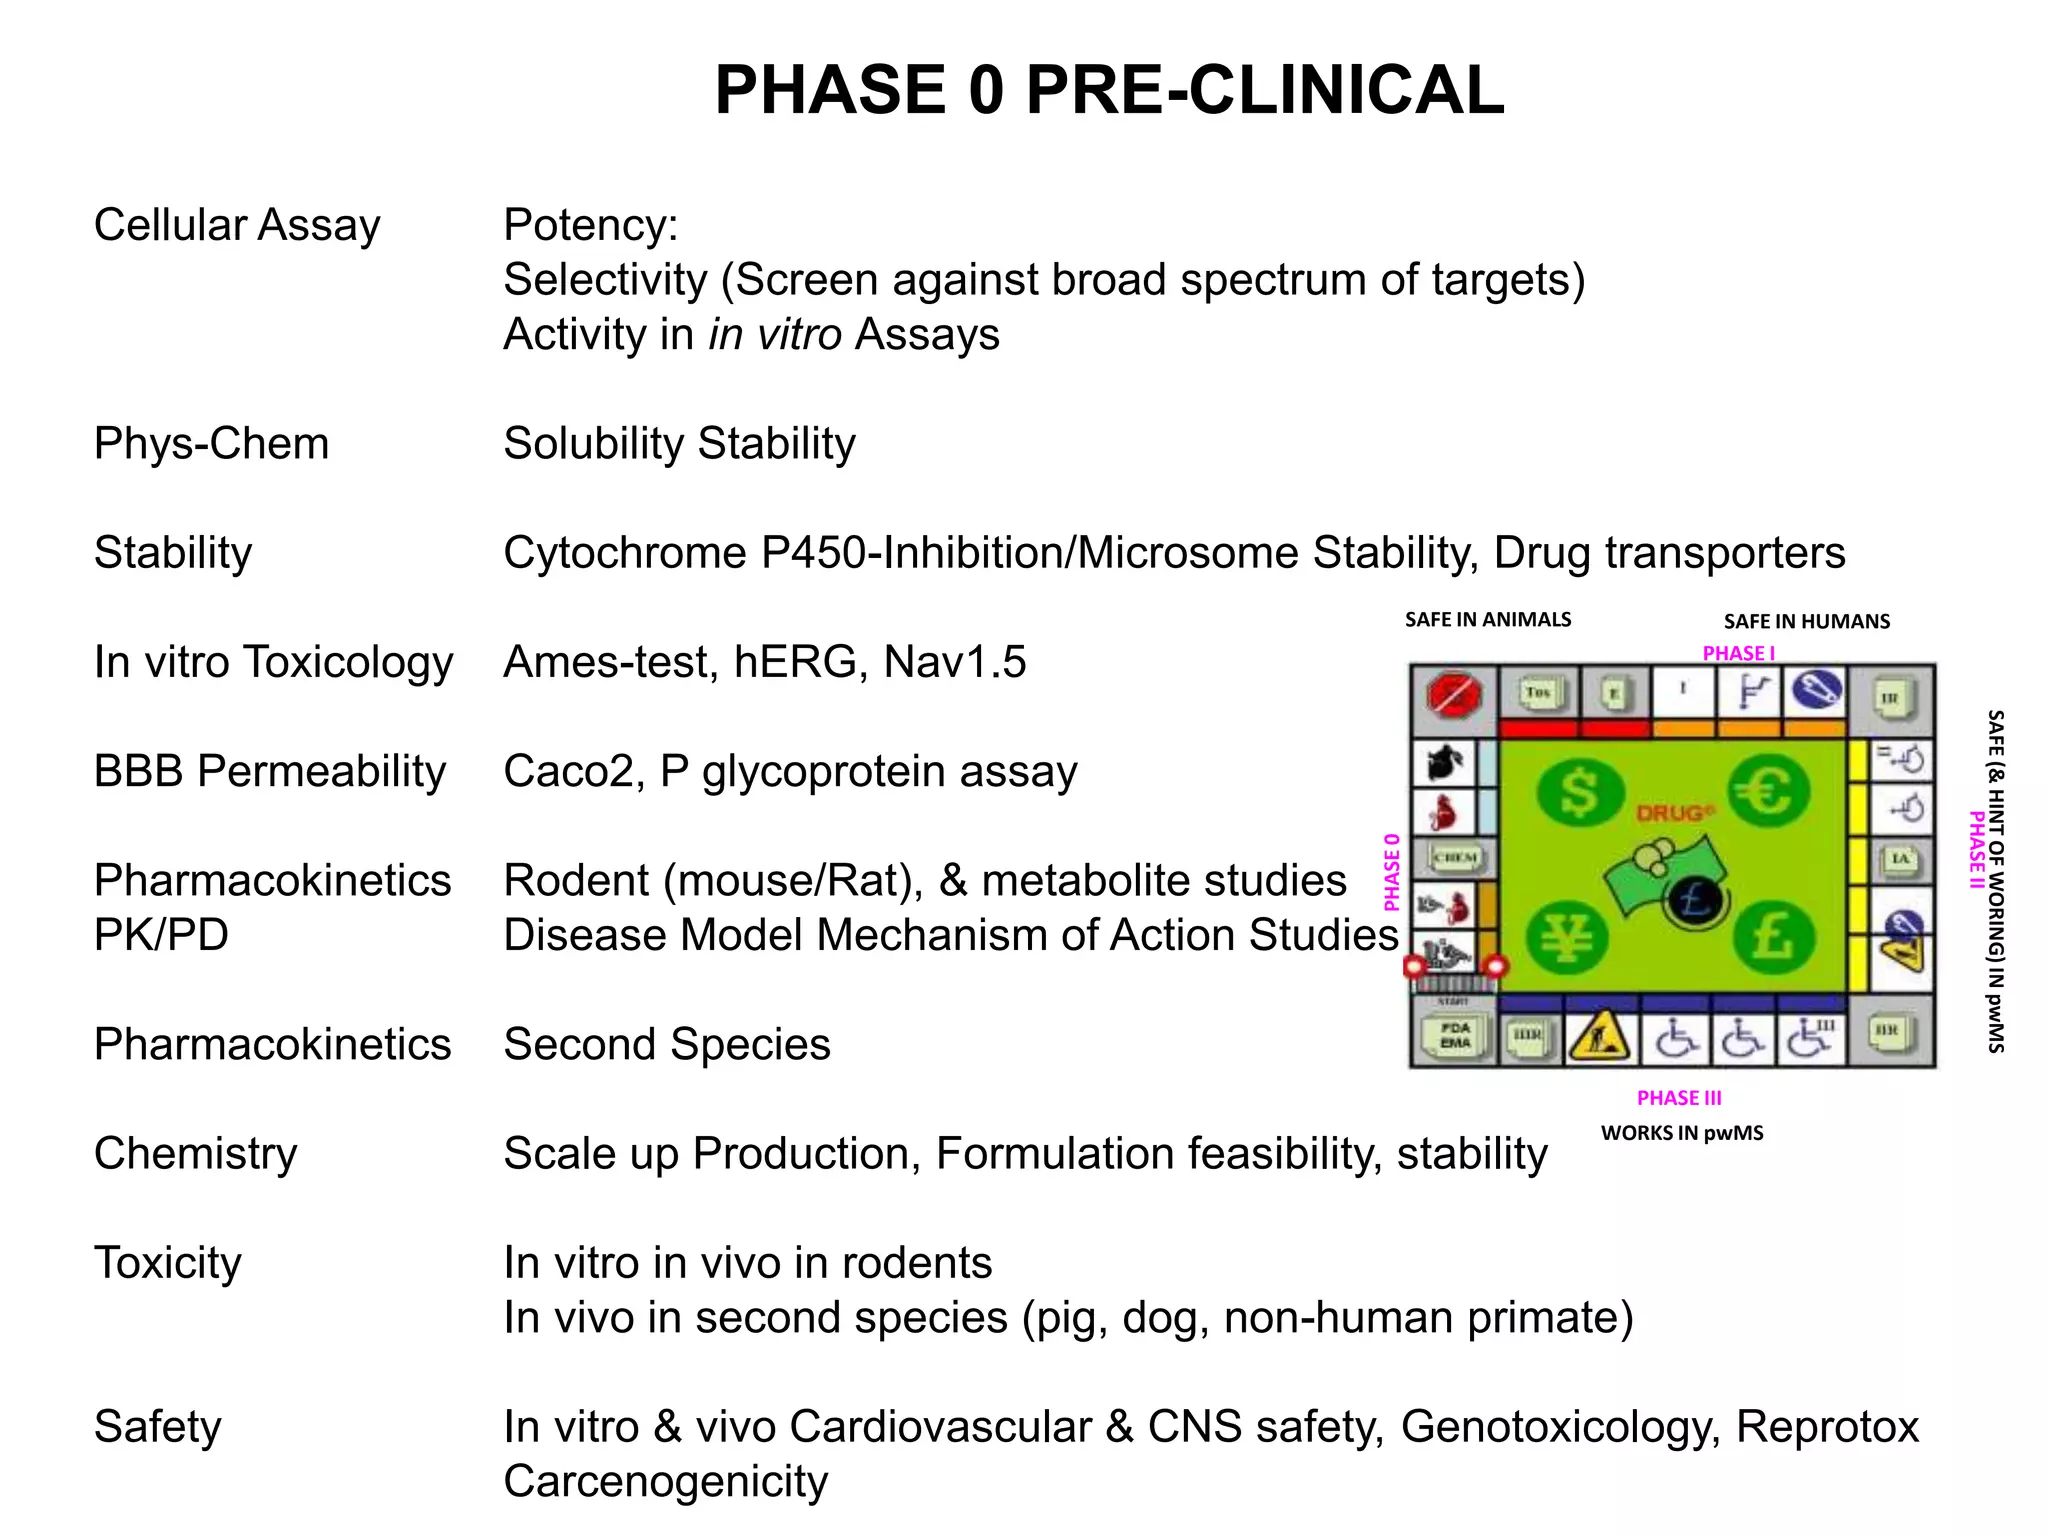
Understanding Clinical Trials
Prof. David Baker
david.baker@qmul.ac.uk
• DRUG DEVELOPMENT PROCESS
• INVENTION TO MARKETING
• CLINICAL TRIAL PHASE 0-IV
• UNDERSTANDING TRIAL DESIGN
• UNDERSTANDING OF TRIAL RESULTS
5,000-
10,000
compounds
Investigational New Drug
Pre-Clinical
Drug
Discovery
250
Compounds
Clinical
Trials
5
Compounds
1
Approved
Drug
New Drug Application
FDA/EMA
Review
3
6
12
14-15
0
Phase IV
Phase III
Phase III
Phase I
Compound Success Rates
3
6
12
14-15
0
$230
Million
$70
Million
$60 Million
$170 Million
$200 Million
$45 Million
MS Drug 2010
$1.5 Billion
Pharma
Expenditure
per compound
(2004)
STRUCTURE
Clinical Trial are scientific investigations that examine and evaluate safety and efficacy
of different therapies in human subjects (Experimental Unit, Intervention, Evaluation)
Animal Models Are
Important in Drug
Development Pipeline
Phase I Trials
In Healthy People
(Drug Safety)
Phase II Trials
in pwMS
(Drug Safety)
Phase III Trials
in pwMS
(Drug Efficacy)
Drug-The Game
www.ms-res.org
Drug
Approval
DRUG DEVELOPMENT
DRUG DISCOVERY
Identifying a Drug Target.
Most Drugs work by interacting with a TARGET MOLECULE (receptors/channels)
AGONISTS Stimulate the Target
ANTAGONISTS Block the Target
New drugs discovered by: Trial & Error
Serendipity
Rational Drug Design
Ligand-based Drug/Indirect Drug Design.
Knowledge of other molecules that bind to target and minimal structural characteristics
needed to bind to targets are defined.
Structure-based Drug Design
Relies on 3-D knowledge of the three dimensional structure of the biological target
DRUG DISCOVERY
Identifying a Drug Target. Most condition as due to defects in biochemical pathways
Identifying the target is the start of the drug discovery programme
Developing a Bioassay: A bioassay is devised to measure effects of a drug.
Screening drugs in the bioassay. Drug must clear this step
Establishing Effective and Toxic Doses: Provides clues for doses in humans
Investigational New Drug (IND) Filing
Spasticity & Tremors
Develop
• PRE-CLINICAL FAILURE
• Model does not reflect human disease biology
• Drug does not target biology relevant to human application
• Lack of appreciation of human disease
• Dogma & overstating effect
• Model used in a way that does not reflect human indication
• Drug doses are not used in at physiological doses
• Drugs are not delivered in a way appropriate to how used in humans
• Studies are not transparent & not reproducible (Ineffective Study Design)
• CLINICAL FAILURE
• Lack of clear understanding of human pathology
• Drug is seldom investigated by scientists developing the Idea.
• Over-interpretation of significance of pre-clinical studies
• Drug is not used at a dose relevant to the pre-clinical studies
• Population does not respond as predicted. (Ineffective Trial Design)
• Dose-limiting side-effects
• Study Underpowered, too short or unrealistic expectations
• Measurement Instruments Inadequate Clinical Outcomes and Surrogate Markers
• Wrong Group of pwMS studied (IneffectiveTrial Design)
• Commercial Interests
Mechanism is all Important.
Relevance of Slight Delay of a Few Days, Slight Diminution
Prophylactic/Therapy
“Building Site Effect”
“Route & Timing”
“Placebo Effect”
Less Circuitry so Less Compensation Capacity
Non-Responders
Immune (T/B cell) or Neurodegeneration
Professional Trialists
Reporting Issues
FAILURE TO TRANSLATE ANIMAL STUDIES TO MS
PATENT
A patent is a set of exclusive rights granted by a state to an inventor for a limited time
(Usually 20 years from the filing date) in exchange for public disclosure of an invention.
Prevent Others from commercially exploiting the Invention
Patents are “prosecuted” by Patent Examiner and rejected or Granted
Invisible for 18 months from filing.
When published it becomes Prior Art and enters the Public Domain
A granted patent application must include one or more Claims that define the Invention
Patents should demonstrate: Novelty,
Usefulness
Non-obviousness by someone skilled in the Art
European Patent Office: https://www.epo.org/searching/free/espacenet.html
Patents are filed and Paid Country by Country and need to be translated
Patents are subject to Renewal Fees to keep the patent in force
(USA Fees due 3½, 7½ and 11½ years after grant of the patent, UK yearly after year 4).
GENERICS
After Patent Protection is lost Competitors Make Generics
A generic drug is a (small molecule) drug defined as "a drug product that is comparable to a
brand/reference listed drug product in dosage form, strength, quality and performance
characteristics, and intended use.
Generic Biopharmaceuticals are known as biosimilars
Biosimilars are typically more expensive to make than small molecules and so price does not
drop too much.
Brand Product Generic
Betaseron Extavia (about $3,500 p.a. cheaper)
Copaxone (one & day) Glatopia
Gilenya Patent Expires US 2019
PHASE 0 PRE-CLINICAL
Cellular Assay Potency:
Selectivity (Screen against broad spectrum of targets)
Activity in in vitro Assays
Phys-Chem Solubility Stability
Stability Cytochrome P450-Inhibition/Microsome Stability, Drug transporters
In vitro Toxicology Ames-test, hERG, Nav1.5
BBB Permeability Caco2, P glycoprotein assay
Pharmacokinetics Rodent (mouse/Rat), & metabolite studies
PK/PD Disease Model Mechanism of Action Studies
Pharmacokinetics Second Species
Chemistry Scale up Production, Formulation feasibility, stability
Toxicity In vitro in vivo in rodents
In vivo in second species (pig, dog, non-human primate)
Safety In vitro & vivo Cardiovascular & CNS safety, Genotoxicology, Reprotox
Carcenogenicity
WORKS IN pwMS
PHASE I
PHASE III
PHASEII
PHASE0
SAFE IN HUMANSSAFE IN ANIMALS
SAFE(&HINTOFWORING)INpwMS
ADME STUDIES
Liberation: Release of the drug from the pharmaceutical formulation
Absorption: Process of Drug Entering the Blood Circulation
Bioavailability that influence routes of administration
Distribution: Dispersion or dissemination of substance throughout the fluids and
tissues of the body and Blood Brain Barrier Permeability
Metabolism: Biotransformation or Inactivation.
Drug-metabolism by cytochrome p450 enzymes
Excretion: Removal of the compounds and their metabolites from the Body
Kidneys (products excreted in urine)
Gut (Biliary or Faeces excretion)
Lungs (gases
PHASE 0 PRE-CLINICAL
TOXICOLOGY STUDIES
INVESTIGATIONAL NEW DRUG (IND) Filing to get permission to text drug in
humans
International Conference on Harmonisation (ICH) of Technical Requirements for
Registration of Pharmaceuticals for Human Use
Brings together Drug Regulatory Authorities of pharmaceutical industry of Europe,
Japan & USA
• Prevents duplication of Trials in humans
• Streamlines the regulatory Assessment process for new Drug Applications
• Reducing the development times for drug development
Guidelines
Quality Guidelines: Pharmaceutical QC based on Good Manufacturing Practice
Safety Guidelines: Safety Guidelines to uncover potential Risks
Efficacy Guidelines concerning Design conduct , safety and reporting of clinical trials
Good clinical Practice
Multidisciplinary Guidelines cross cutting topics e.g. medical terminology
Trial Is conducted in compliance with a protocol that has received prior ethical
Review
CLINICAL TRIALS
PHASE 0 TRIAL
Phase 0 trials can be the first-in-human trials in human subjects.
Microdosing: Single sublethal doses administered to a small group (e.g.10-15) healthy
• Pharmacokinetics in humans instead of relying on animal data
Low doses unlikely to lead to side effects
Time course of drug plasma concentrations over 96 hours following oral administrations every 24 hours (τ). Absorption half-
life 1 h, elimination half-life =12h. Note that in steady state and in linear phamacokinetics AUCτ=AUC∞. Steady state is reached
after about 5 × 12 = 60 hours.
PHASE I TRIAL
Phase I trials are usually the first stage of testing in human subjects.
Normally, a small group (e.g.20–100) healthy volunteers will be recruited.
• Safety (Pharmacovigilance)
• Tolerability,
• Pharmacokinetics (PK. What the Body Does to the Drug. ADME)
• Pharmacodynamics (PD. What the Drug does to the Body. E.g. blocking target)
Dose Ranging (Dose Escalation)
Phase I trials: 0ften include healthy volunteers.
Sometimes in people with Disease
Volunteers are paid an inconvenience fee for their time spent in the volunteer centre.
Pay depends on length of participation.
Phase 1a Single Ascending Dose (SAD) (Maximum Tolerated Dose)
Phase 1b Multiple Ascending Dose (MAD)
Food Effect. Influence of Feeding
PHASE II TRIAL
Once Dose or Range of Doses Identified
Phase II trials are the first stage of testing in human subjects with Disease (pwMS).
Normally, a larger group (e.g.100–300/group) people with Disease recruited.
• Safety (Pharmacovigilance)/Toxicity
• Tolerability,
• Efficacy
• Pharmacokinetics/Pharmacodynamics sometimes
Size informed by Past Studies
Phase IIa Designed to assess dosing requirements
Phase IIb Designed to study efficacy at the prescribed doses.
WORKS IN MSers
PHASE I
PHASE III
PHASEII
PHASE
0
SAFE IN HUMANSSAFE IN ANIMALS
SAFE(&HINTOFWORING)INMSers
PHASE III TRIAL
Phase III (Pivotal) trials are the final stage of testing in human subjects with Disease (pwMS)
prior to licensing. They are designed to show effectiveness in clinical practise
Normally, a large group (e.g.300–1000/group) people with Disease recruited.
They are often randomised, multi-centre studies
• Safety/Tolerability
• Efficacy
• Pharmacokinetics/Pharmacodynamics/Pharmacogenomics done sometimes
Size informed by Phase II Studies
Phase IIIb Extension Study of Phase III.
People continue taking drug whilst licencing in progress, placebo arm switch to active drug.
Extra safety/Efficacy Data.
TWO phase III Trials Required to Replicate the efficacy/safety data.
Regulators like to see evidence of a dose-response
NEW DRUG APPLICATION (NDA) to Regulators where Sponsors suggest new pharmaceutical
for sale and marketing.
REGULATORY AUTHORITIES
MHRA: Medicines and Healthcare Products Regulatory Agency
EMA: European Medicines Agency
FDA: Food & Drug Administration in USA
NICE National Institute of Health and Clinical Excellence
COST EFFECTIVENESS ASSESSMENTS
Quality-adjusted life-year (QALY) is a measure of disease burden including the quality and
quantity of Life. The QALY is based on the number of years of life that would be added by
the intervention
Suggested Limit for Cost effectiveness is about £30,000/QALY
SATIVEX: £49,300/QALY in UK (Lu et al 2012)
FAMPYRA: £160,000/QALY in UK
REGULATORY AUTHORITIES
ANTI-INFLAMMATORY DRUGS FOR MS
INDUCTION
Lemtrada
ESCALATION
First Line
Avonex
Betaseron
Extavia
Rebif
Copaxone
Aubagio
Tecfidera
Second Line
Gilenya
Tysabri Increasing
Efficacy/
Side-Effect Risk
RRMS = Considered Cost-Effective
Most PPMS/SPMS = Considered Non Cost-Effective
CHOICE
No
Evidence of
Disease
Activity
REGULATORY AUTHORITIES
UK First Line
USA Third Line
NO-EVIDENCE OF DISEASE ACTIVITY
NEDA-4
NO BRAIN ATROPHY
NEDA-5/6
NO NEUROFILAMENTS IN
CSF (NERVE BREAK DOWN)
NO COGNITIVE DYSFUNCTION
No
Evidence of
Disease
Activity
THERAPEUTIC TARGETS
NEDA
NO RELAPSES
NO GADOLIUM ENHANCING
LESIONS
NO PROGRESSION OF
DISABILITY
PHASE IV STUDIES
Phase IV trials are known as Post-Marketing Surveillance after the drug is approved to be
sold and is used in medical practise.
Normally, data is collected from people using the drug
• Safety/Tolerability (pharmacovigilance).
Identify low prevalence/long-term side-effects
• Conditions in trials may differ from those in clinical practise
• Trial Duration is limited (2 years)
• Drug Interactions
CLINICAL PRACTISE
LICENSED
PRODUCT FOR
CANCER
NEW USE IN MS
REPURPOSING
REPURPOSING FOR RRMS –LICENCED OPTIONS AVAILABLE
(AZATHIOPRINE AS GOOD AS BETA INTERFERONS)
REPURPOSING FOR PPMS/SPMS-NO LICENCED OPTIONS AVAILABLE
patent
THE PHARMA WAYREPURPOSING
THEIR OWN DRUGS
SCIENCE INNOVATION: IDENTIFY TARGETS
LEAD TO PATENTS & COMMERCIAL DEVELOPMENT
CLINICAL INNOVATION: IDENTIFY TARGETS FOR PHARMA EXPLOTATION
IDENTIFTY TARGETS FOR PHARMA REPURPOSING
LEAD TO PATENTS & COMMERCIAL DEVELOPMENT
IDENTIFY METHODS TO DETECT EFFICACY
RAPID PHASE II DESIGN
ROBUST TRIAL DESIGN
SUPPORT THE CASE FOR A CHANGE IN REGULATION
THE ACADEMIC WAYREPURPOSING
REGULATORS: BARRIERS CREATED FOR PHARMA-HARD TO ACHIEVE FOR ACADEMICS
FUNDERS: FINANCING TWO PHASE III DEVELOPMENT PLANS & REGULATORS DIFFICULT
GOVERNMENT: NOT CREATING INCENTIVES/STRUCTURES
Maximum Funding for Academic Trial = £2-4,000,000
New DMT due to Academic Led Trials Unlikely
DMT cost for Comparator (current cost £12,000 per person) v Test
e.g. Trial of 500 people = £6,000,000
Speak to EMA =£>30,000 MHRA = £>3,000 (hour consultation)
Holding Licence = >£100,000
Trial Monitoring & Regulatory Submission. Pharma may pay >£50,000,000
In EU should not prescribe off-label if there is Licenced alternative
OFF-LABEL prescription for untreated conditions possible
THE ACADEMIC WAYREPURPOSING
DESIGN OF TRIAL
PATIENT POPULATION: Ensure that participants are similar to reduce variability of Results
Inclusion Criteria
Exclusion Criteria
CONTROL: Treatment is Against Placebo or Active comparator
Superiority Trial (Active Test Drug is better than placebo or Active Comparator)
Non-Inferiority Trial (Active Test Drugs is no worse than highly active Comparator)
OBJECTIVES/ENDPOINTS: Defined Primary Endpoints/Secondary Endpoints.
If Primary Endpoints are not Achieved Trial is a Failure
If Primary Endpoints are not Achieved by Secondary Endpoints Achieved Trial is a Failure
and New trial will need to be done with the Secondary endpoints of the first trial now the
Primary endpoints in the second trials
BIAS ELIMINATION: Randomisation & Blinding of pwMS and monitoring Neurologist
SAMPLE SIZE Big enough to show effect small enough to limit exposure of humans to drug
That could be dangerous
ENDPOINTS IN MS TRIALS
CLINICAL
• ANNUALISED RELAPSE RATE (ARR): NUMBER OF RELAPSES DIVIDED BY THE TRIAL DURATION
ARR =1 = 1 relapse a year ARR = 0.1 = 1 Relapse every ten years
• DISABILITY PROGRESSION (TIME TO EDSS INCREASE)
MAGNETIC RESONANCE IMAGING
• T1-GADOLINIUM ENHANCING LESIONS = ACTIVE BLOOD BRAIN BARRIER BREAKDOWN
• T1 BLACK HOLES = MEASURE OF NERVE DAMAGE & GLIOSIS
• T2 LESION VOLUME = MEASURE OF LESION LOAD
• BRAIN ATROPHY = VOLUME OF THE BRAIN = NERVE LOSS + OEDEMA + GLIOSIS
• SPINAL CORD ATROPHY = VOLUME OF THE SC = NERVE LOSS + OEDEMA + GLIOSIS
• MTR =MAGNETIZATION TRANSE RATI0 = (LOOSE) MEASURE MYELIN LOSS
• N-ACYTEL ASPARTATE (NAA) = (LOOSE) MEASURE OF NERVE LOSS
QUALITY OF LIFE (QoL) QUESTIONAIRES
• MULTIPLE SCLEROSIS IMPACT SCALE (MSIS-29)
DESIGN OF TRIAL
TITRATION (INCREASING DOSE) DESIGNS
CROSS-OVER DESIGN: Each person acts as their own control (Reduces number of people)
PARALLEL GROUP: Each person gets only one treatment control verses Test
Randomization
Test
Control
Test Control
TestControl
Wash-Out
CROSS-OVER DESIGN PARALLEL GROUP
SAMPLE SIZE CALCULATION
SAMPLE SIZE Big enough to show effect small enough to limit exposure of humans to drug
that could be dangerous
Sample size = Capacity to predict the correct result (Power) with a probability of the result
being significant for a certain effect size of the treatment.
POWER or Sensitivity is the probability that the test correctly rejects the null hypothesis
(that there is no difference between groups) when the alternative hypothesis (There is a
difference between groups) is true.
As the power increases, there are decreasing chances of a Type II Error (False Negative) and
Type I (False positives) Errors. In trials an 80% power is often used although this is increased
to 90% in some phase III trials
PROBABILITY. (e.g. P=0.05. There is a one in twenty chance of getting this result by chance so
if the level is set a P=0.001, it would be a one in a thousand chances)
EFFECT SIZE. How much is effect is the drug going to have a 10% reduction or a 60%
reduction the smaller the effect the larger sample size
BIAS REDUCTION
RANDOMIZATION
Process by which people are allocated to an intervention
after assessment eligibility
• It eliminates selection bias
• It eliminates confounding issues by adjusting co-variants
(gets same demographics in test and control groups)
• Facilitates Blinding of investigators, participants, and assessors
BLINDING/MASKING
Individuals withheld the knowledge of the treatments
OPEN LABEL No Blinding
SINGLE BLIND pwMS unaware of their Treatment
DOUBLE BLIND Neuro & pwMS unaware of their treatment
TRIPLE BLIND Neuro & pwMS and Assessor unaware of treatment
1. TITLE & ABSTRACT
2. BACKGROUND & OBJECTIVES
3. TRIAL DESIGN
4. PARTICIPANTS (Eligibility)
5. TREATMENT
6. OUTCOME MEASURES
7. SAMPLE SIZE CALCULATION
8. RANDOMIZATION METHOD
9. ALLOCATION OF RANDOMISATION
10. IMPELEMENTATION OF RANDOMISATION
11. BLINDING
12. STATISTICS
13. PARTICIPANT FLOW RESULTS
14. RESULTS-RECRUITMENT
15. RESULTS-BASELINE DEMOGRAPHICS
16. RESULTS-NUMBERS- HOWMANY PEOPLEIN EACH GROUP
17. RESULTS-OUTCOMES
18. RESULTS ADDITIONAL ANALYSIS
19. RESULTS-SIDE EFFECTS
20. DISCUSSION-LIMITATIONS
21. DISCUSSION- GENERALISABILITY (VALIDITY)
22. DISCUSSION- INTERPRETATION
23. REGISTRATION (www.clinicaltrials.gov)
24. SOURCE OFPROTOCOL
25. FUNDING
CONSORT GUIDELINES FOR REPORTING
DESIGN OF TRIAL
Checklists of Reporting Items
Improve Transparency and
Replication
Ensure critical appraisal and
interpretation
http://www.consort-statement.org/
DEMOGRAPHICS: Comparing Like for Like (Sex, Age, History)
SAMPLE SIZE Power to Detect Change
Too Small- Miss Important Events
Too Large-Extra Cost/Risk to People in Study
BIAS REDUCTION:
•RANDOMIZATION: Methods to Achieve this. Was it achieved?
•BLINDING (Single Blind/Double Blind)
METHODS OF Is the correct analysis used?
ASSESSMENT
OUTCOMES: Are they fit for purpose?
Are the Outcomes Responsive?
Control Response (Placebo Effect)
COMPLIENCE Drugs don’t work if people do not take them
SIDE-EFFECTS Tolerability
*
*
*
CONSORT GUIDELINES FOR REPORTING
DESIGN OF TRIAL
Assessment for Eligibility
Randomization
Allocated to Intervention
Received Intervention
Follow Up
Analysed
Did Not Receive
Lost to Follow Up
Not Analysed
Allocated to Intervention
Received Intervention
Follow Up
Analysed
Did Not Receive
Lost to Follow Up
Not Analysed
Excluded
TEST CONTROL
CONSORT GUIDELINES FOR REPORTING
DESIGN OF TRIAL
TRIAL REGISTRATION
www.clinicaltrials.gov (US-based Repository of Clinical Trials)
NCTxxxxxxxx
https://www.clinicaltrialsregister.eu/ctr-search/search (EU Trial Register)
EudraCT Number = Year- xxxxxx-xx
• REGISTRATION SHOULD OCCUR PRIOR TO BEGINNING STUDY
TRIAL DESIGN
TRIAL ENDPOINTS
TRIAL SITES
All Changes are Logged
28,229/89,204 (31.7%) registered studies had their primary outcome changed.
10,623/40,615 (26.2%) had their primary outcome changed after the study completion date.
Ramagopalan SV et al. F1000Res. 2014; 3: 77.
Changes to Primary Outcomes after trial Completion Data were associated with a statistically
significant primary outcome report. Ramagopalan SV et al. F1000Res. 2015; 4: 80.
• LIMIT DUPLICATION
• CREATE EXSISTENCE OF A TRIAL (IMPORTANT FOR NEGATIVE STUDIES)
• MINIMISE USE OF ANIMAL TESTING WITHOUT COMPROMISING SAFETY
Data Dredging for significant results = P hacking
EVIDENCE-BASED MEDICINE/EVIDENCE BASED PRACTISE
Class 1(A). Evidence from a well designed randomised controlled trial
of appropriate size. Systematic review of trials. e.g. Cochrane
Collaboration Reviews (www.cochrane.org/)
Class 2(B). Evidence from a well designed intervention study without
randomisation. A common research design is the before-and-after
study.
Class 3(C). Evidence from a well designed non-experimental
study e.g. cohort, case-control or cross-sectional studies. (Also
include studies using purely qualitative methods) E.G. (cost-
effectiveness studies).
Class 4(D). Opinions of respected authorities, based on clinical
evidence, descriptive studies or reports of expert consensus
committees
CLASS OF EVIDENCE
DATA HANDLING
Mean = Average (Rarely used in Trials)
Standard Deviation = Approximation of Variability 1.96SD contains 95% of sample
Standard Error (Square Root of SD) place were mean will occur in 95% of studies
Median = Middle Number
Range = Top – Bottom result
Quartile= 0, 25, 50, 75,100%
Percentile = 1-100th division
Confidence Interval 95% CI = 95% that mean will be with in limits
ANALYSIS
Proportions: Chi-Square
Two Groups: t test, Mann Whitney U
Many Groups: ANOVA, kursall and Wallace
Is data Normally Distributed are the Variances Equal
If not use non-parametic stats
DATA ANALYSIS
BIOLOGICALLY SIGNIFICANT
A difference between groups that has a real impact on biology
STATISICALY SIGNIFICANT
Mathematical Measure of a difference between groups. Does this occur at a
level greater than may be expected by chance.
PROBABILITY VALUES
Likelihood of obtaining a statistical result by chance, assuming there is no
Difference in the results (null hypothesis) being investigated
P=0.05 is 1 in twenty chance of event occurring
P=0.01 is 1 in one hundred chance of event occurring by chance
P=0.001 is 1 in one thousand chance of event occurring by change
Less Likely due
to chance
DATA ANALYSIS
PRESENTATION OF DATA
PIE CHARTS
These show the proportions of response, seldom used in trials, but may
occur in Marketing material
A (50%)
B (25%)
(4%)
D
(21%)
C
BAR CHARTS
These show the magnitude of the response/outcome
PRESENTATION OF DATA
Treatment A Treatment B
Count
Bar Chart
0
Measurement (Units)
Frequency(%)
Histogram
10 20 30 40 50
WATERFALL PLOT
This graph represents each patient individually (e.g. looking at response rate
status of each patient whether progression stabilization of improvement
PRESENTATION OF DATA
LINE GRAPHS
These show the analysis over a period of time (serial analysis)
PRESENTATION OF DATA
KAPLAN-MEIER SURVIVAL CURVE
The curve represents the proportion of the study population that are free of
the event (Progression, Time to relapse etc ) as successive times.
i.e Time to an event
Commonly used to represent overall efficacy.
The larger the difference in the curves the larger the difference
PRESENTATION OF DATA
HAZARD RATIO
The Hazard Ratio is the Relative Risk of the Event (e.g. Disease progression)
happening in one arm of a trial compared to another over the time of the trial
arm difference between groups that has a real impact on biology
Hazard Ratio = 1 means there is no difference
Hazard Ratio = 2 means there is twice/double the risk
Hazard Ratio = 0.5 means there is half the risk. Reduced risk by 50%
This methodology uses all available information, including people who didn’t
complete the study
DATA ANALYSIS
CONFIDENCE INTERVAL (CI)
The CI Percentage indicates the certainty that a result will fall into a
range of results noted by lower and upper limits
HR 0.55 (95% CI 0.40-0.77) The risk of converting to clinically definite
MS is reduced by 45% with estimates ranging from 60% reduction to 23%
reduction and 95% certainty that the result would lie between 23% and 60% risk
Reduction
The narrower the range the more precise the result.
The CI are used as an indication how a study would be reflected in the
general population
DATA ANALYSIS
PRESENTATION OF DATA
SCATTER GRAPH (Relationships)
Individual data points are plotted showing two variables (e.g. height verses
weight) to show relationships
Random Positive relationship Negative relationship
Unrelated
Unrelated
Subset
PRESENTATION OF DATA
SCATTER GRAPH (Relationships)
PRESENTATION OF DATA
REGRESSION (Relationships)
Spearman's rank correlation coefficient is a non-parametric measure of stastical
dependence between two variables. It assesses how well the relationship between two
variables can be described.
R= +1 perfect Correlation or R = −1 perfect inverse correlation.
R-squared is a statistical measure of how close the data are to the fitted linear regression
line. It is the percentage of the response variable variation that is explained by a linear
model. Or: R-squared = Explained variation / Total variation (It s between 0 and 100% or
0 to 1:)
90% explained40% explained
PRESENTATION OF DATA
BOX & WHISKER PLOT
Rather than show all the distribution of individual data. The data is
presented as a box with the whisker indicating deviation.
FOREST PLOT
Following meta-analysis of a number of different trials some showing
benefit some not showing for treatment or for analysis of subgroups within
a trial that may respond differently. A Forest plot is a way to compare
different groups of data.
PRESENTATION OF DATA
Size of square is proportional to
the importance of that data set
and the horizontal lines are the
confidence intervals
ABSOLUTE RISK REDUCTION (ARR)
The Difference between the number of events (e.g. pwMS who progressed)
in the test verses the control group.
e.g. Placebo progressed = 15% Test Drug = 10% progressed
ARR of the Test drug = 15%-10% = 5%
RELATIVE RISK REDUCTION (RRR). The RRR looks at the same difference
Between groups given different treatments but expresses the change in risk
As a proportion, rather than an absolute difference
e.g. RRR of Progression by Test drug = 15-10/divided by progression of control
15-10/15 = 5/15 = 33%
DATA ANALYSIS
NUMBER NEEDED TO TREAT (NNT)
The NNT is a statistic that tells one the actual number of pwMS that would need to
be treated with a given therapy for a one patient to get a particular endpoint benefit.
Determines whether Large number or small number of pwMS benefit.
The Lower the NTT the more effective the treatment.
ODDS RATIO.
A measure of treatment effectiveness. The OR is the odds of an event happening in
the treatment group expressed as a proportion of the odds of the event happening
in the control group.
OR close to 1 the smaller the difference in the treatment effect
If greater (or lesser) than 1, then the treatment is greater (or less) than the control
treatment.
DATA ANALYSIS
INTENTION TO TREAT (ITT) ANALYSIS
ITT analysis of the results of a trial is based on the initial treatment assignment and
not on the treatment eventually received. ITT analysis is intended to avoid various
misleading artefacts that can arise such as crossover loss of subjects, that may
break random assignment to the groups.
ITT analysis provides information about the potential effects of treatment policy
rather than on the potential effects of specific treatment.
ITT is also simpler than other forms of study design and analysis because it does
not require observation of Compliance status for units assigned to different
treatments or incorporation of compliance into the analysis.
Medical investigators often have difficulties in accepting ITT analysis because of
clinical trial issues like missing data
DATA ANALYSIS
Time
ChangeinBrainVolume
Placebo
Test
DATA ANALYSIS
MRI Outcome not fit for purpose: Trial Failed
Trial Not Long Enough: Trial Failed
50% of people were not taking drug: Trial Failed
Time
ChangeinBrainVolume
Placebo
Test
Rebaseline
DATA ANALYSIS
Rebaseline to allow for Pseudo atrophy
DATA ANALYSIS
Regression to the mean is the phenomenon that if a variable is extreme on
its first measurement, it will tend to be closer to the average on its second
measurement—and if it is extreme on its second measurement, it will tend to
have been closer to the average on its first.
In MS trials people are more likely to volunteer for trials if they are not doing
as well and natural history of disease will mean the flair resolves and they get
better
ADVERSE REACTIONS
Grade 1 Asymptomatic (no) or mild symptoms; for this grade of AE, treatment is
not indicated.
Grade 2 Moderate; for this grade of AE minimal, local or non-invasive intervention
may be indicated, for example, this might involve treating the symptom
(e.g. nausea and vomiting caused by a treatment
managed/prevented by giving the patient drugs to stop sickness, rather
than stopping the drug).
Grade 3 Severe but not immediately life-threatening; for such AEs hospitalization
and investigation/ management are often indicated.
Grade 4 Usually life-threatening consequences; for these AEs urgent intervention is
indicated.
Grade 5 Death related to AE.
NERVE LOSS
PROGRESSIVE MSRELAPSING-REMITTING MS
DISABILITY
Frequent inflammation, demyelination,
axonal transections, plasticity and
remyelination
Inflammation, Persistent
Demyelination & Gliosis
Infrequent inflammation, Gliosis,
Chronic Neurodegeneration
CLINICAL
THRESHOLD
INFLAMMATION
Symptoms
Clinical Effects are Due to Altered Nerve Conduction
CLINICAL COURSE
Immune Mediated
Beta-interferons, Aubagio, Alemtuzumab,
Cladribine,Bone Marrow Transplantation,
Natalizumab, Rituximab are ACTIVE
Neurodegeneration
Beta-interferon, Alemtuzumab,
Cladribine, Rituximab
Bone Marrow Transplantation,
Fingolimod, Natalizumab
are INACTIVE to stop Worsening
TREATMENT OF MS
FUTURE TRIALS
TREATMENT PYRAMID
STOP
SAVE
REPAIR
RESTORE
FUTURE TRIALS
CONCLUSIONS
DRUG DEVELOPMENT PROCESS IS COSTLY AND SLOW
Clinical Trials are mechanism to develop safe and effective treatments
Understanding the clinical trials allows you to Interpret the results
Knowledge allows you to see the flaws that may affect the interpretation
Knowledge allows you to put the details in context of other studies

Understanding Clinical Trials

  • 1.
    Understanding Clinical Trials Prof.David Baker david.baker@qmul.ac.uk
  • 2.
    • DRUG DEVELOPMENTPROCESS • INVENTION TO MARKETING • CLINICAL TRIAL PHASE 0-IV • UNDERSTANDING TRIAL DESIGN • UNDERSTANDING OF TRIAL RESULTS 5,000- 10,000 compounds Investigational New Drug Pre-Clinical Drug Discovery 250 Compounds Clinical Trials 5 Compounds 1 Approved Drug New Drug Application FDA/EMA Review 3 6 12 14-15 0 Phase IV Phase III Phase III Phase I Compound Success Rates 3 6 12 14-15 0 $230 Million $70 Million $60 Million $170 Million $200 Million $45 Million MS Drug 2010 $1.5 Billion Pharma Expenditure per compound (2004) STRUCTURE Clinical Trial are scientific investigations that examine and evaluate safety and efficacy of different therapies in human subjects (Experimental Unit, Intervention, Evaluation)
  • 3.
    Animal Models Are Importantin Drug Development Pipeline Phase I Trials In Healthy People (Drug Safety) Phase II Trials in pwMS (Drug Safety) Phase III Trials in pwMS (Drug Efficacy) Drug-The Game www.ms-res.org Drug Approval DRUG DEVELOPMENT
  • 4.
    DRUG DISCOVERY Identifying aDrug Target. Most Drugs work by interacting with a TARGET MOLECULE (receptors/channels) AGONISTS Stimulate the Target ANTAGONISTS Block the Target New drugs discovered by: Trial & Error Serendipity Rational Drug Design Ligand-based Drug/Indirect Drug Design. Knowledge of other molecules that bind to target and minimal structural characteristics needed to bind to targets are defined. Structure-based Drug Design Relies on 3-D knowledge of the three dimensional structure of the biological target
  • 5.
    DRUG DISCOVERY Identifying aDrug Target. Most condition as due to defects in biochemical pathways Identifying the target is the start of the drug discovery programme Developing a Bioassay: A bioassay is devised to measure effects of a drug. Screening drugs in the bioassay. Drug must clear this step Establishing Effective and Toxic Doses: Provides clues for doses in humans Investigational New Drug (IND) Filing Spasticity & Tremors Develop
  • 6.
    • PRE-CLINICAL FAILURE •Model does not reflect human disease biology • Drug does not target biology relevant to human application • Lack of appreciation of human disease • Dogma & overstating effect • Model used in a way that does not reflect human indication • Drug doses are not used in at physiological doses • Drugs are not delivered in a way appropriate to how used in humans • Studies are not transparent & not reproducible (Ineffective Study Design) • CLINICAL FAILURE • Lack of clear understanding of human pathology • Drug is seldom investigated by scientists developing the Idea. • Over-interpretation of significance of pre-clinical studies • Drug is not used at a dose relevant to the pre-clinical studies • Population does not respond as predicted. (Ineffective Trial Design) • Dose-limiting side-effects • Study Underpowered, too short or unrealistic expectations • Measurement Instruments Inadequate Clinical Outcomes and Surrogate Markers • Wrong Group of pwMS studied (IneffectiveTrial Design) • Commercial Interests Mechanism is all Important. Relevance of Slight Delay of a Few Days, Slight Diminution Prophylactic/Therapy “Building Site Effect” “Route & Timing” “Placebo Effect” Less Circuitry so Less Compensation Capacity Non-Responders Immune (T/B cell) or Neurodegeneration Professional Trialists Reporting Issues FAILURE TO TRANSLATE ANIMAL STUDIES TO MS
  • 7.
    PATENT A patent isa set of exclusive rights granted by a state to an inventor for a limited time (Usually 20 years from the filing date) in exchange for public disclosure of an invention. Prevent Others from commercially exploiting the Invention Patents are “prosecuted” by Patent Examiner and rejected or Granted Invisible for 18 months from filing. When published it becomes Prior Art and enters the Public Domain A granted patent application must include one or more Claims that define the Invention Patents should demonstrate: Novelty, Usefulness Non-obviousness by someone skilled in the Art European Patent Office: https://www.epo.org/searching/free/espacenet.html Patents are filed and Paid Country by Country and need to be translated Patents are subject to Renewal Fees to keep the patent in force (USA Fees due 3½, 7½ and 11½ years after grant of the patent, UK yearly after year 4).
  • 8.
    GENERICS After Patent Protectionis lost Competitors Make Generics A generic drug is a (small molecule) drug defined as "a drug product that is comparable to a brand/reference listed drug product in dosage form, strength, quality and performance characteristics, and intended use. Generic Biopharmaceuticals are known as biosimilars Biosimilars are typically more expensive to make than small molecules and so price does not drop too much. Brand Product Generic Betaseron Extavia (about $3,500 p.a. cheaper) Copaxone (one & day) Glatopia Gilenya Patent Expires US 2019
  • 9.
    PHASE 0 PRE-CLINICAL CellularAssay Potency: Selectivity (Screen against broad spectrum of targets) Activity in in vitro Assays Phys-Chem Solubility Stability Stability Cytochrome P450-Inhibition/Microsome Stability, Drug transporters In vitro Toxicology Ames-test, hERG, Nav1.5 BBB Permeability Caco2, P glycoprotein assay Pharmacokinetics Rodent (mouse/Rat), & metabolite studies PK/PD Disease Model Mechanism of Action Studies Pharmacokinetics Second Species Chemistry Scale up Production, Formulation feasibility, stability Toxicity In vitro in vivo in rodents In vivo in second species (pig, dog, non-human primate) Safety In vitro & vivo Cardiovascular & CNS safety, Genotoxicology, Reprotox Carcenogenicity WORKS IN pwMS PHASE I PHASE III PHASEII PHASE0 SAFE IN HUMANSSAFE IN ANIMALS SAFE(&HINTOFWORING)INpwMS
  • 10.
    ADME STUDIES Liberation: Releaseof the drug from the pharmaceutical formulation Absorption: Process of Drug Entering the Blood Circulation Bioavailability that influence routes of administration Distribution: Dispersion or dissemination of substance throughout the fluids and tissues of the body and Blood Brain Barrier Permeability Metabolism: Biotransformation or Inactivation. Drug-metabolism by cytochrome p450 enzymes Excretion: Removal of the compounds and their metabolites from the Body Kidneys (products excreted in urine) Gut (Biliary or Faeces excretion) Lungs (gases PHASE 0 PRE-CLINICAL TOXICOLOGY STUDIES INVESTIGATIONAL NEW DRUG (IND) Filing to get permission to text drug in humans
  • 11.
    International Conference onHarmonisation (ICH) of Technical Requirements for Registration of Pharmaceuticals for Human Use Brings together Drug Regulatory Authorities of pharmaceutical industry of Europe, Japan & USA • Prevents duplication of Trials in humans • Streamlines the regulatory Assessment process for new Drug Applications • Reducing the development times for drug development Guidelines Quality Guidelines: Pharmaceutical QC based on Good Manufacturing Practice Safety Guidelines: Safety Guidelines to uncover potential Risks Efficacy Guidelines concerning Design conduct , safety and reporting of clinical trials Good clinical Practice Multidisciplinary Guidelines cross cutting topics e.g. medical terminology Trial Is conducted in compliance with a protocol that has received prior ethical Review CLINICAL TRIALS
  • 12.
    PHASE 0 TRIAL Phase0 trials can be the first-in-human trials in human subjects. Microdosing: Single sublethal doses administered to a small group (e.g.10-15) healthy • Pharmacokinetics in humans instead of relying on animal data Low doses unlikely to lead to side effects Time course of drug plasma concentrations over 96 hours following oral administrations every 24 hours (τ). Absorption half- life 1 h, elimination half-life =12h. Note that in steady state and in linear phamacokinetics AUCτ=AUC∞. Steady state is reached after about 5 × 12 = 60 hours.
  • 13.
    PHASE I TRIAL PhaseI trials are usually the first stage of testing in human subjects. Normally, a small group (e.g.20–100) healthy volunteers will be recruited. • Safety (Pharmacovigilance) • Tolerability, • Pharmacokinetics (PK. What the Body Does to the Drug. ADME) • Pharmacodynamics (PD. What the Drug does to the Body. E.g. blocking target) Dose Ranging (Dose Escalation) Phase I trials: 0ften include healthy volunteers. Sometimes in people with Disease Volunteers are paid an inconvenience fee for their time spent in the volunteer centre. Pay depends on length of participation. Phase 1a Single Ascending Dose (SAD) (Maximum Tolerated Dose) Phase 1b Multiple Ascending Dose (MAD) Food Effect. Influence of Feeding
  • 14.
    PHASE II TRIAL OnceDose or Range of Doses Identified Phase II trials are the first stage of testing in human subjects with Disease (pwMS). Normally, a larger group (e.g.100–300/group) people with Disease recruited. • Safety (Pharmacovigilance)/Toxicity • Tolerability, • Efficacy • Pharmacokinetics/Pharmacodynamics sometimes Size informed by Past Studies Phase IIa Designed to assess dosing requirements Phase IIb Designed to study efficacy at the prescribed doses. WORKS IN MSers PHASE I PHASE III PHASEII PHASE 0 SAFE IN HUMANSSAFE IN ANIMALS SAFE(&HINTOFWORING)INMSers
  • 15.
    PHASE III TRIAL PhaseIII (Pivotal) trials are the final stage of testing in human subjects with Disease (pwMS) prior to licensing. They are designed to show effectiveness in clinical practise Normally, a large group (e.g.300–1000/group) people with Disease recruited. They are often randomised, multi-centre studies • Safety/Tolerability • Efficacy • Pharmacokinetics/Pharmacodynamics/Pharmacogenomics done sometimes Size informed by Phase II Studies Phase IIIb Extension Study of Phase III. People continue taking drug whilst licencing in progress, placebo arm switch to active drug. Extra safety/Efficacy Data. TWO phase III Trials Required to Replicate the efficacy/safety data. Regulators like to see evidence of a dose-response NEW DRUG APPLICATION (NDA) to Regulators where Sponsors suggest new pharmaceutical for sale and marketing.
  • 16.
    REGULATORY AUTHORITIES MHRA: Medicinesand Healthcare Products Regulatory Agency EMA: European Medicines Agency FDA: Food & Drug Administration in USA NICE National Institute of Health and Clinical Excellence COST EFFECTIVENESS ASSESSMENTS
  • 17.
    Quality-adjusted life-year (QALY)is a measure of disease burden including the quality and quantity of Life. The QALY is based on the number of years of life that would be added by the intervention Suggested Limit for Cost effectiveness is about £30,000/QALY SATIVEX: £49,300/QALY in UK (Lu et al 2012) FAMPYRA: £160,000/QALY in UK REGULATORY AUTHORITIES
  • 18.
    ANTI-INFLAMMATORY DRUGS FORMS INDUCTION Lemtrada ESCALATION First Line Avonex Betaseron Extavia Rebif Copaxone Aubagio Tecfidera Second Line Gilenya Tysabri Increasing Efficacy/ Side-Effect Risk RRMS = Considered Cost-Effective Most PPMS/SPMS = Considered Non Cost-Effective CHOICE No Evidence of Disease Activity REGULATORY AUTHORITIES UK First Line USA Third Line
  • 19.
    NO-EVIDENCE OF DISEASEACTIVITY NEDA-4 NO BRAIN ATROPHY NEDA-5/6 NO NEUROFILAMENTS IN CSF (NERVE BREAK DOWN) NO COGNITIVE DYSFUNCTION No Evidence of Disease Activity THERAPEUTIC TARGETS NEDA NO RELAPSES NO GADOLIUM ENHANCING LESIONS NO PROGRESSION OF DISABILITY
  • 20.
    PHASE IV STUDIES PhaseIV trials are known as Post-Marketing Surveillance after the drug is approved to be sold and is used in medical practise. Normally, data is collected from people using the drug • Safety/Tolerability (pharmacovigilance). Identify low prevalence/long-term side-effects • Conditions in trials may differ from those in clinical practise • Trial Duration is limited (2 years) • Drug Interactions
  • 21.
  • 22.
    LICENSED PRODUCT FOR CANCER NEW USEIN MS REPURPOSING REPURPOSING FOR RRMS –LICENCED OPTIONS AVAILABLE (AZATHIOPRINE AS GOOD AS BETA INTERFERONS) REPURPOSING FOR PPMS/SPMS-NO LICENCED OPTIONS AVAILABLE patent
  • 23.
  • 24.
  • 25.
    SCIENCE INNOVATION: IDENTIFYTARGETS LEAD TO PATENTS & COMMERCIAL DEVELOPMENT CLINICAL INNOVATION: IDENTIFY TARGETS FOR PHARMA EXPLOTATION IDENTIFTY TARGETS FOR PHARMA REPURPOSING LEAD TO PATENTS & COMMERCIAL DEVELOPMENT IDENTIFY METHODS TO DETECT EFFICACY RAPID PHASE II DESIGN ROBUST TRIAL DESIGN SUPPORT THE CASE FOR A CHANGE IN REGULATION THE ACADEMIC WAYREPURPOSING REGULATORS: BARRIERS CREATED FOR PHARMA-HARD TO ACHIEVE FOR ACADEMICS FUNDERS: FINANCING TWO PHASE III DEVELOPMENT PLANS & REGULATORS DIFFICULT GOVERNMENT: NOT CREATING INCENTIVES/STRUCTURES
  • 26.
    Maximum Funding forAcademic Trial = £2-4,000,000 New DMT due to Academic Led Trials Unlikely DMT cost for Comparator (current cost £12,000 per person) v Test e.g. Trial of 500 people = £6,000,000 Speak to EMA =£>30,000 MHRA = £>3,000 (hour consultation) Holding Licence = >£100,000 Trial Monitoring & Regulatory Submission. Pharma may pay >£50,000,000 In EU should not prescribe off-label if there is Licenced alternative OFF-LABEL prescription for untreated conditions possible THE ACADEMIC WAYREPURPOSING
  • 27.
    DESIGN OF TRIAL PATIENTPOPULATION: Ensure that participants are similar to reduce variability of Results Inclusion Criteria Exclusion Criteria CONTROL: Treatment is Against Placebo or Active comparator Superiority Trial (Active Test Drug is better than placebo or Active Comparator) Non-Inferiority Trial (Active Test Drugs is no worse than highly active Comparator) OBJECTIVES/ENDPOINTS: Defined Primary Endpoints/Secondary Endpoints. If Primary Endpoints are not Achieved Trial is a Failure If Primary Endpoints are not Achieved by Secondary Endpoints Achieved Trial is a Failure and New trial will need to be done with the Secondary endpoints of the first trial now the Primary endpoints in the second trials BIAS ELIMINATION: Randomisation & Blinding of pwMS and monitoring Neurologist SAMPLE SIZE Big enough to show effect small enough to limit exposure of humans to drug That could be dangerous
  • 28.
    ENDPOINTS IN MSTRIALS CLINICAL • ANNUALISED RELAPSE RATE (ARR): NUMBER OF RELAPSES DIVIDED BY THE TRIAL DURATION ARR =1 = 1 relapse a year ARR = 0.1 = 1 Relapse every ten years • DISABILITY PROGRESSION (TIME TO EDSS INCREASE) MAGNETIC RESONANCE IMAGING • T1-GADOLINIUM ENHANCING LESIONS = ACTIVE BLOOD BRAIN BARRIER BREAKDOWN • T1 BLACK HOLES = MEASURE OF NERVE DAMAGE & GLIOSIS • T2 LESION VOLUME = MEASURE OF LESION LOAD • BRAIN ATROPHY = VOLUME OF THE BRAIN = NERVE LOSS + OEDEMA + GLIOSIS • SPINAL CORD ATROPHY = VOLUME OF THE SC = NERVE LOSS + OEDEMA + GLIOSIS • MTR =MAGNETIZATION TRANSE RATI0 = (LOOSE) MEASURE MYELIN LOSS • N-ACYTEL ASPARTATE (NAA) = (LOOSE) MEASURE OF NERVE LOSS QUALITY OF LIFE (QoL) QUESTIONAIRES • MULTIPLE SCLEROSIS IMPACT SCALE (MSIS-29)
  • 29.
    DESIGN OF TRIAL TITRATION(INCREASING DOSE) DESIGNS CROSS-OVER DESIGN: Each person acts as their own control (Reduces number of people) PARALLEL GROUP: Each person gets only one treatment control verses Test Randomization Test Control Test Control TestControl Wash-Out CROSS-OVER DESIGN PARALLEL GROUP
  • 30.
    SAMPLE SIZE CALCULATION SAMPLESIZE Big enough to show effect small enough to limit exposure of humans to drug that could be dangerous Sample size = Capacity to predict the correct result (Power) with a probability of the result being significant for a certain effect size of the treatment. POWER or Sensitivity is the probability that the test correctly rejects the null hypothesis (that there is no difference between groups) when the alternative hypothesis (There is a difference between groups) is true. As the power increases, there are decreasing chances of a Type II Error (False Negative) and Type I (False positives) Errors. In trials an 80% power is often used although this is increased to 90% in some phase III trials PROBABILITY. (e.g. P=0.05. There is a one in twenty chance of getting this result by chance so if the level is set a P=0.001, it would be a one in a thousand chances) EFFECT SIZE. How much is effect is the drug going to have a 10% reduction or a 60% reduction the smaller the effect the larger sample size
  • 31.
    BIAS REDUCTION RANDOMIZATION Process bywhich people are allocated to an intervention after assessment eligibility • It eliminates selection bias • It eliminates confounding issues by adjusting co-variants (gets same demographics in test and control groups) • Facilitates Blinding of investigators, participants, and assessors BLINDING/MASKING Individuals withheld the knowledge of the treatments OPEN LABEL No Blinding SINGLE BLIND pwMS unaware of their Treatment DOUBLE BLIND Neuro & pwMS unaware of their treatment TRIPLE BLIND Neuro & pwMS and Assessor unaware of treatment
  • 32.
    1. TITLE &ABSTRACT 2. BACKGROUND & OBJECTIVES 3. TRIAL DESIGN 4. PARTICIPANTS (Eligibility) 5. TREATMENT 6. OUTCOME MEASURES 7. SAMPLE SIZE CALCULATION 8. RANDOMIZATION METHOD 9. ALLOCATION OF RANDOMISATION 10. IMPELEMENTATION OF RANDOMISATION 11. BLINDING 12. STATISTICS 13. PARTICIPANT FLOW RESULTS 14. RESULTS-RECRUITMENT 15. RESULTS-BASELINE DEMOGRAPHICS 16. RESULTS-NUMBERS- HOWMANY PEOPLEIN EACH GROUP 17. RESULTS-OUTCOMES 18. RESULTS ADDITIONAL ANALYSIS 19. RESULTS-SIDE EFFECTS 20. DISCUSSION-LIMITATIONS 21. DISCUSSION- GENERALISABILITY (VALIDITY) 22. DISCUSSION- INTERPRETATION 23. REGISTRATION (www.clinicaltrials.gov) 24. SOURCE OFPROTOCOL 25. FUNDING CONSORT GUIDELINES FOR REPORTING DESIGN OF TRIAL Checklists of Reporting Items Improve Transparency and Replication Ensure critical appraisal and interpretation http://www.consort-statement.org/
  • 33.
    DEMOGRAPHICS: Comparing Likefor Like (Sex, Age, History) SAMPLE SIZE Power to Detect Change Too Small- Miss Important Events Too Large-Extra Cost/Risk to People in Study BIAS REDUCTION: •RANDOMIZATION: Methods to Achieve this. Was it achieved? •BLINDING (Single Blind/Double Blind) METHODS OF Is the correct analysis used? ASSESSMENT OUTCOMES: Are they fit for purpose? Are the Outcomes Responsive? Control Response (Placebo Effect) COMPLIENCE Drugs don’t work if people do not take them SIDE-EFFECTS Tolerability * * * CONSORT GUIDELINES FOR REPORTING DESIGN OF TRIAL
  • 34.
    Assessment for Eligibility Randomization Allocatedto Intervention Received Intervention Follow Up Analysed Did Not Receive Lost to Follow Up Not Analysed Allocated to Intervention Received Intervention Follow Up Analysed Did Not Receive Lost to Follow Up Not Analysed Excluded TEST CONTROL CONSORT GUIDELINES FOR REPORTING DESIGN OF TRIAL
  • 35.
    TRIAL REGISTRATION www.clinicaltrials.gov (US-basedRepository of Clinical Trials) NCTxxxxxxxx https://www.clinicaltrialsregister.eu/ctr-search/search (EU Trial Register) EudraCT Number = Year- xxxxxx-xx • REGISTRATION SHOULD OCCUR PRIOR TO BEGINNING STUDY TRIAL DESIGN TRIAL ENDPOINTS TRIAL SITES All Changes are Logged 28,229/89,204 (31.7%) registered studies had their primary outcome changed. 10,623/40,615 (26.2%) had their primary outcome changed after the study completion date. Ramagopalan SV et al. F1000Res. 2014; 3: 77. Changes to Primary Outcomes after trial Completion Data were associated with a statistically significant primary outcome report. Ramagopalan SV et al. F1000Res. 2015; 4: 80. • LIMIT DUPLICATION • CREATE EXSISTENCE OF A TRIAL (IMPORTANT FOR NEGATIVE STUDIES) • MINIMISE USE OF ANIMAL TESTING WITHOUT COMPROMISING SAFETY Data Dredging for significant results = P hacking
  • 36.
    EVIDENCE-BASED MEDICINE/EVIDENCE BASEDPRACTISE Class 1(A). Evidence from a well designed randomised controlled trial of appropriate size. Systematic review of trials. e.g. Cochrane Collaboration Reviews (www.cochrane.org/) Class 2(B). Evidence from a well designed intervention study without randomisation. A common research design is the before-and-after study. Class 3(C). Evidence from a well designed non-experimental study e.g. cohort, case-control or cross-sectional studies. (Also include studies using purely qualitative methods) E.G. (cost- effectiveness studies). Class 4(D). Opinions of respected authorities, based on clinical evidence, descriptive studies or reports of expert consensus committees CLASS OF EVIDENCE
  • 37.
    DATA HANDLING Mean =Average (Rarely used in Trials) Standard Deviation = Approximation of Variability 1.96SD contains 95% of sample Standard Error (Square Root of SD) place were mean will occur in 95% of studies Median = Middle Number Range = Top – Bottom result Quartile= 0, 25, 50, 75,100% Percentile = 1-100th division Confidence Interval 95% CI = 95% that mean will be with in limits ANALYSIS Proportions: Chi-Square Two Groups: t test, Mann Whitney U Many Groups: ANOVA, kursall and Wallace Is data Normally Distributed are the Variances Equal If not use non-parametic stats DATA ANALYSIS
  • 38.
    BIOLOGICALLY SIGNIFICANT A differencebetween groups that has a real impact on biology STATISICALY SIGNIFICANT Mathematical Measure of a difference between groups. Does this occur at a level greater than may be expected by chance. PROBABILITY VALUES Likelihood of obtaining a statistical result by chance, assuming there is no Difference in the results (null hypothesis) being investigated P=0.05 is 1 in twenty chance of event occurring P=0.01 is 1 in one hundred chance of event occurring by chance P=0.001 is 1 in one thousand chance of event occurring by change Less Likely due to chance DATA ANALYSIS
  • 39.
    PRESENTATION OF DATA PIECHARTS These show the proportions of response, seldom used in trials, but may occur in Marketing material A (50%) B (25%) (4%) D (21%) C
  • 40.
    BAR CHARTS These showthe magnitude of the response/outcome PRESENTATION OF DATA Treatment A Treatment B Count Bar Chart 0 Measurement (Units) Frequency(%) Histogram 10 20 30 40 50
  • 41.
    WATERFALL PLOT This graphrepresents each patient individually (e.g. looking at response rate status of each patient whether progression stabilization of improvement PRESENTATION OF DATA
  • 42.
    LINE GRAPHS These showthe analysis over a period of time (serial analysis) PRESENTATION OF DATA
  • 43.
    KAPLAN-MEIER SURVIVAL CURVE Thecurve represents the proportion of the study population that are free of the event (Progression, Time to relapse etc ) as successive times. i.e Time to an event Commonly used to represent overall efficacy. The larger the difference in the curves the larger the difference PRESENTATION OF DATA
  • 44.
    HAZARD RATIO The HazardRatio is the Relative Risk of the Event (e.g. Disease progression) happening in one arm of a trial compared to another over the time of the trial arm difference between groups that has a real impact on biology Hazard Ratio = 1 means there is no difference Hazard Ratio = 2 means there is twice/double the risk Hazard Ratio = 0.5 means there is half the risk. Reduced risk by 50% This methodology uses all available information, including people who didn’t complete the study DATA ANALYSIS
  • 45.
    CONFIDENCE INTERVAL (CI) TheCI Percentage indicates the certainty that a result will fall into a range of results noted by lower and upper limits HR 0.55 (95% CI 0.40-0.77) The risk of converting to clinically definite MS is reduced by 45% with estimates ranging from 60% reduction to 23% reduction and 95% certainty that the result would lie between 23% and 60% risk Reduction The narrower the range the more precise the result. The CI are used as an indication how a study would be reflected in the general population DATA ANALYSIS
  • 46.
    PRESENTATION OF DATA SCATTERGRAPH (Relationships) Individual data points are plotted showing two variables (e.g. height verses weight) to show relationships Random Positive relationship Negative relationship Unrelated Unrelated Subset
  • 47.
    PRESENTATION OF DATA SCATTERGRAPH (Relationships)
  • 48.
    PRESENTATION OF DATA REGRESSION(Relationships) Spearman's rank correlation coefficient is a non-parametric measure of stastical dependence between two variables. It assesses how well the relationship between two variables can be described. R= +1 perfect Correlation or R = −1 perfect inverse correlation. R-squared is a statistical measure of how close the data are to the fitted linear regression line. It is the percentage of the response variable variation that is explained by a linear model. Or: R-squared = Explained variation / Total variation (It s between 0 and 100% or 0 to 1:) 90% explained40% explained
  • 49.
    PRESENTATION OF DATA BOX& WHISKER PLOT Rather than show all the distribution of individual data. The data is presented as a box with the whisker indicating deviation.
  • 50.
    FOREST PLOT Following meta-analysisof a number of different trials some showing benefit some not showing for treatment or for analysis of subgroups within a trial that may respond differently. A Forest plot is a way to compare different groups of data. PRESENTATION OF DATA Size of square is proportional to the importance of that data set and the horizontal lines are the confidence intervals
  • 51.
    ABSOLUTE RISK REDUCTION(ARR) The Difference between the number of events (e.g. pwMS who progressed) in the test verses the control group. e.g. Placebo progressed = 15% Test Drug = 10% progressed ARR of the Test drug = 15%-10% = 5% RELATIVE RISK REDUCTION (RRR). The RRR looks at the same difference Between groups given different treatments but expresses the change in risk As a proportion, rather than an absolute difference e.g. RRR of Progression by Test drug = 15-10/divided by progression of control 15-10/15 = 5/15 = 33% DATA ANALYSIS
  • 52.
    NUMBER NEEDED TOTREAT (NNT) The NNT is a statistic that tells one the actual number of pwMS that would need to be treated with a given therapy for a one patient to get a particular endpoint benefit. Determines whether Large number or small number of pwMS benefit. The Lower the NTT the more effective the treatment. ODDS RATIO. A measure of treatment effectiveness. The OR is the odds of an event happening in the treatment group expressed as a proportion of the odds of the event happening in the control group. OR close to 1 the smaller the difference in the treatment effect If greater (or lesser) than 1, then the treatment is greater (or less) than the control treatment. DATA ANALYSIS
  • 53.
    INTENTION TO TREAT(ITT) ANALYSIS ITT analysis of the results of a trial is based on the initial treatment assignment and not on the treatment eventually received. ITT analysis is intended to avoid various misleading artefacts that can arise such as crossover loss of subjects, that may break random assignment to the groups. ITT analysis provides information about the potential effects of treatment policy rather than on the potential effects of specific treatment. ITT is also simpler than other forms of study design and analysis because it does not require observation of Compliance status for units assigned to different treatments or incorporation of compliance into the analysis. Medical investigators often have difficulties in accepting ITT analysis because of clinical trial issues like missing data DATA ANALYSIS
  • 54.
    Time ChangeinBrainVolume Placebo Test DATA ANALYSIS MRI Outcomenot fit for purpose: Trial Failed Trial Not Long Enough: Trial Failed 50% of people were not taking drug: Trial Failed
  • 55.
  • 56.
    DATA ANALYSIS Regression tothe mean is the phenomenon that if a variable is extreme on its first measurement, it will tend to be closer to the average on its second measurement—and if it is extreme on its second measurement, it will tend to have been closer to the average on its first. In MS trials people are more likely to volunteer for trials if they are not doing as well and natural history of disease will mean the flair resolves and they get better
  • 57.
    ADVERSE REACTIONS Grade 1Asymptomatic (no) or mild symptoms; for this grade of AE, treatment is not indicated. Grade 2 Moderate; for this grade of AE minimal, local or non-invasive intervention may be indicated, for example, this might involve treating the symptom (e.g. nausea and vomiting caused by a treatment managed/prevented by giving the patient drugs to stop sickness, rather than stopping the drug). Grade 3 Severe but not immediately life-threatening; for such AEs hospitalization and investigation/ management are often indicated. Grade 4 Usually life-threatening consequences; for these AEs urgent intervention is indicated. Grade 5 Death related to AE.
  • 58.
    NERVE LOSS PROGRESSIVE MSRELAPSING-REMITTINGMS DISABILITY Frequent inflammation, demyelination, axonal transections, plasticity and remyelination Inflammation, Persistent Demyelination & Gliosis Infrequent inflammation, Gliosis, Chronic Neurodegeneration CLINICAL THRESHOLD INFLAMMATION Symptoms Clinical Effects are Due to Altered Nerve Conduction CLINICAL COURSE Immune Mediated Beta-interferons, Aubagio, Alemtuzumab, Cladribine,Bone Marrow Transplantation, Natalizumab, Rituximab are ACTIVE Neurodegeneration Beta-interferon, Alemtuzumab, Cladribine, Rituximab Bone Marrow Transplantation, Fingolimod, Natalizumab are INACTIVE to stop Worsening TREATMENT OF MS FUTURE TRIALS
  • 59.
  • 60.
    CONCLUSIONS DRUG DEVELOPMENT PROCESSIS COSTLY AND SLOW Clinical Trials are mechanism to develop safe and effective treatments Understanding the clinical trials allows you to Interpret the results Knowledge allows you to see the flaws that may affect the interpretation Knowledge allows you to put the details in context of other studies