SlideShare a Scribd company logo
1 of 13
Download to read offline
Geophysical Journal zyxwvutsrqpon
(1989) 97, 367-319zyxwvutsrq
A model for internal dynamical processes on Mt Etna
M. Cosentino*, G. Lombardo* and E. Privitera** zyxw
' zyxw
1st. Scienze della Terra, Univ. Caiania, C. zyxwvutsr
so Italia 55, 95129 Catania, and ** 1st. Internaz. di Vulcanologia, CNR Caiania, V. le Regiw
Margherita 6, 95123 Catania, Italy
Accepted 1988October zyxwvutsrq
5. Received 1988 October 5; in original form 1988February 23
SUMMARY
Results of studies concerning seismic activity (earthquakes and tremor) and its relation with
eruptive events on Mt Etna are briefly discussed.
Seismic records collected from 1977 up to 1986 have been analysed and special care was
given to observation of changes in some seismic parameters, such as the rate of microseismic
activity, the amplitude and dominant spectral peaks of the volcanic tremor, which vary
significantly in relation to the occurrence of eruptive events.
The systematic nature of variations in the seismic parameters considered allows us to
propose a preliminary model which puts all the observations made so far into a wide context
giving an interpretative hypothesis of the magma uprise mechanisms preceding either summit
or flank eruptions.
Summit eruptions are modelled in two stages and occur without changes in the seismic
parameters considered, except for a sharp increase in tremor amplitude almost coincident in
time with the eruption onset.
Flank eruptions are modelled in three stages and follow a simultaneous change of all the
mentioned parameters with time. The onset of these eruptions is in fact preceded by an
increase in both the daily number of shocks and the amplitude of the volcanic tremor as well
as a shifting from relatively high values in the dominant peaks of the tremor spectra, which
appear in the pre-eruptive stage, towards usual lower frequency values (1.0-2.3 zy
Hz).
Key words: Etna, earthquakes, tremor
1 INTRODUCTION
Monitoring of seismic activity on Mt Etna started in 1967
(Bottari & Riuscetti 1967). The quality and completeness of
data (earthquakes and tremor) has improved with time and
good reliability has been achieved since 1977. The present
configuration of the seismic network is shown in Fig. 1.
Preliminary reliable results, concerning the characteriza-
tion of etnean seismicity, have been obtained by Barbano et
af. (1979).
The internal structure of the volcano was seismically
investigated by Sharp, Davis & Cray (1980). They were able
to obtain a crustal velocity model for the etnean area and
also postulated the existence of a magmatic body at a depth
ranging from 16 to 24km. These features were also
confirmed by further detailed studies on etnean seismic
activity (Cosentino & Lombardo 1984; Cosentino et al.
1989a).
Moreover, preliminary source mechanisms of etnean
earthquakes were obtained by Scarpa, Patant & Lombardo
(1983) and Gresta, Glot & Patane (1985).
Volcanic tremor at Mt Etna has been monitored by
both the permanent seismic network and periodic field
measurements since 1971. Seidl, Schick & Riuscetti (1981)
assume an hydraulic origin for the etnean volcanic tremor.
According to their model, volcanic tremor can be explained
as seismic waves generated by pressure fluctuations due to
rapid movements of the gas-fluid system inside the ducts of
the volcano.
The comparison between theoretical models and data
collected has shown (Schick ef al., 1982a) that the spectrum
of volcanic tremor, at a distance r from the source, can be
represented by the equation:
A(r,f)=XA,f"exp- y.f2+- r),
I ( v,.,Q
where A(r,f) is the amplitude at distance r from the
elementary source, Ai is the source strength of the ith
source, Nj (with i = 1, 2, 3) is the order of the ith source,f is
the frequency, Mi is the factor of spatial and temporal
coherence of the ith source and (nf&,Q)r is the
attenuation factor from source i to the recording station.
In this model, the source region is described by the
summation of punctual sources characterized by the
respective current vector. The current field can be described
as a combination of linear components of flow. In this case it
is sufficient to consider the first three elementary
components: monopole, dipole and quadrupole. The
monopole term corresponds to the introduction or
withdrawal of fluid into (or out of) the source region, the
dipole component corresponds to thermal convection, and
367
Downloaded
from
https://academic.oup.com/gji/article-abstract/97/3/367/661726
by
guest
on
29
May
2020
368 zyxwvuts
M. zyxwvuts
Cosentino zyxwvutsr
et aI. zyxwvutsrq
i
LCRP zyxwvutsr
1
N E crater
S E crater
Flgue zyxwvutsrqpon
1. Sketch map of the fractures and lava flows related to the main eruptive activities which have occurredon Mt Etna from 1977 tc
T
r
i
a
n
g
l
e
sshow the position of the seismic stations. zyxwvutsrq
the quadruple term is associated with vortical and
turbulent flow (Kirbani 1983). Following Morse & Ingard
(1968), the radiation power of each of these individual
source parameters may be calculated by considering them as
simple harmonic oscillators. Moreover, the mutual coupling
between punctual sources, which is a function of time and
space, is assumed, as well as an attenuation law which takes
into account the damping effect of the waves propagating
out of the source region.
Spectra of volcanic tremor on Mt Etna show a systematic
nature in their dominant frequencies, which have been
repeated over several years in the range 1.0-4.OHz. As an
application of the model previously described, Schick et al.
(1982a, b) have estimated the size of the main dykes of the
etnean feeding system, describing each dyke as a harmonic
oscillator which resonates according to its eigenfrequency
when excited by the non-stationary flow of the magma. An
electrical analogue of this volcanic system was also modelled
by Kirbani (1983).
More recently, Cosentino et al. (1989b) have obtained a
revised version of the sketch representing the upper portion
of the volcano feeding system (Fig. 2), using the same a zy
priori assumptions which allowed Schick et zyx
a/. (1982a, b)
and Kirbani (1983) to obtain a simplified physical model.
Downloaded
from
https://academic.oup.com/gji/article-abstract/97/3/367/661726
by
guest
on
29
May
2020
0
500 zyxwvutsrqponml
1ooa
150C
200c zyxwvutsrqponmlkjih
1
depth zyxwvutsrqponml
(d
NE- CR-ATER
a
> zyxwvu
0
3
6 z
a
W
2 z
R zy
3
k
0
3
b z
i!zy
F i 2. Structural model of the main feeding dykes existing in the upper parts of the volcano (redrawn and simplified from Cosentino er al.
1989). Values of frequencies are associated with different portions of the feeding dykes, according to visual observations and to a simplified
assumption. It is assumed that the frequencies change from lower to higher values going from deeper to shallower parts of the dykes, as the
dyke sue, in general, is supposed to get smaller going from their deeper parts to the top. For further details, see Schick et al. (1982a, b).
w
Q
o
370 zyxwvutsr
M. zyxwvutsr
Cosentino zyxwvuts
et zyxwvutsrq
al. zyxwvutsr
The geometry of this preliminary structural model was
obtained using a larger dataset (1973-1985) than the
previous ones which gave rise to a distribution function of
the dominant frequencies observed in the tremor spectra
that was compared with periodic visual observations of the
various volcanic activities which have occurred at the
summit craters.
The aim of this paper is to analyse seismic signals
(tremors and earthquakes) in the frame of the eruptive
phenomena which have occurred on the volcano from 1977
to 1986, in order to look for significant changes in these
parameters which could be useful for eruptive activity
forecasting and in order to define a model explaining the
dynamical processes observed.
2 ANALYSIS OF DATA
A set of about 1500 amplitude spectra of volcanic tremor
has been analysed. Spectra are derived from the tremor
signals recorded at station MVT-SLN. For the time interval
1977-1983, the tremor signal was sampled before and during
the main eruptive episodes; while from 1984 up to now, a
daily sampling has been performed. In Fig. 1, the position of
the MVT-SLN station is represented together with the
location of the lava Rows related to the main eruptive
episodes which occurred in the considered period.
The recording station is equipped with a vertical
seismometer having a free period of 1s. The conditioned
signal is transmitted by telemetric links to the data
processing centre in Catania, where it is processed on-line
through a spectrum analyser.
The analyser converts the analogue signal into a digital
one using a sampling rate 2.56 times the upper limit
frequency range. A FFT is performed using zyxwvuts
400 spectral
lines in the frequency range 0-20Hz with a resolution of
0.05Hz.
The length of the analysed time series varies from 25 to.
40min and the number of independent spectra averaged in
this time interval, in order to obtain the final spectrum, is
not less than 64.The use of long time intervals is important
in order to enhance the stability in the spectral analysis of a
stationary random signal and to reduce the influence of
spurious effects. This allows us to obtain a statistical
amplitude error E = 1/(2*) = 1/(2<w x 100 not greater
than 6.25 per cent where, following Randall (1977), B is the
bandwidth, T is the time length and N is the number of
independent spectra averaged.
In order to observe possible time changes of seismic data
collected, the relative amplitude of each frequency peak
(a1Hz) shown in the spectra was evaluated and the first
three dominant peaks were plotted versus time in a set of
diagrams (Figs 3-9), together with the number of shocks per
day and the overall rms amplitude of each spectrum
expressed in m v ( a ) - ' .
The daily number of shocks has been computed at the
same recording station taking into account all seismic events
recorded, namely explosionquakes and earthquakes, which
on Mt Etna usually do not exceed magnitude 4.5.
Most of the dominant frequencies observed in the spectra
of etnean volcanic tremor range between 1.0 and 2.3Hz.
The stability of this frequency range has been observed for a
number of years as shown by the frequency distribution
curve obtained by Cosentino el zyxw
01. (1989b). Trends of
relatively higher frequencies (2.3-5.0 Hz) are occasionally
observed. Following this rough subdivision, the mean value
(f) and the standard deviation (a)of these two trends have
been calculated (Table 1). The length of the considered time
intervals is affected by the lack of continuity in the data
gathered. The continuity of information increases from 1977
up to now, due to the development of research into etnean
volcanic tremor.
In Fig. 3 the above-described parameters are plotted
versus time in the period 1977 January-December. During
this period, 14 small subterminal eruptions, lasting from a
few hours to a couple of days, took place from the NE
crater of the volcano (Cosentino 1982). Each of these
eruptions was characterized by a sudden increase in
strombolian activity, with lava fountains and moderate lava
outbursts. As can be observed (Fig. 3b), no particular
seismic activity took place in connection with such eruptive
events. Dominant peaks (Fig. 3c) are distributed in the
range 1.OO-2.25, typically associated with resonance
phenomena of the dykes forming the feeding system of the
upper part of the volcano (Cosentino et al. 1986). Such low
frequency values are present in the spectra throughout the
period considered, while a trend at relatively higher
frequency (2.35-3.55 Hz) appears for shorter time intervals
(see Table 1). Both the observed frequency trends are
rather dispersed (a= 0.31-0.26) and no significant changes
can be detected in relation to the eruptive activities.
The eruptive episodes are marked only by a sharp
enhancement of the tremor amplitude values (Fig. 3a) which
occurs almost contemporaneously with the onset of each
eruptive event.
During 1981 March, a flank eruption took place on the
northern slopes of Mt Etna. Data available concern the
period 1981 March-October (Fig. 4). The pattern of
dominant frequencies (Fig. 4c) shows a clear trend with
relatively high values (2.35-5.20 Hz) from the beginning of
March to 2 days before the onset of the eruption. The lack
of lower frequencies is observed in connection with the
existence of this trend. Low frequencies become dominant
in the tremor spectra when high frequencies disappear, and
this phenomenon precedes the onset of the Rank eruption by
almost 48 hr.
Such a 'down shift' of the values of dominant peaks
towards lower frequencies (from 3.3 to 1.5Hz) occurs in
connection with both a swarm of earthquakes (about 30 hr
before the opening of the eruptive fractures) and a sharp
increment in the tremor amplitude values (Fig. 4a and b).
After this episode, no particular changes were observed
either in the daily number of shocks or in the tremor
amplitude and dominant frequency peaks.
Similar characteristics can be observed in relation to the
1983 28 March Rank eruption. In Fig. 5, the daily values of
the volcanic tremor amplitude, the number of shocks per
day and the trends of the dominant peaks are plotted in the
period 1983 January-July. In this case also, there is
evidence of a down-shift of the dominant peaks which
occurs in relation to an increment in the tremor amplitude
and a seismic crisis, preceding the onset of the flank
eruption by 24-48 hr.
It is worth noting that the frequency trends preceding the
onset of the eruptive episode are clearly defined, giving a
Downloaded
from
https://academic.oup.com/gji/article-abstract/97/3/367/661726
by
guest
on
29
May
2020
Internal dynamical process on Mt Etna zy
371 zy
Table 1
.
Frequency Average Standard Number of
Time range frequency deviation data points
Interval (H4 zyxwvu
V) zyxw
(4 zyx
(n zyxw
1
1977
January 21-December 31
1977
August 10-December 31
1981
March 4-October 25
1981
March 4-March 15
1981
March 24-October 25
1983
January 1-July 10
1983
January 1-March 26
1983
1984 January 2-
1986 December 20
1984
October 16-November 9
1985
February23-March 6
1985
October 21-December 19
1986
May 29-August 18
1986
October 3-October 29
April 7-July 10
low-frequency trend
high-frequency trend
low-frequency trend
high-frequency trend
low-frequency trend
high-frequency trend
low-frequency trend
high-frequency trend
1.00-2.25
2.35-3.55
1.w2.30
2.35-5.20
2.45-4.45
1.15-2.30
2.35-3.25
2.35-4.60
1.00-2.30
2.60-4.55
2.9
2.80-3.25
2.90-3.25
2.60-3.15
1.62
2.71
1.51
3.32
2.79
1.70
2.89
3.06
1.56
3.14
2.90
3.04
2.90
2.80
0.31
0.26
0.29
0.53
0.41
0.33
0.24
0.60
0.28
0.59
0.00
0.15
0.10
0.14
329
35
162
29
54
365
61
65
2287
9
6
65
39
3
0
low dispersion (a=0.24) and showing a tendency to migrate
towards higher values. Soon after the frequency down-shift,
the trends at lower values appear quite stable in time; while
trends at higher frequency no longer exist or appear highly
dispersed zyxwvutsrq
(u= 0.6).
During 1984, a subterminal eruption took place from the
SE crater of Mt Etna. The plot of the parameters described
above (Fig. 6) in this case shows neither any change in the
frequency of the dominant peaks, nor a significant variation
of the level of seismicity. As with the 1977 subterminal
eruptions, the beginning of this one seems to be marked
only by the enhancement of the volcanic tremor amplitude.
In the time interval preceding the SE crater eruption, no
particular trend is built up by the higher frequencies.
It is interesting to observe that this eruption lasted for
several months and came to an end in 1984 October in
connection with the occurrence of a swarm of earthquakes.
This seismic crisis is not accompanied by any significant
change either in the values of the tremor amplitude or in the
trends of the dominant peaks. Contrary to other swarms,
which preceded the opening of eruptive fractures, these
shocks showed a greater average focal depth (Cosentino et
nl. 1986, 1989a). It is also worth noting that the trends of
dominant peaks in the tremor spectra are particularly stable
throughout the eruptive period, and peaks at values of 1.30,
1.45 and 1.75Hz can be easily detected from July to
October (Figs 6 and 7).
The end of 1984 and the beginning of 1985 are
characterized by moderate explosive activity at the summit
craters, so that the tremor amplitude values are relatively
high (Fig. 7).
On 1985 March 8, a new eruptive episode took place on
Mt Etna. This eruption started with an increase in explosive
activity and a small lava flow from the SE crater. Soon after,
it evolved to a flank eruption with output of lava from a
system of fractures belonging to the same fracture field of
the 1983eruption (see Fig. 1). No significant changes either
in the tremor amplitude values or the number of shocks can
be observed. A small trend at relatively high frequency
(2.9 Hz),which disappears before the onset of the eruption,
is observed.
The more complex character of this eruption, with respect
to the 1981 and 1983 flank eruptions, seems to be
represented by the time distribution of the dominant peaks.
In fact, it is evident that the short trend at 2.9Hz, in this
case, appears together with the trends of dominant peaks
existing at the usual lower frequencies (1.0-2.3 Hz). The
lack of a seismic crisis could be interpreted as a consequence
of the coincidence of the eruptive fracture system for both
this eruption and that in 1983.
Trends of dominant peaks are very clearly defined on the
plotted time interval and during the period 1985
April-September. In particular, three subtrends at fre-
quencies 1.20, 1.45 and 1.75 Hz,respectively, can be easily
detected (Figs 7 and 8).
Figure 8 shows that dominant peaks at relatively high
values start to appear in the spectra of volcanic tremor from
1985 September 25, and from October 21 they build up a
very clear trend (2.80-3.25 Hz) showing u = 0.15.
The daily number of shocks (Fig. 8b) is quite small and
does not change significantly, while a moderate increase in
the tremor amplitude (Fig. 8a) is observed in relation to the
Occurrence of higher frequencies in the tremor spectra.
A down-shift of dominant frequencies occurs on 1985
Downloaded
from
https://academic.oup.com/gji/article-abstract/97/3/367/661726
by
guest
on
29
May
2020
372 zyxwvutsr
M. zyxwvutsr
Cosentino zyxwvuts
et al. zyxwvut
3. zyxwvutsrqpo
2.5- zyxwvutsrqponm
-
N
I
l
L
v
1.
a
9 .
.. 0 . . r r . -
' n ..--'-
. .
* .
* . ... -
.
?
&
-08.. -. .= . 9 *. .
. - 0 ' . . ..-.:.' 9 . p;''
$--wb.;.- *n ) * . * . ....
.-
-2:ALll-J &**-- :,, *. - ..
. . .
--..
..
. -
m *
=
.
-
5
.
- .. ..>:
2.-
......0 "0.
' .
.
w
1";"- *
1.5.m; = - - r & ~ . . ma.
*
.
.
a
. ..w.a%*.".
II ' zyxwvutsrq
I
3,86
I
Lli28
I !I
L
I
C
Downloaded
from
https://academic.oup.com/gji/article-abstract/97/3/367/661726
by
guest
on
29
May
2020
60. zyxwvutsrqponm
N
5 zyxwvut
40
4
a zy
I68
:I1
55145
8.1
b
4
4.
3.5
3-
2.5. zyxwvutsrqponmlk
.'. zyxwv
. m
.
. . * . ..
.. zyxwv
' 8 . .. 9 . . .
Flgnre 8. Amplitude of volcanic tremor (a), number of shocks per day (b) and time distribution of dominant peaks observed in the tremor
spectra (c) during the period 1985 August-1986 March. See Fig. 4 for explanation of the symbols.
374 zyxwvutsr
M. zyxwvutsrq
Cosentino zyxwvutsr
et al. zyxwvutsrq
December 19, followed soon after by a sharp increment in
the tremor amplitude as well as an increase in the daily
number of shocks. These variations in the plotted
parameters precede the opening of the fractures related to
the eruption which took place in the Valle del Bove (see
Fig. 1) on 1985December 25.
From the end of the eruption to 1986 June (Figs 8 and 9)
only the usual low frequencies, associated with resonance of
the main feeding dykes of the volcano, can be detected in
the plot of spectral dominant peaks (a zyxwvutsr
= 0.28). As for the
other parameters investigated, the values of the tremor
amplitude are quite low, while a swarm of earthquakes
occurred on 1986 May 7. Shocks belonging to this seismic
crisis, as well as those which occurred in 1984, are located at
a relatively high average depth (h >5 km) and no particular
changes in the other plotted parameters can be detected.
In Fig. 9 it can be observed that two trends at relatively.
high frequency values (2.6-2.9 Hz) are present among
dominant spectral peaks, for short time intervals, together
with the usual lower values.
The first trend at 2.9Hz appears in the period 1986 May
29-August 18. It is not coincident in time with other
significant changes in the parameters plotted, except for a
progressive increase in tremor amplitude which occurs at the
same time as strombolian activity observed at all the summit
craters.
The second trend (2.60-3.15 Hz) appears in the period
1986 October 3-29. It is preceded by the occurrence of a
rather deep (h >5 km) swarm of earthquakes. Moreover,
the down-shift of dominant frequencies takes place at the
same time as both the enhancement of tremor amplitude
and a shallow seismic crisis which precedes, by a few hours,
the opening of fractures linked to the flank eruption in the
Valle del Bove (Fig. 1).
3 DISCUSSION AND CONCLUSIONS
Seismic activity on Mt Etna is characterized by earthquakes
having a minimum detectable magnitude of 2.0, but which
can reach values of 4.5. The seismicity is randomly
distributed both in time and space during periods of reduced
activity existing between two successive eruptions, while it
shows a tendency to cluster in various sectors of the volcano
and to have an average shallow depth (h s 5 km) during
swarms of earthquakes which precede the opening of
eruptive fractures (Cosentino & Lombard0 1984; Cosentino
et al. 1989a).
Following the model used so far, volcanic tremor is
interpreted as due to turbulence in the flow of piromagma
which excites the ducts of the volcano. The frequencies
observed in the spectrum represent the eigenfrequencies of
different dykes which are excited by the rapid movement of
the magma and its pressure fluctuations (Seidl, Schick &
Riuscetti 1981; Kirbani 1983).
Figure 10 shows some examples of volcanic tremor spectra
and the corresponding time series, obtained during different
stages of volcanic activity. It is interesting to observe that
the spectra obtained during the quiet periods and those
obtained during summit eruptions show a similar frequency
content, and a sharp amplitude enhancement marks the
eruptive stage. On the contrary, dominant frequencies,
which usually range in the interval 1.0-2.3 Hz, move
towards higher values in the pre-eruptive periods of flank
eruptions and shift again towards the usual lower values
shortly before the eruption onset.
The results of the analysis of tremor data, recorded on Mt
Etna since 1977, are summarized in Fig. 11, where two main
frequency ranges are shown: a trend of spectral dominant
peaks, stable in time, which ranges in the interval
1.0-2.3 Hz; and a trend at relatively high frequencies
(>2.3 Hz) which appears from time to time in the tremor
spectra. The higher frequencies (>2.3 Hz) can be related to
shallow and/or small secondary dykes, while relatively low
frequencies (1.0-2.3 Hz) are linked to big and deep dykes
interpreted as the main ducts of the volcano feeding system
(Cosentino et al. 1989b).
Following these considerations, an attempt has been made
to put the seismic characteristics and eruptive events
observed so far on the volcano into the framework of a
preliminary dynamical model.
Mount Etna shows permanent activity at its four summit
craters (Fig. 1). Many classifications have been proposed for
the different volcanic activities, but according to our data,
from a seismological point of view, two main eruptive
phenomena can be distinguished:
(i) summit eruptions, which take place from the main
vents, characterized by strombolian activity and/or lava
flows;
(ii) flank eruptions, which take place from fractures
opening in the slopes of the volcano.
The onset of a summit eruption (terminal or subterminal)
is not accompanied by any significant change (Fig. 11) either
in the dominant peaks of the tremor spectra or in the
seismic pattern. The sudden increment in explosive activity
and the paroxysmal stage, typical of summit eruptions, is
marked only by the sharp enhancement of the tremor
amplitude (Figs 3, 6 and 9). Therefore, summit eruptions
can be modelled in two stages (Fig. 12).
The first stage represents the standard conditions of
volcanic activity during ‘quiet’ periods. Magma partially fills
the main ducts without any particular turbulence. This can
be deduced from the spectra of the volcanic tremor which
show a low energy content and a small amplitude of the
spectral peaks typically associated with resonance in the
main feeding ducts (see Fig. 2). A low daily occurrence
frequency of earthquakes which take place randomly both
in time and space, is observed.
Stage two is characterized by a sudden and violent
increase in magma turbulence. This causes a sharp
enhancement of the rms spectral amplitude and a significant
increase in the amplitude of each dominant peak existing in
the frequency band (1.0-2.3 Hz) associated with the main
feeding ducts. No particular changes are observed in the
rate of seismicity. All summit eruptions which have occurred
on Mt Etna since 1977 show such phenomena (Fig. 11).
Laboratory experiments (Schick, personal communica-
tion) have demonstrated that it is possible to simulate a
summit eruption by simply heating a fluid (liquid and solid)
until turbulence starts and gas bubbles reach a dimension
comparable to the size of the pipe of the laboratory sample
bulb. The same result (a sudden extrusion of the overheated
fluid) can be obtained using a sample bulb having a top pipe
whose section can be toughened to a critical size. Thus, the
Downloaded
from
https://academic.oup.com/gji/article-abstract/97/3/367/661726
by
guest
on
29
May
2020
Internal dynamical process zyx
on Mt E m zy
375
0.. zyxwvutsrqponm
1zyxwv
M
.
.
zyxwvutsrqponmlkj
. I .
0 . 0 0
"
c
0 . 0 2 . zyxwvutsrqpon
L I N rnca tr(. I 1 0
- 7 0 7
,"V
0 L O
I I R C t6CC I
C Z . 6
- V
I
. 1 .
0 . 0 0
,:t :
0 . 0 2 5 L l N FnEOtM., I 0
X.- .
.
..
.¶ 2
0 . 0 0
0 . 0 2 % 1 0
X...
r 2
- 7 0 7
- V
C T I M E ,6 L C I La
$ 2 . 5
m v -
0 . 0 2 s L I N rncolr(.: * C
Flgme 10. Examples of seismograms and corresponding spectra of volcanic tremor recorded during different stages of activity. (a) Quiet
period, (b) summit eruption (1977 December), (c) pre-eruptiveperiod (before the flank eruption of 1983 March) and (d) flank eruption (1983
March).
Downloaded
from
https://academic.oup.com/gji/article-abstract/97/3/367/661726
by
guest
on
29
May
2020
376 zyxwvutsr
M. zyxwvutsrq
Cosentino zyxwvuts
et zyxwvutsrq
al. zyxwvutsr
t 1.40Hz
A (rnV rm
A(rnVrrnr
Figure U.Sketch model explaining the mechanism of the summit eruptions and corresponding changes in the volcanic tremor spectra. zy
eruptive mechanism of the summit eruptions seems to be
linked to changes in the thermodynamic equilibrium or the
geometrical constraints of the feeding system.
eruptions imply that it is not possible, using the parameters
investigated so far, to discover any significant precursor as
there is no time delay between the increase in tremor
amplitude and the beginning of eruptive activity.
Since 1977, five flank eruptions have occurred on Mt Etna
The characteristics observed for the etnean summit (1981, 1983, 1985 March and December, 1986). Before each
of these eruptions, clear trends at high frequency (>2.3 H
z
)
have been observed in the spectral dominant peaks of the
Downloaded
from
https://academic.oup.com/gji/article-abstract/97/3/367/661726
by
guest
on
29
May
2020
Internal dynamical process on Mt Etna zy
377 z
W. zyxwvutsrqpon
Sketch model explaining the mechanism of the flank eruptions and correspondingchanges in the volcanic tremor spectra.
Downloaded
from
https://academic.oup.com/gji/article-abstract/97/3/367/661726
by
guest
on
29
May
2020
378 zyxwvutsr
M. zyxwvutsrq
Cosentino zyxwvuts
et al. zyxwvutsrq
volcanic tremor (Fig. 11). These frequency trends shift
towards lower values (1.0-2.3Hz) some hours (from 6 to
48 hr) before the opening of the eruptive fractures. The
down-shift is almost contemporaneous with the occurrence
of both earthquake swarms and a sharp enhancement of the
tremor amplitude (Figs 4, 5, 7, 8 and 9).
Observations of high frequencies in the tremor signal,
shifting towards lower values, are not common in the
literature. Sassa (1936) describes a shift of the mean period
of volcanic tremor towards high values occurring almost at
the same time as an increase in the tremor amplitude which
is linked to the increment of eruptive activity on Aso
volcano. Preliminary observations concerning changes in the
frequency content of volcanic tremor on Mt Etna have been
described for the 1983 flank eruption (Cosentino zyxwvut
et al.
1984). The lack of several data available in that period did
not allow us to set this phenomenon into a wider context.
The systematic occurrence of this phenomenon in relation
to all studied flank eruptions (Fig. 11) leads the authors to
propose a preliminary interpretative model for flank
eruptions as well as for summit eruptions.
According to the seismic data, three different stages can
be recognized in the dynamical processes taking place in the
volcano before the occurrence of flank eruptions (Fig. 13).
Stage one is similar to that of summit eruptions; in other
words, it represents the standard conditions of volcanic
activity during the so-called ‘quiet’ periods.
Stage two is an intermediate stage characterized by
possible feeding of magma from below and by fracturation
processes and/or partial intrusion of magma into the
shallower parts of the volcano. As a consequence of these
phenomena, high-frequency trends (<2.3 Hz) are observed.
In the model adopted for etnean volcanic tremor, they may
be associated with resonance of small and/or shallow dykes
filled with magma. Seismic activity occurs randomly during
this time interval and it could be related to intrusion
phenomena. Occasionally, swarms of earthquakes having a
greater than average depth (h zyxwvutsrq
>5 km) have been observed
to precede in time the high-frequency trends (Fig. 11). Such
phenomena, which can be assumed to be linked to the
recharging of the volanic system (Cosentino & Lombardo
1984), characterize an unstable condition of the volcano.
This unstable stage can go backwards to quiet conditions
(stage one) without changes in the other parameters, or it
can evolve to stage three when a seismic crisis takes place on
the volcano (Fig. 11).
Stage three is connected with an intense fracturation due
to both the modifications of the physical properties of the
rocks because of the magma intruded and to the local and
regional stress field acting on the volcano. This process,
similar to a feed-back mechanism, implies that the fractures
can reach the surface producing the output of lava so that a
flank eruption will start. The dominant peaks observed in
the spectra shift towards lower frequencies as turbulence
and then resonance become predominant in the main
feeding dykes. Thus, the spectra show both a sharp increase
in the rms spectral amplitude and an increment in the
amplitude of each dominant peak in the usual low-frequency
band.
All flank eruptions which have occurred on Mt Etna since
1981 (Fig. 11) show such characteristics except for the 1985
March flank eruption which, as previously described, took
place without any seismic crisis.
A tight time dependence between flank eruptions and
both summit eruptions and earthquake swarms was also
obtained, using a statistical approach, by Sharp, Lombardo
& Davis (1981). Both summit eruptions and earthquake
swarms were in fact found to precede, in a statistically
significant way, the occurrence of flank activities.
Therefore the fracture process linked to the seismic crises
seems to be the trigger for flank eruptions. Volcanic activity
is evident a few hours (6-48 hr) after modification of the
equilibrium of the system has taken place. This implies that
every time a simultaneous variation of all three parameters
is observed, the opening of eruptive fractures follows soon
after. Therefore, a short-term precursor can be recognized.
It seems reasonable that the time interval between the
variation of seismic parameters and the onset of the
eruption is a function of the ‘weakness’ of the volcanic
sector influenced by the stress increment. It has in fact been
observed that the duration of the precursor phenomena is
quite small (few hours) for all the eruptions which took
place on the eastern flank of Mt Etna, where a calderic area
exists. On the other hand, the flank eruptions on the
northern and southern slopes of the volcano (1981 and 1983,
respectively) show that the precursor phenomena preceded
the opening of the eruptive fractures by 24-48 hr.
It is important to note that the occurrence of a seismic
crisis is not necessarily a precursor of flank activity (e.g. the
swarm of 1984October). In this case, the crisis occurrence is
not coincident with the ‘down-shift’ of dominant fre-
quencies, and this should imply that the critical stage, when
fractures intersect the surface, has not yet been reached.
Although the proposed model is somewhat speculative, it
is founded both upon quite a large set of instrumental
seismic data and a tight correlation with visual observations.
It is the opinion of the authors that this approach appears
to be a promising one for the understanding of the dynamic
processes taking place on Mt Etna. Of course, as the
reliability of a model is a function of the number of
parameters simultaneously investigated, significant improve-
ment could be reached by the comparison with data
concerning ground deformations and source parameters of
earthquakes.
ACKNOWLEDGMENTS
The authors thank Dr S. Falsaperla for useful discussions
and advice and Professor R. Scarpa for critical reading of
the manuscript.
REFERENCES
Barbano, M. S., Copsey, J., Cosentino, M., Lombardo, G.,
PatanC, G., Riuscetti, zyxw
M.,Viglianisi, A. & Villari, P., 1979.
Primi risultati della rete di sorveglianza sismica dell’Etna, Atfi
Conuegno P.F. ‘Geodinamica’,235, 219-271.
Bottari, A. & Riuscetti, M.,1967. La stazione sismica di Serra la
Nave sull’Etna, Ann. Geofis., 20, 243-264.
Cosentino, M., 1982. Relationship between seismicity and eruptive
activity of Mt. Etna, Mem. SOC. Geol. It., 23, 174-181.
Cosentino, M., Gresta, S., Lombardo, G., PatanC, G., Riuscetti,
M., Schick, T. & Viglianisi, A., 1984. Features of volcanic
tremors on Mt. Etna (Sicily) during the March-August 1983
eruption, Bull. Volcanol., 47-4(2), 929-939.
Cosentino, M. & Lombardo, G., 1984. A model for eruptive
Downloaded
from
https://academic.oup.com/gji/article-abstract/97/3/367/661726
by
guest
on
29
May
2020
Internal dynamical process on Mt Etna zy
379 zy
mechanismsof Mt. Etna from the study of seismicityfrom 1978
to 1983, Bull. Volcanol., zyxwvutsrqp
47-4(2), 977-993.
Cosentino, M., Di Francesco, M., Lombardo, G. zyxwvutsr
& Privitera, E.,
1986. Attivita sismica e tremore vulcanico nell'area etnea: stato
delle conoscenze e loro significato nello studio dei fenomeni
precursori dell'attivita vulcanica, CNR Gruppo Nazionale per
la Vulcanologia, Boll., 1986, 183-200.
Cosentino, M., Di Francesco, zyxwvutsr
M.,Lombardo, G. & Sharp, A. D.
L., 1989a. The seismicity of the etnean area and its
relationships to eruptive activity (1978-1985), 1. Volc. georh.
Rex, in press.
Cosentino, M., Lombardo, G., Privitera, E., Riuscetti, M. &
Schick, R., 1989b. Analysis of volcanic tremor at Mt. Etna and
its relation to seismo-eruptiveactivity, J. Phys. Earth, in press.
Gresta, S., Clot, J. P. & PatanC, G., 1985. Studio di meccanismi
focali di terremoti etnei, CNR, Atri zyxwvutsrq
4" Conuegno GNGTS,
Roma 1985, pp. 809-814.
Kirbani, S. B., 1983. Analysis and interpretation of volcanic
tremors at Etna, Imt. Geophysik Uniu. Stuttgart, Publ. no. 20.
Morse, P. M. & Ingard, K. U., 1968. Theoretical Acoustics,
McGraw Hill, New York.
Randall, R. B., 1977. Frequency Analysis, Naeum Offset,
Denmark.
Sassa, K., 1936. Micro-seismometric study on eruption of the
volcano Aso, part I1 of the geophysical studies on the volcano
Aso, Mem. College of Science, Kyoto Imperial University, A19,
Scarpa, R., Patank, G. & Lombardo, G., 1983. Space-time
evolution of seismic activity at Mt. Etna during 1974-1982,
Ann. Geophys., 1
(
6
)
, 451-462.
Schick, R., Cosentino, M.,Lombardo, G. & Patank, G., 1982a.
Volcanic tremors at Mt. Etna: a brief description, Mem. SOC.
Geol. It., 23, 191-196.
Schick, R., Lombardo, G. & Patank, G., 1982b. Volcanic tremors
and shocks associated with eruptions at Etna (Sicily),
September 1980,J. Vofc.georh. Res., 14, 261-279.
Seidl, D., Schick, R. & Riuscetti, M., 1981. Volcanic tremors at
Etna: a model for hydraulic origin, Bull. Volcanol., 4
4
,43-56.
Sharp, A. D. L., Davis, P. M. & Gray, F., 1980. A low velocity
zone beneath Etna and magma storage, Nature, 287, 587-591.
Sharp, A. D. L., Lombardo, G. & Davis, P. M., 1981. Correlation
between eruptions of Mount Etna, Sicily, and regional
earthquakes as seen in historical records from 1582 A.D.,
Geophys. J. R. astr. SOC.,65, 507-523.
11-65.
Downloaded
from
https://academic.oup.com/gji/article-abstract/97/3/367/661726
by
guest
on
29
May
2020

More Related Content

Similar to A Model For Internal Dynamical Processes On Mt Etna

موقعیت صفحه توران.pdf
موقعیت صفحه توران.pdfموقعیت صفحه توران.pdf
موقعیت صفحه توران.pdfmahnazsabahi
 
Humphrey and Anderson 1992
Humphrey and Anderson 1992Humphrey and Anderson 1992
Humphrey and Anderson 1992James Humphrey
 
Öncel Akademi: İstatistiksel Sismoloji
Öncel Akademi: İstatistiksel SismolojiÖncel Akademi: İstatistiksel Sismoloji
Öncel Akademi: İstatistiksel SismolojiAli Osman Öncel
 
1 s2.0-000215717590031 x-main
1 s2.0-000215717590031 x-main1 s2.0-000215717590031 x-main
1 s2.0-000215717590031 x-mainSujit Satpute
 
Quality factor of seismic coda waves in garhwal
Quality factor of seismic coda waves in garhwalQuality factor of seismic coda waves in garhwal
Quality factor of seismic coda waves in garhwaliaemedu
 
Quality factor of seismic coda waves in garhwal himalayas 2
Quality factor of seismic coda waves in garhwal himalayas 2Quality factor of seismic coda waves in garhwal himalayas 2
Quality factor of seismic coda waves in garhwal himalayas 2IAEME Publication
 
Quality factor of seismic coda waves in garhwal himalayas
Quality factor of seismic coda waves in garhwal himalayasQuality factor of seismic coda waves in garhwal himalayas
Quality factor of seismic coda waves in garhwal himalayasiaemedu
 
Öncel Akademi: İstatistiksel Sismoloji
Öncel Akademi: İstatistiksel SismolojiÖncel Akademi: İstatistiksel Sismoloji
Öncel Akademi: İstatistiksel SismolojiAli Osman Öncel
 
X-RAY MEASUREMENTS OF THE PARTICLE ACCELERATION PROPERTIES AT INWARD SHOCKS I...
X-RAY MEASUREMENTS OF THE PARTICLE ACCELERATION PROPERTIES AT INWARD SHOCKS I...X-RAY MEASUREMENTS OF THE PARTICLE ACCELERATION PROPERTIES AT INWARD SHOCKS I...
X-RAY MEASUREMENTS OF THE PARTICLE ACCELERATION PROPERTIES AT INWARD SHOCKS I...Sérgio Sacani
 
Towards the identification of the primary particle nature by the radiodetecti...
Towards the identification of the primary particle nature by the radiodetecti...Towards the identification of the primary particle nature by the radiodetecti...
Towards the identification of the primary particle nature by the radiodetecti...Ahmed Ammar Rebai PhD
 
Stationary waves and slowly moving features in the night upper clouds of Venus
Stationary waves and slowly moving features in the night upper clouds of VenusStationary waves and slowly moving features in the night upper clouds of Venus
Stationary waves and slowly moving features in the night upper clouds of VenusSérgio Sacani
 
1997 a+a 325-714-rhocas
1997 a+a 325-714-rhocas1997 a+a 325-714-rhocas
1997 a+a 325-714-rhocasKees De Jager
 
The October 2004 Mw=7.1 Nicaragua earthquake: Rupture process, aftershock loc...
The October 2004 Mw=7.1 Nicaragua earthquake: Rupture process, aftershock loc...The October 2004 Mw=7.1 Nicaragua earthquake: Rupture process, aftershock loc...
The October 2004 Mw=7.1 Nicaragua earthquake: Rupture process, aftershock loc...Gus Alex Reyes
 
The canarias einstein_ring_a_newly_discovered_optical_einstein_ring
The canarias einstein_ring_a_newly_discovered_optical_einstein_ringThe canarias einstein_ring_a_newly_discovered_optical_einstein_ring
The canarias einstein_ring_a_newly_discovered_optical_einstein_ringSérgio Sacani
 
Öncel Akademi: İstatistiksel Sismoloji
Öncel Akademi: İstatistiksel SismolojiÖncel Akademi: İstatistiksel Sismoloji
Öncel Akademi: İstatistiksel SismolojiAli Osman Öncel
 

Similar to A Model For Internal Dynamical Processes On Mt Etna (20)

Seismic Risk in Turkey
Seismic Risk in TurkeySeismic Risk in Turkey
Seismic Risk in Turkey
 
موقعیت صفحه توران.pdf
موقعیت صفحه توران.pdfموقعیت صفحه توران.pdf
موقعیت صفحه توران.pdf
 
Humphrey and Anderson 1992
Humphrey and Anderson 1992Humphrey and Anderson 1992
Humphrey and Anderson 1992
 
Öncel Akademi: İstatistiksel Sismoloji
Öncel Akademi: İstatistiksel SismolojiÖncel Akademi: İstatistiksel Sismoloji
Öncel Akademi: İstatistiksel Sismoloji
 
IJET-V3I2P9
IJET-V3I2P9IJET-V3I2P9
IJET-V3I2P9
 
1 s2.0-000215717590031 x-main
1 s2.0-000215717590031 x-main1 s2.0-000215717590031 x-main
1 s2.0-000215717590031 x-main
 
Quality factor of seismic coda waves in garhwal
Quality factor of seismic coda waves in garhwalQuality factor of seismic coda waves in garhwal
Quality factor of seismic coda waves in garhwal
 
Quality factor of seismic coda waves in garhwal himalayas 2
Quality factor of seismic coda waves in garhwal himalayas 2Quality factor of seismic coda waves in garhwal himalayas 2
Quality factor of seismic coda waves in garhwal himalayas 2
 
Quality factor of seismic coda waves in garhwal himalayas
Quality factor of seismic coda waves in garhwal himalayasQuality factor of seismic coda waves in garhwal himalayas
Quality factor of seismic coda waves in garhwal himalayas
 
Öncel Akademi: İstatistiksel Sismoloji
Öncel Akademi: İstatistiksel SismolojiÖncel Akademi: İstatistiksel Sismoloji
Öncel Akademi: İstatistiksel Sismoloji
 
X-RAY MEASUREMENTS OF THE PARTICLE ACCELERATION PROPERTIES AT INWARD SHOCKS I...
X-RAY MEASUREMENTS OF THE PARTICLE ACCELERATION PROPERTIES AT INWARD SHOCKS I...X-RAY MEASUREMENTS OF THE PARTICLE ACCELERATION PROPERTIES AT INWARD SHOCKS I...
X-RAY MEASUREMENTS OF THE PARTICLE ACCELERATION PROPERTIES AT INWARD SHOCKS I...
 
Towards the identification of the primary particle nature by the radiodetecti...
Towards the identification of the primary particle nature by the radiodetecti...Towards the identification of the primary particle nature by the radiodetecti...
Towards the identification of the primary particle nature by the radiodetecti...
 
robcflux
robcfluxrobcflux
robcflux
 
Stationary waves and slowly moving features in the night upper clouds of Venus
Stationary waves and slowly moving features in the night upper clouds of VenusStationary waves and slowly moving features in the night upper clouds of Venus
Stationary waves and slowly moving features in the night upper clouds of Venus
 
AGU2014-SA31B-4098
AGU2014-SA31B-4098AGU2014-SA31B-4098
AGU2014-SA31B-4098
 
1997 a+a 325-714-rhocas
1997 a+a 325-714-rhocas1997 a+a 325-714-rhocas
1997 a+a 325-714-rhocas
 
15WCEE_628_Craifaleanu
15WCEE_628_Craifaleanu15WCEE_628_Craifaleanu
15WCEE_628_Craifaleanu
 
The October 2004 Mw=7.1 Nicaragua earthquake: Rupture process, aftershock loc...
The October 2004 Mw=7.1 Nicaragua earthquake: Rupture process, aftershock loc...The October 2004 Mw=7.1 Nicaragua earthquake: Rupture process, aftershock loc...
The October 2004 Mw=7.1 Nicaragua earthquake: Rupture process, aftershock loc...
 
The canarias einstein_ring_a_newly_discovered_optical_einstein_ring
The canarias einstein_ring_a_newly_discovered_optical_einstein_ringThe canarias einstein_ring_a_newly_discovered_optical_einstein_ring
The canarias einstein_ring_a_newly_discovered_optical_einstein_ring
 
Öncel Akademi: İstatistiksel Sismoloji
Öncel Akademi: İstatistiksel SismolojiÖncel Akademi: İstatistiksel Sismoloji
Öncel Akademi: İstatistiksel Sismoloji
 

More from Audrey Britton

Developing And Writing A Diversity Statement Cent
Developing And Writing A Diversity Statement CentDeveloping And Writing A Diversity Statement Cent
Developing And Writing A Diversity Statement CentAudrey Britton
 
RESEARCH PAPER WRITING FORMAT Tanh
RESEARCH PAPER WRITING FORMAT TanhRESEARCH PAPER WRITING FORMAT Tanh
RESEARCH PAPER WRITING FORMAT TanhAudrey Britton
 
How To Plan And Write An Essay Fast. A Teacher Tells All. Writers Bureau
How To Plan And Write An Essay Fast. A Teacher Tells All. Writers BureauHow To Plan And Write An Essay Fast. A Teacher Tells All. Writers Bureau
How To Plan And Write An Essay Fast. A Teacher Tells All. Writers BureauAudrey Britton
 
Disney Stationary Tinkerbell And Friends, Disney Scrapb
Disney Stationary Tinkerbell And Friends, Disney ScrapbDisney Stationary Tinkerbell And Friends, Disney Scrapb
Disney Stationary Tinkerbell And Friends, Disney ScrapbAudrey Britton
 
Websites That Write Essays For You Top 10 Services
Websites That Write Essays For You Top 10 ServicesWebsites That Write Essays For You Top 10 Services
Websites That Write Essays For You Top 10 ServicesAudrey Britton
 
Digital Elephant Writing Paper Printable Elephant P
Digital Elephant Writing Paper Printable Elephant PDigital Elephant Writing Paper Printable Elephant P
Digital Elephant Writing Paper Printable Elephant PAudrey Britton
 
Top Experts To Write Paper For Money In All Disciplines
Top Experts To Write Paper For Money In All DisciplinesTop Experts To Write Paper For Money In All Disciplines
Top Experts To Write Paper For Money In All DisciplinesAudrey Britton
 
This May Be The Worst College Paper Ever WrittenBut A Whistleblower ...
This May Be The Worst College Paper Ever WrittenBut A Whistleblower ...This May Be The Worst College Paper Ever WrittenBut A Whistleblower ...
This May Be The Worst College Paper Ever WrittenBut A Whistleblower ...Audrey Britton
 
What Cause Climate Change Essay. The Causes Of Cli
What Cause Climate Change Essay. The Causes Of CliWhat Cause Climate Change Essay. The Causes Of Cli
What Cause Climate Change Essay. The Causes Of CliAudrey Britton
 
Essay Writing Service Write My Essay Essay Writing Help
Essay Writing Service Write My Essay Essay Writing HelpEssay Writing Service Write My Essay Essay Writing Help
Essay Writing Service Write My Essay Essay Writing HelpAudrey Britton
 
Thesis Vs. Dissertation Vs. Research Paper - Basic Dif
Thesis Vs. Dissertation Vs. Research Paper - Basic DifThesis Vs. Dissertation Vs. Research Paper - Basic Dif
Thesis Vs. Dissertation Vs. Research Paper - Basic DifAudrey Britton
 
013 Good Persuasive Essay Topics Example Thatsno
013 Good Persuasive Essay Topics Example Thatsno013 Good Persuasive Essay Topics Example Thatsno
013 Good Persuasive Essay Topics Example ThatsnoAudrey Britton
 
Using Quotes In An Essay Ultimate B
Using Quotes In An Essay Ultimate BUsing Quotes In An Essay Ultimate B
Using Quotes In An Essay Ultimate BAudrey Britton
 
Brown Paper Texture Background Stock Photos Creative Market
Brown Paper Texture Background  Stock Photos  Creative MarketBrown Paper Texture Background  Stock Photos  Creative Market
Brown Paper Texture Background Stock Photos Creative MarketAudrey Britton
 
Critique Paper Example How To Write An Article Cr
Critique Paper Example  How To Write An Article CrCritique Paper Example  How To Write An Article Cr
Critique Paper Example How To Write An Article CrAudrey Britton
 
Write My Paper Hub - Your Reliable Academic Writing Assi
Write My Paper Hub - Your Reliable Academic Writing AssiWrite My Paper Hub - Your Reliable Academic Writing Assi
Write My Paper Hub - Your Reliable Academic Writing AssiAudrey Britton
 
ITALIAN LESSON Italian Writing 1 By DrakeCroft On
ITALIAN LESSON Italian Writing 1 By DrakeCroft OnITALIAN LESSON Italian Writing 1 By DrakeCroft On
ITALIAN LESSON Italian Writing 1 By DrakeCroft OnAudrey Britton
 
Manuscript Paper Japanese Writing Paper Stock Illustra
Manuscript Paper Japanese Writing Paper Stock IllustraManuscript Paper Japanese Writing Paper Stock Illustra
Manuscript Paper Japanese Writing Paper Stock IllustraAudrey Britton
 
Star Writing Template Freebie By Cupcakes A
Star Writing Template Freebie By Cupcakes AStar Writing Template Freebie By Cupcakes A
Star Writing Template Freebie By Cupcakes AAudrey Britton
 
Short Paragraph On Water Pollution. Paragraph On Water Pollution ...
Short Paragraph On Water Pollution. Paragraph On Water Pollution ...Short Paragraph On Water Pollution. Paragraph On Water Pollution ...
Short Paragraph On Water Pollution. Paragraph On Water Pollution ...Audrey Britton
 

More from Audrey Britton (20)

Developing And Writing A Diversity Statement Cent
Developing And Writing A Diversity Statement CentDeveloping And Writing A Diversity Statement Cent
Developing And Writing A Diversity Statement Cent
 
RESEARCH PAPER WRITING FORMAT Tanh
RESEARCH PAPER WRITING FORMAT TanhRESEARCH PAPER WRITING FORMAT Tanh
RESEARCH PAPER WRITING FORMAT Tanh
 
How To Plan And Write An Essay Fast. A Teacher Tells All. Writers Bureau
How To Plan And Write An Essay Fast. A Teacher Tells All. Writers BureauHow To Plan And Write An Essay Fast. A Teacher Tells All. Writers Bureau
How To Plan And Write An Essay Fast. A Teacher Tells All. Writers Bureau
 
Disney Stationary Tinkerbell And Friends, Disney Scrapb
Disney Stationary Tinkerbell And Friends, Disney ScrapbDisney Stationary Tinkerbell And Friends, Disney Scrapb
Disney Stationary Tinkerbell And Friends, Disney Scrapb
 
Websites That Write Essays For You Top 10 Services
Websites That Write Essays For You Top 10 ServicesWebsites That Write Essays For You Top 10 Services
Websites That Write Essays For You Top 10 Services
 
Digital Elephant Writing Paper Printable Elephant P
Digital Elephant Writing Paper Printable Elephant PDigital Elephant Writing Paper Printable Elephant P
Digital Elephant Writing Paper Printable Elephant P
 
Top Experts To Write Paper For Money In All Disciplines
Top Experts To Write Paper For Money In All DisciplinesTop Experts To Write Paper For Money In All Disciplines
Top Experts To Write Paper For Money In All Disciplines
 
This May Be The Worst College Paper Ever WrittenBut A Whistleblower ...
This May Be The Worst College Paper Ever WrittenBut A Whistleblower ...This May Be The Worst College Paper Ever WrittenBut A Whistleblower ...
This May Be The Worst College Paper Ever WrittenBut A Whistleblower ...
 
What Cause Climate Change Essay. The Causes Of Cli
What Cause Climate Change Essay. The Causes Of CliWhat Cause Climate Change Essay. The Causes Of Cli
What Cause Climate Change Essay. The Causes Of Cli
 
Essay Writing Service Write My Essay Essay Writing Help
Essay Writing Service Write My Essay Essay Writing HelpEssay Writing Service Write My Essay Essay Writing Help
Essay Writing Service Write My Essay Essay Writing Help
 
Thesis Vs. Dissertation Vs. Research Paper - Basic Dif
Thesis Vs. Dissertation Vs. Research Paper - Basic DifThesis Vs. Dissertation Vs. Research Paper - Basic Dif
Thesis Vs. Dissertation Vs. Research Paper - Basic Dif
 
013 Good Persuasive Essay Topics Example Thatsno
013 Good Persuasive Essay Topics Example Thatsno013 Good Persuasive Essay Topics Example Thatsno
013 Good Persuasive Essay Topics Example Thatsno
 
Using Quotes In An Essay Ultimate B
Using Quotes In An Essay Ultimate BUsing Quotes In An Essay Ultimate B
Using Quotes In An Essay Ultimate B
 
Brown Paper Texture Background Stock Photos Creative Market
Brown Paper Texture Background  Stock Photos  Creative MarketBrown Paper Texture Background  Stock Photos  Creative Market
Brown Paper Texture Background Stock Photos Creative Market
 
Critique Paper Example How To Write An Article Cr
Critique Paper Example  How To Write An Article CrCritique Paper Example  How To Write An Article Cr
Critique Paper Example How To Write An Article Cr
 
Write My Paper Hub - Your Reliable Academic Writing Assi
Write My Paper Hub - Your Reliable Academic Writing AssiWrite My Paper Hub - Your Reliable Academic Writing Assi
Write My Paper Hub - Your Reliable Academic Writing Assi
 
ITALIAN LESSON Italian Writing 1 By DrakeCroft On
ITALIAN LESSON Italian Writing 1 By DrakeCroft OnITALIAN LESSON Italian Writing 1 By DrakeCroft On
ITALIAN LESSON Italian Writing 1 By DrakeCroft On
 
Manuscript Paper Japanese Writing Paper Stock Illustra
Manuscript Paper Japanese Writing Paper Stock IllustraManuscript Paper Japanese Writing Paper Stock Illustra
Manuscript Paper Japanese Writing Paper Stock Illustra
 
Star Writing Template Freebie By Cupcakes A
Star Writing Template Freebie By Cupcakes AStar Writing Template Freebie By Cupcakes A
Star Writing Template Freebie By Cupcakes A
 
Short Paragraph On Water Pollution. Paragraph On Water Pollution ...
Short Paragraph On Water Pollution. Paragraph On Water Pollution ...Short Paragraph On Water Pollution. Paragraph On Water Pollution ...
Short Paragraph On Water Pollution. Paragraph On Water Pollution ...
 

Recently uploaded

ECONOMIC CONTEXT - PAPER 1 Q3: NEWSPAPERS.pptx
ECONOMIC CONTEXT - PAPER 1 Q3: NEWSPAPERS.pptxECONOMIC CONTEXT - PAPER 1 Q3: NEWSPAPERS.pptx
ECONOMIC CONTEXT - PAPER 1 Q3: NEWSPAPERS.pptxiammrhaywood
 
CARE OF CHILD IN INCUBATOR..........pptx
CARE OF CHILD IN INCUBATOR..........pptxCARE OF CHILD IN INCUBATOR..........pptx
CARE OF CHILD IN INCUBATOR..........pptxGaneshChakor2
 
Interactive Powerpoint_How to Master effective communication
Interactive Powerpoint_How to Master effective communicationInteractive Powerpoint_How to Master effective communication
Interactive Powerpoint_How to Master effective communicationnomboosow
 
POINT- BIOCHEMISTRY SEM 2 ENZYMES UNIT 5.pptx
POINT- BIOCHEMISTRY SEM 2 ENZYMES UNIT 5.pptxPOINT- BIOCHEMISTRY SEM 2 ENZYMES UNIT 5.pptx
POINT- BIOCHEMISTRY SEM 2 ENZYMES UNIT 5.pptxSayali Powar
 
Organic Name Reactions for the students and aspirants of Chemistry12th.pptx
Organic Name Reactions  for the students and aspirants of Chemistry12th.pptxOrganic Name Reactions  for the students and aspirants of Chemistry12th.pptx
Organic Name Reactions for the students and aspirants of Chemistry12th.pptxVS Mahajan Coaching Centre
 
Types of Journalistic Writing Grade 8.pptx
Types of Journalistic Writing Grade 8.pptxTypes of Journalistic Writing Grade 8.pptx
Types of Journalistic Writing Grade 8.pptxEyham Joco
 
EPANDING THE CONTENT OF AN OUTLINE using notes.pptx
EPANDING THE CONTENT OF AN OUTLINE using notes.pptxEPANDING THE CONTENT OF AN OUTLINE using notes.pptx
EPANDING THE CONTENT OF AN OUTLINE using notes.pptxRaymartEstabillo3
 
Presiding Officer Training module 2024 lok sabha elections
Presiding Officer Training module 2024 lok sabha electionsPresiding Officer Training module 2024 lok sabha elections
Presiding Officer Training module 2024 lok sabha electionsanshu789521
 
Meghan Sutherland In Media Res Media Component
Meghan Sutherland In Media Res Media ComponentMeghan Sutherland In Media Res Media Component
Meghan Sutherland In Media Res Media ComponentInMediaRes1
 
“Oh GOSH! Reflecting on Hackteria's Collaborative Practices in a Global Do-It...
“Oh GOSH! Reflecting on Hackteria's Collaborative Practices in a Global Do-It...“Oh GOSH! Reflecting on Hackteria's Collaborative Practices in a Global Do-It...
“Oh GOSH! Reflecting on Hackteria's Collaborative Practices in a Global Do-It...Marc Dusseiller Dusjagr
 
Alper Gobel In Media Res Media Component
Alper Gobel In Media Res Media ComponentAlper Gobel In Media Res Media Component
Alper Gobel In Media Res Media ComponentInMediaRes1
 
call girls in Kamla Market (DELHI) 🔝 >༒9953330565🔝 genuine Escort Service 🔝✔️✔️
call girls in Kamla Market (DELHI) 🔝 >༒9953330565🔝 genuine Escort Service 🔝✔️✔️call girls in Kamla Market (DELHI) 🔝 >༒9953330565🔝 genuine Escort Service 🔝✔️✔️
call girls in Kamla Market (DELHI) 🔝 >༒9953330565🔝 genuine Escort Service 🔝✔️✔️9953056974 Low Rate Call Girls In Saket, Delhi NCR
 
Introduction to ArtificiaI Intelligence in Higher Education
Introduction to ArtificiaI Intelligence in Higher EducationIntroduction to ArtificiaI Intelligence in Higher Education
Introduction to ArtificiaI Intelligence in Higher Educationpboyjonauth
 
Employee wellbeing at the workplace.pptx
Employee wellbeing at the workplace.pptxEmployee wellbeing at the workplace.pptx
Employee wellbeing at the workplace.pptxNirmalaLoungPoorunde1
 
Full Stack Web Development Course for Beginners
Full Stack Web Development Course  for BeginnersFull Stack Web Development Course  for Beginners
Full Stack Web Development Course for BeginnersSabitha Banu
 
Proudly South Africa powerpoint Thorisha.pptx
Proudly South Africa powerpoint Thorisha.pptxProudly South Africa powerpoint Thorisha.pptx
Proudly South Africa powerpoint Thorisha.pptxthorishapillay1
 
Earth Day Presentation wow hello nice great
Earth Day Presentation wow hello nice greatEarth Day Presentation wow hello nice great
Earth Day Presentation wow hello nice greatYousafMalik24
 
History Class XII Ch. 3 Kinship, Caste and Class (1).pptx
History Class XII Ch. 3 Kinship, Caste and Class (1).pptxHistory Class XII Ch. 3 Kinship, Caste and Class (1).pptx
History Class XII Ch. 3 Kinship, Caste and Class (1).pptxsocialsciencegdgrohi
 

Recently uploaded (20)

ECONOMIC CONTEXT - PAPER 1 Q3: NEWSPAPERS.pptx
ECONOMIC CONTEXT - PAPER 1 Q3: NEWSPAPERS.pptxECONOMIC CONTEXT - PAPER 1 Q3: NEWSPAPERS.pptx
ECONOMIC CONTEXT - PAPER 1 Q3: NEWSPAPERS.pptx
 
TataKelola dan KamSiber Kecerdasan Buatan v022.pdf
TataKelola dan KamSiber Kecerdasan Buatan v022.pdfTataKelola dan KamSiber Kecerdasan Buatan v022.pdf
TataKelola dan KamSiber Kecerdasan Buatan v022.pdf
 
CARE OF CHILD IN INCUBATOR..........pptx
CARE OF CHILD IN INCUBATOR..........pptxCARE OF CHILD IN INCUBATOR..........pptx
CARE OF CHILD IN INCUBATOR..........pptx
 
Interactive Powerpoint_How to Master effective communication
Interactive Powerpoint_How to Master effective communicationInteractive Powerpoint_How to Master effective communication
Interactive Powerpoint_How to Master effective communication
 
POINT- BIOCHEMISTRY SEM 2 ENZYMES UNIT 5.pptx
POINT- BIOCHEMISTRY SEM 2 ENZYMES UNIT 5.pptxPOINT- BIOCHEMISTRY SEM 2 ENZYMES UNIT 5.pptx
POINT- BIOCHEMISTRY SEM 2 ENZYMES UNIT 5.pptx
 
Organic Name Reactions for the students and aspirants of Chemistry12th.pptx
Organic Name Reactions  for the students and aspirants of Chemistry12th.pptxOrganic Name Reactions  for the students and aspirants of Chemistry12th.pptx
Organic Name Reactions for the students and aspirants of Chemistry12th.pptx
 
Types of Journalistic Writing Grade 8.pptx
Types of Journalistic Writing Grade 8.pptxTypes of Journalistic Writing Grade 8.pptx
Types of Journalistic Writing Grade 8.pptx
 
EPANDING THE CONTENT OF AN OUTLINE using notes.pptx
EPANDING THE CONTENT OF AN OUTLINE using notes.pptxEPANDING THE CONTENT OF AN OUTLINE using notes.pptx
EPANDING THE CONTENT OF AN OUTLINE using notes.pptx
 
Presiding Officer Training module 2024 lok sabha elections
Presiding Officer Training module 2024 lok sabha electionsPresiding Officer Training module 2024 lok sabha elections
Presiding Officer Training module 2024 lok sabha elections
 
Meghan Sutherland In Media Res Media Component
Meghan Sutherland In Media Res Media ComponentMeghan Sutherland In Media Res Media Component
Meghan Sutherland In Media Res Media Component
 
“Oh GOSH! Reflecting on Hackteria's Collaborative Practices in a Global Do-It...
“Oh GOSH! Reflecting on Hackteria's Collaborative Practices in a Global Do-It...“Oh GOSH! Reflecting on Hackteria's Collaborative Practices in a Global Do-It...
“Oh GOSH! Reflecting on Hackteria's Collaborative Practices in a Global Do-It...
 
Alper Gobel In Media Res Media Component
Alper Gobel In Media Res Media ComponentAlper Gobel In Media Res Media Component
Alper Gobel In Media Res Media Component
 
call girls in Kamla Market (DELHI) 🔝 >༒9953330565🔝 genuine Escort Service 🔝✔️✔️
call girls in Kamla Market (DELHI) 🔝 >༒9953330565🔝 genuine Escort Service 🔝✔️✔️call girls in Kamla Market (DELHI) 🔝 >༒9953330565🔝 genuine Escort Service 🔝✔️✔️
call girls in Kamla Market (DELHI) 🔝 >༒9953330565🔝 genuine Escort Service 🔝✔️✔️
 
Introduction to ArtificiaI Intelligence in Higher Education
Introduction to ArtificiaI Intelligence in Higher EducationIntroduction to ArtificiaI Intelligence in Higher Education
Introduction to ArtificiaI Intelligence in Higher Education
 
Employee wellbeing at the workplace.pptx
Employee wellbeing at the workplace.pptxEmployee wellbeing at the workplace.pptx
Employee wellbeing at the workplace.pptx
 
Full Stack Web Development Course for Beginners
Full Stack Web Development Course  for BeginnersFull Stack Web Development Course  for Beginners
Full Stack Web Development Course for Beginners
 
Proudly South Africa powerpoint Thorisha.pptx
Proudly South Africa powerpoint Thorisha.pptxProudly South Africa powerpoint Thorisha.pptx
Proudly South Africa powerpoint Thorisha.pptx
 
Earth Day Presentation wow hello nice great
Earth Day Presentation wow hello nice greatEarth Day Presentation wow hello nice great
Earth Day Presentation wow hello nice great
 
History Class XII Ch. 3 Kinship, Caste and Class (1).pptx
History Class XII Ch. 3 Kinship, Caste and Class (1).pptxHistory Class XII Ch. 3 Kinship, Caste and Class (1).pptx
History Class XII Ch. 3 Kinship, Caste and Class (1).pptx
 
ESSENTIAL of (CS/IT/IS) class 06 (database)
ESSENTIAL of (CS/IT/IS) class 06 (database)ESSENTIAL of (CS/IT/IS) class 06 (database)
ESSENTIAL of (CS/IT/IS) class 06 (database)
 

A Model For Internal Dynamical Processes On Mt Etna

  • 1. Geophysical Journal zyxwvutsrqpon (1989) 97, 367-319zyxwvutsrq A model for internal dynamical processes on Mt Etna M. Cosentino*, G. Lombardo* and E. Privitera** zyxw ' zyxw 1st. Scienze della Terra, Univ. Caiania, C. zyxwvutsr so Italia 55, 95129 Catania, and ** 1st. Internaz. di Vulcanologia, CNR Caiania, V. le Regiw Margherita 6, 95123 Catania, Italy Accepted 1988October zyxwvutsrq 5. Received 1988 October 5; in original form 1988February 23 SUMMARY Results of studies concerning seismic activity (earthquakes and tremor) and its relation with eruptive events on Mt Etna are briefly discussed. Seismic records collected from 1977 up to 1986 have been analysed and special care was given to observation of changes in some seismic parameters, such as the rate of microseismic activity, the amplitude and dominant spectral peaks of the volcanic tremor, which vary significantly in relation to the occurrence of eruptive events. The systematic nature of variations in the seismic parameters considered allows us to propose a preliminary model which puts all the observations made so far into a wide context giving an interpretative hypothesis of the magma uprise mechanisms preceding either summit or flank eruptions. Summit eruptions are modelled in two stages and occur without changes in the seismic parameters considered, except for a sharp increase in tremor amplitude almost coincident in time with the eruption onset. Flank eruptions are modelled in three stages and follow a simultaneous change of all the mentioned parameters with time. The onset of these eruptions is in fact preceded by an increase in both the daily number of shocks and the amplitude of the volcanic tremor as well as a shifting from relatively high values in the dominant peaks of the tremor spectra, which appear in the pre-eruptive stage, towards usual lower frequency values (1.0-2.3 zy Hz). Key words: Etna, earthquakes, tremor 1 INTRODUCTION Monitoring of seismic activity on Mt Etna started in 1967 (Bottari & Riuscetti 1967). The quality and completeness of data (earthquakes and tremor) has improved with time and good reliability has been achieved since 1977. The present configuration of the seismic network is shown in Fig. 1. Preliminary reliable results, concerning the characteriza- tion of etnean seismicity, have been obtained by Barbano et af. (1979). The internal structure of the volcano was seismically investigated by Sharp, Davis & Cray (1980). They were able to obtain a crustal velocity model for the etnean area and also postulated the existence of a magmatic body at a depth ranging from 16 to 24km. These features were also confirmed by further detailed studies on etnean seismic activity (Cosentino & Lombardo 1984; Cosentino et al. 1989a). Moreover, preliminary source mechanisms of etnean earthquakes were obtained by Scarpa, Patant & Lombardo (1983) and Gresta, Glot & Patane (1985). Volcanic tremor at Mt Etna has been monitored by both the permanent seismic network and periodic field measurements since 1971. Seidl, Schick & Riuscetti (1981) assume an hydraulic origin for the etnean volcanic tremor. According to their model, volcanic tremor can be explained as seismic waves generated by pressure fluctuations due to rapid movements of the gas-fluid system inside the ducts of the volcano. The comparison between theoretical models and data collected has shown (Schick ef al., 1982a) that the spectrum of volcanic tremor, at a distance r from the source, can be represented by the equation: A(r,f)=XA,f"exp- y.f2+- r), I ( v,.,Q where A(r,f) is the amplitude at distance r from the elementary source, Ai is the source strength of the ith source, Nj (with i = 1, 2, 3) is the order of the ith source,f is the frequency, Mi is the factor of spatial and temporal coherence of the ith source and (nf&,Q)r is the attenuation factor from source i to the recording station. In this model, the source region is described by the summation of punctual sources characterized by the respective current vector. The current field can be described as a combination of linear components of flow. In this case it is sufficient to consider the first three elementary components: monopole, dipole and quadrupole. The monopole term corresponds to the introduction or withdrawal of fluid into (or out of) the source region, the dipole component corresponds to thermal convection, and 367 Downloaded from https://academic.oup.com/gji/article-abstract/97/3/367/661726 by guest on 29 May 2020
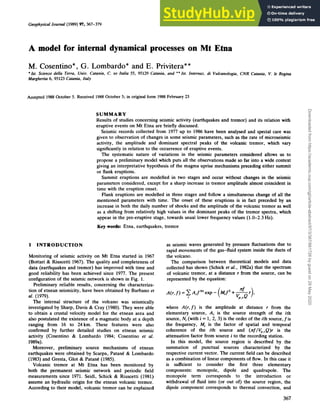
  • 2. 368 zyxwvuts M. zyxwvuts Cosentino zyxwvutsr et aI. zyxwvutsrq i LCRP zyxwvutsr 1 N E crater S E crater Flgue zyxwvutsrqpon 1. Sketch map of the fractures and lava flows related to the main eruptive activities which have occurredon Mt Etna from 1977 tc T r i a n g l e sshow the position of the seismic stations. zyxwvutsrq the quadruple term is associated with vortical and turbulent flow (Kirbani 1983). Following Morse & Ingard (1968), the radiation power of each of these individual source parameters may be calculated by considering them as simple harmonic oscillators. Moreover, the mutual coupling between punctual sources, which is a function of time and space, is assumed, as well as an attenuation law which takes into account the damping effect of the waves propagating out of the source region. Spectra of volcanic tremor on Mt Etna show a systematic nature in their dominant frequencies, which have been repeated over several years in the range 1.0-4.OHz. As an application of the model previously described, Schick et al. (1982a, b) have estimated the size of the main dykes of the etnean feeding system, describing each dyke as a harmonic oscillator which resonates according to its eigenfrequency when excited by the non-stationary flow of the magma. An electrical analogue of this volcanic system was also modelled by Kirbani (1983). More recently, Cosentino et al. (1989b) have obtained a revised version of the sketch representing the upper portion of the volcano feeding system (Fig. 2), using the same a zy priori assumptions which allowed Schick et zyx a/. (1982a, b) and Kirbani (1983) to obtain a simplified physical model. Downloaded from https://academic.oup.com/gji/article-abstract/97/3/367/661726 by guest on 29 May 2020
  • 3. 0 500 zyxwvutsrqponml 1ooa 150C 200c zyxwvutsrqponmlkjih 1 depth zyxwvutsrqponml (d NE- CR-ATER a > zyxwvu 0 3 6 z a W 2 z R zy 3 k 0 3 b z i!zy F i 2. Structural model of the main feeding dykes existing in the upper parts of the volcano (redrawn and simplified from Cosentino er al. 1989). Values of frequencies are associated with different portions of the feeding dykes, according to visual observations and to a simplified assumption. It is assumed that the frequencies change from lower to higher values going from deeper to shallower parts of the dykes, as the dyke sue, in general, is supposed to get smaller going from their deeper parts to the top. For further details, see Schick et al. (1982a, b). w Q o
  • 4. 370 zyxwvutsr M. zyxwvutsr Cosentino zyxwvuts et zyxwvutsrq al. zyxwvutsr The geometry of this preliminary structural model was obtained using a larger dataset (1973-1985) than the previous ones which gave rise to a distribution function of the dominant frequencies observed in the tremor spectra that was compared with periodic visual observations of the various volcanic activities which have occurred at the summit craters. The aim of this paper is to analyse seismic signals (tremors and earthquakes) in the frame of the eruptive phenomena which have occurred on the volcano from 1977 to 1986, in order to look for significant changes in these parameters which could be useful for eruptive activity forecasting and in order to define a model explaining the dynamical processes observed. 2 ANALYSIS OF DATA A set of about 1500 amplitude spectra of volcanic tremor has been analysed. Spectra are derived from the tremor signals recorded at station MVT-SLN. For the time interval 1977-1983, the tremor signal was sampled before and during the main eruptive episodes; while from 1984 up to now, a daily sampling has been performed. In Fig. 1, the position of the MVT-SLN station is represented together with the location of the lava Rows related to the main eruptive episodes which occurred in the considered period. The recording station is equipped with a vertical seismometer having a free period of 1s. The conditioned signal is transmitted by telemetric links to the data processing centre in Catania, where it is processed on-line through a spectrum analyser. The analyser converts the analogue signal into a digital one using a sampling rate 2.56 times the upper limit frequency range. A FFT is performed using zyxwvuts 400 spectral lines in the frequency range 0-20Hz with a resolution of 0.05Hz. The length of the analysed time series varies from 25 to. 40min and the number of independent spectra averaged in this time interval, in order to obtain the final spectrum, is not less than 64.The use of long time intervals is important in order to enhance the stability in the spectral analysis of a stationary random signal and to reduce the influence of spurious effects. This allows us to obtain a statistical amplitude error E = 1/(2*) = 1/(2<w x 100 not greater than 6.25 per cent where, following Randall (1977), B is the bandwidth, T is the time length and N is the number of independent spectra averaged. In order to observe possible time changes of seismic data collected, the relative amplitude of each frequency peak (a1Hz) shown in the spectra was evaluated and the first three dominant peaks were plotted versus time in a set of diagrams (Figs 3-9), together with the number of shocks per day and the overall rms amplitude of each spectrum expressed in m v ( a ) - ' . The daily number of shocks has been computed at the same recording station taking into account all seismic events recorded, namely explosionquakes and earthquakes, which on Mt Etna usually do not exceed magnitude 4.5. Most of the dominant frequencies observed in the spectra of etnean volcanic tremor range between 1.0 and 2.3Hz. The stability of this frequency range has been observed for a number of years as shown by the frequency distribution curve obtained by Cosentino el zyxw 01. (1989b). Trends of relatively higher frequencies (2.3-5.0 Hz) are occasionally observed. Following this rough subdivision, the mean value (f) and the standard deviation (a)of these two trends have been calculated (Table 1). The length of the considered time intervals is affected by the lack of continuity in the data gathered. The continuity of information increases from 1977 up to now, due to the development of research into etnean volcanic tremor. In Fig. 3 the above-described parameters are plotted versus time in the period 1977 January-December. During this period, 14 small subterminal eruptions, lasting from a few hours to a couple of days, took place from the NE crater of the volcano (Cosentino 1982). Each of these eruptions was characterized by a sudden increase in strombolian activity, with lava fountains and moderate lava outbursts. As can be observed (Fig. 3b), no particular seismic activity took place in connection with such eruptive events. Dominant peaks (Fig. 3c) are distributed in the range 1.OO-2.25, typically associated with resonance phenomena of the dykes forming the feeding system of the upper part of the volcano (Cosentino et al. 1986). Such low frequency values are present in the spectra throughout the period considered, while a trend at relatively higher frequency (2.35-3.55 Hz) appears for shorter time intervals (see Table 1). Both the observed frequency trends are rather dispersed (a= 0.31-0.26) and no significant changes can be detected in relation to the eruptive activities. The eruptive episodes are marked only by a sharp enhancement of the tremor amplitude values (Fig. 3a) which occurs almost contemporaneously with the onset of each eruptive event. During 1981 March, a flank eruption took place on the northern slopes of Mt Etna. Data available concern the period 1981 March-October (Fig. 4). The pattern of dominant frequencies (Fig. 4c) shows a clear trend with relatively high values (2.35-5.20 Hz) from the beginning of March to 2 days before the onset of the eruption. The lack of lower frequencies is observed in connection with the existence of this trend. Low frequencies become dominant in the tremor spectra when high frequencies disappear, and this phenomenon precedes the onset of the Rank eruption by almost 48 hr. Such a 'down shift' of the values of dominant peaks towards lower frequencies (from 3.3 to 1.5Hz) occurs in connection with both a swarm of earthquakes (about 30 hr before the opening of the eruptive fractures) and a sharp increment in the tremor amplitude values (Fig. 4a and b). After this episode, no particular changes were observed either in the daily number of shocks or in the tremor amplitude and dominant frequency peaks. Similar characteristics can be observed in relation to the 1983 28 March Rank eruption. In Fig. 5, the daily values of the volcanic tremor amplitude, the number of shocks per day and the trends of the dominant peaks are plotted in the period 1983 January-July. In this case also, there is evidence of a down-shift of the dominant peaks which occurs in relation to an increment in the tremor amplitude and a seismic crisis, preceding the onset of the flank eruption by 24-48 hr. It is worth noting that the frequency trends preceding the onset of the eruptive episode are clearly defined, giving a Downloaded from https://academic.oup.com/gji/article-abstract/97/3/367/661726 by guest on 29 May 2020
  • 5. Internal dynamical process on Mt Etna zy 371 zy Table 1 . Frequency Average Standard Number of Time range frequency deviation data points Interval (H4 zyxwvu V) zyxw (4 zyx (n zyxw 1 1977 January 21-December 31 1977 August 10-December 31 1981 March 4-October 25 1981 March 4-March 15 1981 March 24-October 25 1983 January 1-July 10 1983 January 1-March 26 1983 1984 January 2- 1986 December 20 1984 October 16-November 9 1985 February23-March 6 1985 October 21-December 19 1986 May 29-August 18 1986 October 3-October 29 April 7-July 10 low-frequency trend high-frequency trend low-frequency trend high-frequency trend high-frequency trend low-frequency trend high-frequency trend high-frequency trend low-frequency trend high-frequency trend high-frequency trend high-frequency trend high-frequency trend high-frequency trend 1.00-2.25 2.35-3.55 1.w2.30 2.35-5.20 2.45-4.45 1.15-2.30 2.35-3.25 2.35-4.60 1.00-2.30 2.60-4.55 2.9 2.80-3.25 2.90-3.25 2.60-3.15 1.62 2.71 1.51 3.32 2.79 1.70 2.89 3.06 1.56 3.14 2.90 3.04 2.90 2.80 0.31 0.26 0.29 0.53 0.41 0.33 0.24 0.60 0.28 0.59 0.00 0.15 0.10 0.14 329 35 162 29 54 365 61 65 2287 9 6 65 39 3 0 low dispersion (a=0.24) and showing a tendency to migrate towards higher values. Soon after the frequency down-shift, the trends at lower values appear quite stable in time; while trends at higher frequency no longer exist or appear highly dispersed zyxwvutsrq (u= 0.6). During 1984, a subterminal eruption took place from the SE crater of Mt Etna. The plot of the parameters described above (Fig. 6) in this case shows neither any change in the frequency of the dominant peaks, nor a significant variation of the level of seismicity. As with the 1977 subterminal eruptions, the beginning of this one seems to be marked only by the enhancement of the volcanic tremor amplitude. In the time interval preceding the SE crater eruption, no particular trend is built up by the higher frequencies. It is interesting to observe that this eruption lasted for several months and came to an end in 1984 October in connection with the occurrence of a swarm of earthquakes. This seismic crisis is not accompanied by any significant change either in the values of the tremor amplitude or in the trends of the dominant peaks. Contrary to other swarms, which preceded the opening of eruptive fractures, these shocks showed a greater average focal depth (Cosentino et nl. 1986, 1989a). It is also worth noting that the trends of dominant peaks in the tremor spectra are particularly stable throughout the eruptive period, and peaks at values of 1.30, 1.45 and 1.75Hz can be easily detected from July to October (Figs 6 and 7). The end of 1984 and the beginning of 1985 are characterized by moderate explosive activity at the summit craters, so that the tremor amplitude values are relatively high (Fig. 7). On 1985 March 8, a new eruptive episode took place on Mt Etna. This eruption started with an increase in explosive activity and a small lava flow from the SE crater. Soon after, it evolved to a flank eruption with output of lava from a system of fractures belonging to the same fracture field of the 1983eruption (see Fig. 1). No significant changes either in the tremor amplitude values or the number of shocks can be observed. A small trend at relatively high frequency (2.9 Hz),which disappears before the onset of the eruption, is observed. The more complex character of this eruption, with respect to the 1981 and 1983 flank eruptions, seems to be represented by the time distribution of the dominant peaks. In fact, it is evident that the short trend at 2.9Hz, in this case, appears together with the trends of dominant peaks existing at the usual lower frequencies (1.0-2.3 Hz). The lack of a seismic crisis could be interpreted as a consequence of the coincidence of the eruptive fracture system for both this eruption and that in 1983. Trends of dominant peaks are very clearly defined on the plotted time interval and during the period 1985 April-September. In particular, three subtrends at fre- quencies 1.20, 1.45 and 1.75 Hz,respectively, can be easily detected (Figs 7 and 8). Figure 8 shows that dominant peaks at relatively high values start to appear in the spectra of volcanic tremor from 1985 September 25, and from October 21 they build up a very clear trend (2.80-3.25 Hz) showing u = 0.15. The daily number of shocks (Fig. 8b) is quite small and does not change significantly, while a moderate increase in the tremor amplitude (Fig. 8a) is observed in relation to the Occurrence of higher frequencies in the tremor spectra. A down-shift of dominant frequencies occurs on 1985 Downloaded from https://academic.oup.com/gji/article-abstract/97/3/367/661726 by guest on 29 May 2020
  • 6. 372 zyxwvutsr M. zyxwvutsr Cosentino zyxwvuts et al. zyxwvut 3. zyxwvutsrqpo 2.5- zyxwvutsrqponm - N I l L v 1. a 9 . .. 0 . . r r . - ' n ..--'- . . * . * . ... - . ? & -08.. -. .= . 9 *. . . - 0 ' . . ..-.:.' 9 . p;'' $--wb.;.- *n ) * . * . .... .- -2:ALll-J &**-- :,, *. - .. . . . --.. .. . - m * = . - 5 . - .. ..>: 2.- ......0 "0. ' . . w 1";"- * 1.5.m; = - - r & ~ . . ma. * . . a . ..w.a%*.". II ' zyxwvutsrq I 3,86 I Lli28 I !I L I C Downloaded from https://academic.oup.com/gji/article-abstract/97/3/367/661726 by guest on 29 May 2020
  • 7. 60. zyxwvutsrqponm N 5 zyxwvut 40 4 a zy I68 :I1 55145 8.1 b 4 4. 3.5 3- 2.5. zyxwvutsrqponmlk .'. zyxwv . m . . . * . .. .. zyxwv ' 8 . .. 9 . . . Flgnre 8. Amplitude of volcanic tremor (a), number of shocks per day (b) and time distribution of dominant peaks observed in the tremor spectra (c) during the period 1985 August-1986 March. See Fig. 4 for explanation of the symbols.
  • 8. 374 zyxwvutsr M. zyxwvutsrq Cosentino zyxwvutsr et al. zyxwvutsrq December 19, followed soon after by a sharp increment in the tremor amplitude as well as an increase in the daily number of shocks. These variations in the plotted parameters precede the opening of the fractures related to the eruption which took place in the Valle del Bove (see Fig. 1) on 1985December 25. From the end of the eruption to 1986 June (Figs 8 and 9) only the usual low frequencies, associated with resonance of the main feeding dykes of the volcano, can be detected in the plot of spectral dominant peaks (a zyxwvutsr = 0.28). As for the other parameters investigated, the values of the tremor amplitude are quite low, while a swarm of earthquakes occurred on 1986 May 7. Shocks belonging to this seismic crisis, as well as those which occurred in 1984, are located at a relatively high average depth (h >5 km) and no particular changes in the other plotted parameters can be detected. In Fig. 9 it can be observed that two trends at relatively. high frequency values (2.6-2.9 Hz) are present among dominant spectral peaks, for short time intervals, together with the usual lower values. The first trend at 2.9Hz appears in the period 1986 May 29-August 18. It is not coincident in time with other significant changes in the parameters plotted, except for a progressive increase in tremor amplitude which occurs at the same time as strombolian activity observed at all the summit craters. The second trend (2.60-3.15 Hz) appears in the period 1986 October 3-29. It is preceded by the occurrence of a rather deep (h >5 km) swarm of earthquakes. Moreover, the down-shift of dominant frequencies takes place at the same time as both the enhancement of tremor amplitude and a shallow seismic crisis which precedes, by a few hours, the opening of fractures linked to the flank eruption in the Valle del Bove (Fig. 1). 3 DISCUSSION AND CONCLUSIONS Seismic activity on Mt Etna is characterized by earthquakes having a minimum detectable magnitude of 2.0, but which can reach values of 4.5. The seismicity is randomly distributed both in time and space during periods of reduced activity existing between two successive eruptions, while it shows a tendency to cluster in various sectors of the volcano and to have an average shallow depth (h s 5 km) during swarms of earthquakes which precede the opening of eruptive fractures (Cosentino & Lombard0 1984; Cosentino et al. 1989a). Following the model used so far, volcanic tremor is interpreted as due to turbulence in the flow of piromagma which excites the ducts of the volcano. The frequencies observed in the spectrum represent the eigenfrequencies of different dykes which are excited by the rapid movement of the magma and its pressure fluctuations (Seidl, Schick & Riuscetti 1981; Kirbani 1983). Figure 10 shows some examples of volcanic tremor spectra and the corresponding time series, obtained during different stages of volcanic activity. It is interesting to observe that the spectra obtained during the quiet periods and those obtained during summit eruptions show a similar frequency content, and a sharp amplitude enhancement marks the eruptive stage. On the contrary, dominant frequencies, which usually range in the interval 1.0-2.3 Hz, move towards higher values in the pre-eruptive periods of flank eruptions and shift again towards the usual lower values shortly before the eruption onset. The results of the analysis of tremor data, recorded on Mt Etna since 1977, are summarized in Fig. 11, where two main frequency ranges are shown: a trend of spectral dominant peaks, stable in time, which ranges in the interval 1.0-2.3 Hz; and a trend at relatively high frequencies (>2.3 Hz) which appears from time to time in the tremor spectra. The higher frequencies (>2.3 Hz) can be related to shallow and/or small secondary dykes, while relatively low frequencies (1.0-2.3 Hz) are linked to big and deep dykes interpreted as the main ducts of the volcano feeding system (Cosentino et al. 1989b). Following these considerations, an attempt has been made to put the seismic characteristics and eruptive events observed so far on the volcano into the framework of a preliminary dynamical model. Mount Etna shows permanent activity at its four summit craters (Fig. 1). Many classifications have been proposed for the different volcanic activities, but according to our data, from a seismological point of view, two main eruptive phenomena can be distinguished: (i) summit eruptions, which take place from the main vents, characterized by strombolian activity and/or lava flows; (ii) flank eruptions, which take place from fractures opening in the slopes of the volcano. The onset of a summit eruption (terminal or subterminal) is not accompanied by any significant change (Fig. 11) either in the dominant peaks of the tremor spectra or in the seismic pattern. The sudden increment in explosive activity and the paroxysmal stage, typical of summit eruptions, is marked only by the sharp enhancement of the tremor amplitude (Figs 3, 6 and 9). Therefore, summit eruptions can be modelled in two stages (Fig. 12). The first stage represents the standard conditions of volcanic activity during ‘quiet’ periods. Magma partially fills the main ducts without any particular turbulence. This can be deduced from the spectra of the volcanic tremor which show a low energy content and a small amplitude of the spectral peaks typically associated with resonance in the main feeding ducts (see Fig. 2). A low daily occurrence frequency of earthquakes which take place randomly both in time and space, is observed. Stage two is characterized by a sudden and violent increase in magma turbulence. This causes a sharp enhancement of the rms spectral amplitude and a significant increase in the amplitude of each dominant peak existing in the frequency band (1.0-2.3 Hz) associated with the main feeding ducts. No particular changes are observed in the rate of seismicity. All summit eruptions which have occurred on Mt Etna since 1977 show such phenomena (Fig. 11). Laboratory experiments (Schick, personal communica- tion) have demonstrated that it is possible to simulate a summit eruption by simply heating a fluid (liquid and solid) until turbulence starts and gas bubbles reach a dimension comparable to the size of the pipe of the laboratory sample bulb. The same result (a sudden extrusion of the overheated fluid) can be obtained using a sample bulb having a top pipe whose section can be toughened to a critical size. Thus, the Downloaded from https://academic.oup.com/gji/article-abstract/97/3/367/661726 by guest on 29 May 2020
  • 9. Internal dynamical process zyx on Mt E m zy 375 0.. zyxwvutsrqponm 1zyxwv M . . zyxwvutsrqponmlkj . I . 0 . 0 0 " c 0 . 0 2 . zyxwvutsrqpon L I N rnca tr(. I 1 0 - 7 0 7 ,"V 0 L O I I R C t6CC I C Z . 6 - V I . 1 . 0 . 0 0 ,:t : 0 . 0 2 5 L l N FnEOtM., I 0 X.- . . .. .¶ 2 0 . 0 0 0 . 0 2 % 1 0 X... r 2 - 7 0 7 - V C T I M E ,6 L C I La $ 2 . 5 m v - 0 . 0 2 s L I N rncolr(.: * C Flgme 10. Examples of seismograms and corresponding spectra of volcanic tremor recorded during different stages of activity. (a) Quiet period, (b) summit eruption (1977 December), (c) pre-eruptiveperiod (before the flank eruption of 1983 March) and (d) flank eruption (1983 March). Downloaded from https://academic.oup.com/gji/article-abstract/97/3/367/661726 by guest on 29 May 2020
  • 10. 376 zyxwvutsr M. zyxwvutsrq Cosentino zyxwvuts et zyxwvutsrq al. zyxwvutsr t 1.40Hz A (rnV rm A(rnVrrnr Figure U.Sketch model explaining the mechanism of the summit eruptions and corresponding changes in the volcanic tremor spectra. zy eruptive mechanism of the summit eruptions seems to be linked to changes in the thermodynamic equilibrium or the geometrical constraints of the feeding system. eruptions imply that it is not possible, using the parameters investigated so far, to discover any significant precursor as there is no time delay between the increase in tremor amplitude and the beginning of eruptive activity. Since 1977, five flank eruptions have occurred on Mt Etna The characteristics observed for the etnean summit (1981, 1983, 1985 March and December, 1986). Before each of these eruptions, clear trends at high frequency (>2.3 H z ) have been observed in the spectral dominant peaks of the Downloaded from https://academic.oup.com/gji/article-abstract/97/3/367/661726 by guest on 29 May 2020
  • 11. Internal dynamical process on Mt Etna zy 377 z W. zyxwvutsrqpon Sketch model explaining the mechanism of the flank eruptions and correspondingchanges in the volcanic tremor spectra. Downloaded from https://academic.oup.com/gji/article-abstract/97/3/367/661726 by guest on 29 May 2020
  • 12. 378 zyxwvutsr M. zyxwvutsrq Cosentino zyxwvuts et al. zyxwvutsrq volcanic tremor (Fig. 11). These frequency trends shift towards lower values (1.0-2.3Hz) some hours (from 6 to 48 hr) before the opening of the eruptive fractures. The down-shift is almost contemporaneous with the occurrence of both earthquake swarms and a sharp enhancement of the tremor amplitude (Figs 4, 5, 7, 8 and 9). Observations of high frequencies in the tremor signal, shifting towards lower values, are not common in the literature. Sassa (1936) describes a shift of the mean period of volcanic tremor towards high values occurring almost at the same time as an increase in the tremor amplitude which is linked to the increment of eruptive activity on Aso volcano. Preliminary observations concerning changes in the frequency content of volcanic tremor on Mt Etna have been described for the 1983 flank eruption (Cosentino zyxwvut et al. 1984). The lack of several data available in that period did not allow us to set this phenomenon into a wider context. The systematic occurrence of this phenomenon in relation to all studied flank eruptions (Fig. 11) leads the authors to propose a preliminary interpretative model for flank eruptions as well as for summit eruptions. According to the seismic data, three different stages can be recognized in the dynamical processes taking place in the volcano before the occurrence of flank eruptions (Fig. 13). Stage one is similar to that of summit eruptions; in other words, it represents the standard conditions of volcanic activity during the so-called ‘quiet’ periods. Stage two is an intermediate stage characterized by possible feeding of magma from below and by fracturation processes and/or partial intrusion of magma into the shallower parts of the volcano. As a consequence of these phenomena, high-frequency trends (<2.3 Hz) are observed. In the model adopted for etnean volcanic tremor, they may be associated with resonance of small and/or shallow dykes filled with magma. Seismic activity occurs randomly during this time interval and it could be related to intrusion phenomena. Occasionally, swarms of earthquakes having a greater than average depth (h zyxwvutsrq >5 km) have been observed to precede in time the high-frequency trends (Fig. 11). Such phenomena, which can be assumed to be linked to the recharging of the volanic system (Cosentino & Lombardo 1984), characterize an unstable condition of the volcano. This unstable stage can go backwards to quiet conditions (stage one) without changes in the other parameters, or it can evolve to stage three when a seismic crisis takes place on the volcano (Fig. 11). Stage three is connected with an intense fracturation due to both the modifications of the physical properties of the rocks because of the magma intruded and to the local and regional stress field acting on the volcano. This process, similar to a feed-back mechanism, implies that the fractures can reach the surface producing the output of lava so that a flank eruption will start. The dominant peaks observed in the spectra shift towards lower frequencies as turbulence and then resonance become predominant in the main feeding dykes. Thus, the spectra show both a sharp increase in the rms spectral amplitude and an increment in the amplitude of each dominant peak in the usual low-frequency band. All flank eruptions which have occurred on Mt Etna since 1981 (Fig. 11) show such characteristics except for the 1985 March flank eruption which, as previously described, took place without any seismic crisis. A tight time dependence between flank eruptions and both summit eruptions and earthquake swarms was also obtained, using a statistical approach, by Sharp, Lombardo & Davis (1981). Both summit eruptions and earthquake swarms were in fact found to precede, in a statistically significant way, the occurrence of flank activities. Therefore the fracture process linked to the seismic crises seems to be the trigger for flank eruptions. Volcanic activity is evident a few hours (6-48 hr) after modification of the equilibrium of the system has taken place. This implies that every time a simultaneous variation of all three parameters is observed, the opening of eruptive fractures follows soon after. Therefore, a short-term precursor can be recognized. It seems reasonable that the time interval between the variation of seismic parameters and the onset of the eruption is a function of the ‘weakness’ of the volcanic sector influenced by the stress increment. It has in fact been observed that the duration of the precursor phenomena is quite small (few hours) for all the eruptions which took place on the eastern flank of Mt Etna, where a calderic area exists. On the other hand, the flank eruptions on the northern and southern slopes of the volcano (1981 and 1983, respectively) show that the precursor phenomena preceded the opening of the eruptive fractures by 24-48 hr. It is important to note that the occurrence of a seismic crisis is not necessarily a precursor of flank activity (e.g. the swarm of 1984October). In this case, the crisis occurrence is not coincident with the ‘down-shift’ of dominant fre- quencies, and this should imply that the critical stage, when fractures intersect the surface, has not yet been reached. Although the proposed model is somewhat speculative, it is founded both upon quite a large set of instrumental seismic data and a tight correlation with visual observations. It is the opinion of the authors that this approach appears to be a promising one for the understanding of the dynamic processes taking place on Mt Etna. Of course, as the reliability of a model is a function of the number of parameters simultaneously investigated, significant improve- ment could be reached by the comparison with data concerning ground deformations and source parameters of earthquakes. ACKNOWLEDGMENTS The authors thank Dr S. Falsaperla for useful discussions and advice and Professor R. Scarpa for critical reading of the manuscript. REFERENCES Barbano, M. S., Copsey, J., Cosentino, M., Lombardo, G., PatanC, G., Riuscetti, zyxw M.,Viglianisi, A. & Villari, P., 1979. Primi risultati della rete di sorveglianza sismica dell’Etna, Atfi Conuegno P.F. ‘Geodinamica’,235, 219-271. Bottari, A. & Riuscetti, M.,1967. La stazione sismica di Serra la Nave sull’Etna, Ann. Geofis., 20, 243-264. Cosentino, M., 1982. Relationship between seismicity and eruptive activity of Mt. Etna, Mem. SOC. Geol. It., 23, 174-181. Cosentino, M., Gresta, S., Lombardo, G., PatanC, G., Riuscetti, M., Schick, T. & Viglianisi, A., 1984. Features of volcanic tremors on Mt. Etna (Sicily) during the March-August 1983 eruption, Bull. Volcanol., 47-4(2), 929-939. Cosentino, M. & Lombardo, G., 1984. A model for eruptive Downloaded from https://academic.oup.com/gji/article-abstract/97/3/367/661726 by guest on 29 May 2020
  • 13. Internal dynamical process on Mt Etna zy 379 zy mechanismsof Mt. Etna from the study of seismicityfrom 1978 to 1983, Bull. Volcanol., zyxwvutsrqp 47-4(2), 977-993. Cosentino, M., Di Francesco, M., Lombardo, G. zyxwvutsr & Privitera, E., 1986. Attivita sismica e tremore vulcanico nell'area etnea: stato delle conoscenze e loro significato nello studio dei fenomeni precursori dell'attivita vulcanica, CNR Gruppo Nazionale per la Vulcanologia, Boll., 1986, 183-200. Cosentino, M., Di Francesco, zyxwvutsr M.,Lombardo, G. & Sharp, A. D. L., 1989a. The seismicity of the etnean area and its relationships to eruptive activity (1978-1985), 1. Volc. georh. Rex, in press. Cosentino, M., Lombardo, G., Privitera, E., Riuscetti, M. & Schick, R., 1989b. Analysis of volcanic tremor at Mt. Etna and its relation to seismo-eruptiveactivity, J. Phys. Earth, in press. Gresta, S., Clot, J. P. & PatanC, G., 1985. Studio di meccanismi focali di terremoti etnei, CNR, Atri zyxwvutsrq 4" Conuegno GNGTS, Roma 1985, pp. 809-814. Kirbani, S. B., 1983. Analysis and interpretation of volcanic tremors at Etna, Imt. Geophysik Uniu. Stuttgart, Publ. no. 20. Morse, P. M. & Ingard, K. U., 1968. Theoretical Acoustics, McGraw Hill, New York. Randall, R. B., 1977. Frequency Analysis, Naeum Offset, Denmark. Sassa, K., 1936. Micro-seismometric study on eruption of the volcano Aso, part I1 of the geophysical studies on the volcano Aso, Mem. College of Science, Kyoto Imperial University, A19, Scarpa, R., Patank, G. & Lombardo, G., 1983. Space-time evolution of seismic activity at Mt. Etna during 1974-1982, Ann. Geophys., 1 ( 6 ) , 451-462. Schick, R., Cosentino, M.,Lombardo, G. & Patank, G., 1982a. Volcanic tremors at Mt. Etna: a brief description, Mem. SOC. Geol. It., 23, 191-196. Schick, R., Lombardo, G. & Patank, G., 1982b. Volcanic tremors and shocks associated with eruptions at Etna (Sicily), September 1980,J. Vofc.georh. Res., 14, 261-279. Seidl, D., Schick, R. & Riuscetti, M., 1981. Volcanic tremors at Etna: a model for hydraulic origin, Bull. Volcanol., 4 4 ,43-56. Sharp, A. D. L., Davis, P. M. & Gray, F., 1980. A low velocity zone beneath Etna and magma storage, Nature, 287, 587-591. Sharp, A. D. L., Lombardo, G. & Davis, P. M., 1981. Correlation between eruptions of Mount Etna, Sicily, and regional earthquakes as seen in historical records from 1582 A.D., Geophys. J. R. astr. SOC.,65, 507-523. 11-65. Downloaded from https://academic.oup.com/gji/article-abstract/97/3/367/661726 by guest on 29 May 2020