Analyzing website performance of Amazon and competitors using Google Analytics and Similarweb
1. Hello everyone, Good afternoon. Today me & Astha will give presentation.
So our 1st
topic of presentation is to find out whether yelfp.com is using google analytics or not & if
using google analytics then showcase your method.
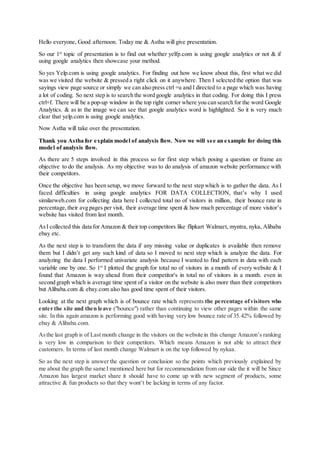
So yes Yelp.com is using google analytics. For finding out how we know about this, first what we did
was we visited the website & pressed a right click on it anywhere. Then I selected the option that was
sayings view page source or simply we can also press ctrl +u and I directed to a page which was having
a lot of coding. So next step is to search the word google analytics in that coding. For doing this I press
ctrl+f. There will be a pop-up window in the top right corner where you can search for the word Google
Analytics. & as in the image we can see that google analytics word is highlighted. So it is very much
clear that yelp.com is using google analytics.
Now Astha will take over the presentation.
Thank you Astha for explain model of analysis flow. Now we will see an example for doing this
model of analysis flow.
As there are 5 steps involved in this process so for first step which posing a question or frame an
objective to do the analysis. As my objective was to do analysis of amazon website performance with
their competitors.
Once the objective has been setup, we move forward to the next step which is to gather the data. As I
faced difficulties in using google analytics FOR DATA COLLECTION, that’s why I used
similarweb.com for collecting data here I collected total no of visitors in million, their bounce rate in
percentage, their avg pages per visit, their average time spent & how much percentage of more visitor’s
website has visited from last month.
AsI collected this data for Amazon & their top competitors like flipkart Walmart, myntra, nyka, Alibaba
ebay etc.
As the next step is to transform the data if any missing value or duplicates is available then remove
them but I didn’t get any such kind of data so I moved to next step which is analyze the data. For
analyzing the data I performed univariate analysis because I wanted to find pattern in data with each
variable one by one. So 1st
I plotted the graph for total no of visitors in a month of every website & I
found that Amazon is way ahead from their competitor's in total no of visitors in a month. even in
second graph which is average time spent of a visitor on the website is also more than their competitors
but Alibaba.com & ebay.com also has good time spent of their visitors.
Looking at the next graph which is of bounce rate which represents the percentage ofvisitors who
enter the site and then leave ("bounce") rather than continuing to view other pages within the same
site. In this again amazon is performing good with having very low bounce rate of 35.42% followed by
ebay & Alibaba.com.
Asthe last graph is of Last month change in the visitors on the website in this change Amazon’s ranking
is very low in comparison to their competitors. Which means Amazon is not able to attract their
customers. In terms of last month change Walmart is on the top followed by nykaa.
So as the next step is answer the question or conclusion so the points which previously explained by
me about the graph the same I mentioned here but for recommendation from our side the it will be Since
Amazon has largest market share it should have to come up with new segment of products, some
attractive & fun products so that they wont’t be lacking in terms of any factor.
![[Elite Camp 2016] Yehoshua Coren - Strategic And Tactical Implementation And ...](data:image/gif;base64,R0lGODlhAQABAIAAAAAAAP///yH5BAEAAAAALAAAAAABAAEAAAIBRAA7)