
Recommended
More Related Content
What's hot
What's hot (20)
Similar to Synchronous Machine Research Background
Similar to Synchronous Machine Research Background (20)
Recently uploaded
Recently uploaded (20)
Synchronous Machine Research Background
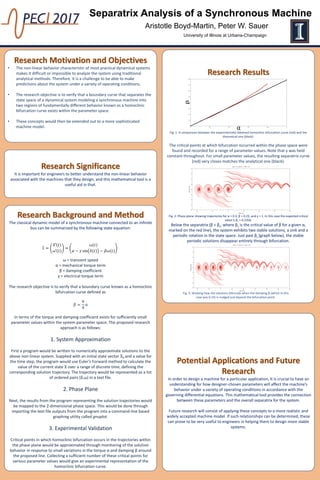
- 1. Research Background and Method The classical dynamic model of a synchronous machine connected to an infinite bus can be summarized by the following state equation: δ = internal machine voltage angle ω = transient speed α = mechanical torque term β = damping coefficient γ = electrical torque term The research objective is to verify that a boundary curve known as a homoclinic bifurcation curve defined as β = π 4 α in terms of the torque and damping coefficient exists for sufficiently small parameter values within the system parameter space. The proposed research approach is as follows: 1. System Approximation First a program would be written to numerically approximate solutions to the above non-linear system. Supplied with an initial state vector X0 and a value for the time step, the program would use Euler’s Forward method to calculate the value of the current state X over a range of discrete time, defining the corresponding solution trajectory. The trajectory would be represented as a list of ordered pairs (δ,ω) in a text file. 2. Phase Plane Next, the results from the program representing the solution trajectories would be mapped to the 2-dimensional phase space. This would be done through importing the text file outputs from the program into a command-line based graphing utility called gnuplot. 3. Experimental Validation Critical points in which homoclinic bifurcation occurs in the trajectories within the phase plane would be approximated through monitoring of the solution behavior in response to small variations in the torque α and damping β around the proposed line. Collecting a sufficient number of these critical points for various parameter values would give an experimental representation of the homoclinic bifurcation curve. Separatrix Analysis of a Synchronous Machine Aristotle Boyd-Martin, Peter W. Sauer Research Significance It is important for engineers to better understand the non-linear behavior associated with the machines that they design, and this mathematical tool is a useful aid in that. Research Motivation and Objectives • The non-linear behavior characteristic of most practical dynamical systems makes it difficult or impossible to analyze the system using traditional analytical methods. Therefore, it is a challenge to be able to make predictions about the system under a variety of operating conditions. • The research objective is to verify that a boundary curve that separates the state space of a dynamical system modeling a synchronous machine into two regions of fundamentally different behavior known as a homoclinic bifurcation curve exists within the parameter space. • These concepts would then be extended out to a more sophisticated machine model. Potential Applications and Future Research In order to design a machine for a particular application, it is crucial to have an understanding for how designer-chosen parameters will affect the machine’s behavior under a variety of operating conditions in accordance with the governing differential equations. This mathematical tool provides the connection between these parameters and the overall separatrix for the system. Future research will consist of applying these concepts to a more realistic and widely accepted machine model. If such relationships can be determined, these can prove to be very useful to engineers in helping them to design more stable systems. Research Results Fig. 1: A comparison between the experimentally obtained homoclinic bifurcation curve (red) and the theoretical one (black). The critical points at which bifurcation occurred within the phase space were found and recorded for a range of parameter values. Note that γ was held constant throughout. For small parameter values, the resulting separatrix curve (red) very closes matches the analytical one (black). Fig. 2: Phase plane showing trajectories for α = 0.3, β = 0.23, and γ = 1. In this case the expected critical value is βc = 0.2356. Below the separatrix (β < βc, where βc is the critical value of β for a given α, marked on the red line), the system exhibits two stable solutions, a sink and a periodic rotation in the state space. Just past βc (graph below), the stable periodic solutions disappear entirely through bifurcation. University of Illinois at Urbana-Champaign Fig. 3: Showing how the solutions bifurcate when the damping β (which in this case was 0.24) is nudged just beyond the bifurcation point.