
Recommended
Recommended
More Related Content
Similar to 1. Intro DS.pptx
Similar to 1. Intro DS.pptx (20)
More from Anusuya123
More from Anusuya123 (14)
Recently uploaded
Recently uploaded (20)
1. Intro DS.pptx
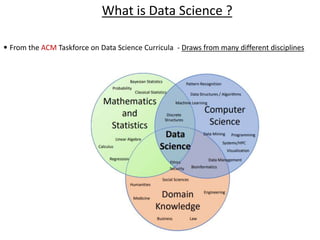
- 1. • From the ACM Taskforce on Data Science Curricula - Draws from many different disciplines What is Data Science ?
- 3. • Statistics; – a central component of data science. Why? – statistics studies how to make robust conclusions with incomplete information. • Computing – is a central component because – programming allows us to apply analysis techniques to the large and diverse data sets that arise in real-world applications: – not just numbers, but text, images, videos, and sensor readings. • Domain Knowledge – Through understanding a particular domain, data scientists learn to ask appropriate questions about their data and correctly interpret the answers provided by our inferential and computational tools. Data science is all of these things, but it is more than the sum of its parts because of the applications. What is Data Science ?
- 5. What is Foundations of Data Science? • Drawing useful conclusions from data using computation • Exploration – Identifying patterns in information – Uses visualizations • Inference – Quantifying whether those patterns are reliable – Uses randomization – quantifying our degree of certainty: will those patterns we found also appear in new observations? How accurate are our predictions? • Prediction – Making informed guesses – Uses machine learning
- 6. • A foundation in DS requires – Not just understand statistical and computational techniques, – but also recognizing how they apply to real scenarios. • Whatever aspect of the world we wish to study— Earth’s weather/markets/ polls – data we collect typically offer an incomplete description of the subject at hand. – A central challenge of data science - make reliable conclusions using partial information. • In this endeavor, combine two essential tools: computation and randomization. – Computing skills • will allow us to use all available information to draw conclusions. • Rather than focusing only on the average temperature of a region, we will consider the whole range of temperatures together to construct a more nuanced analysis. – Randomness • allow us to consider the many different ways in which incomplete information might be completed. • Rather than assuming that temperatures vary in a particular way, we will learn to use randomness as a way to imagine many possible scenarios that are all consistent with the data we observe. Data Science
- 7. Statistical Techniques • The discipline of statistics has long addressed the same fundamental challenge as data science: how to draw robust conclusions about the world using incomplete information. • An important contributions of statistics : consistent and precise vocabulary for describing the relationship between observations and conclusions. • Follow the same tradition, focus on a set of core inferential problems from statistics: – testing hypotheses, – estimating confidence, and – predicting unknown quantities.
- 8. Data Science…Goes beyond Statistics • Data science extends the field of statistics by taking full advantage of – computing, – data visualization, – machine learning, – optimization, and – access to information. • The combination of fast computers and the Internet gives anyone the ability to access and analyze vast datasets: – millions of news articles, – full encyclopedias, – databases for any domain, and – massive repositories of music, photos, and video. • Challenge - Real data often do not follow regular patterns/ match standard equations. • The interesting variation in real data can be lost by focusing too much attention on simplistic summaries such as average values.
- 9. Tools • Recommend the Anaconda distribution that packages together the Python 3 language interpreter, IPython libraries, and the Jupyter notebook environment. • Complete introduction to all of these computational tools. • Learn to write programs, generate images from data, and work with real-world data sets that are published online.
- 10. Course Structure
- 11. FOUNDATIONS OF DATA SCIENCE 3-0-0-3 • Unit-1 Introduction, Causality and Experiments, Data Preprocessing: Data cleaning, Data reduction, Data transformation, Data discretization. Visualization and Graphing: Visualizing Categorical Distributions, Visualizing Numerical Distributions, Overlaid Graphs, plots, and summary statistics of exploratory data analysis, Randomness, Probability, Introduction to Statistics, Sampling, Sample Means and Sample Sizes. • Unit-2 Descriptive statistics – Central tendency, dispersion, variance, covariance, kurtosis, five point summary, Distributions, Bayes Theorem, Error Probabilities; Permutation Testing, Statistical Inference; Hypothesis Testing, Assessing Models, Decisions and Uncertainty, Comparing Samples, A/B Testing, P-Values, Causality. • Unit-3 Estimation, Prediction, Confidence Intervals, Inference for Regression, Classification, Graphical Models, Updating Predictions. TEXT BOOKS/ REFERENCES: • Adi Adhikari and John DeNero, “Computational and Inferential Thinking: The Foundations of Data Science”, e-book. • Data Mining for Business Analytics: Concepts, Techniques and Applications in R, by Galit Shmueli, Peter C. Bruce, Inbal Yahav, Nitin R. Patel, Kenneth C. Lichtendahl Jr., Wiley India, 2018. • Rachel Schutt & Cathy O’Neil, “Doing Data Science” O’ Reilly, First Edition, 2013. Course Outcomes • CO1: Understand the statistical foundations of data science. • CO2: Learn techniques to pre-process raw data so as to enable further analysis. • CO3: Conduct exploratory data analysis and create insightful visualizations to identify patterns. • CO4: Introduce machine learning algorithms for prediction/classification and to derive insights. • CO5: Analyze the degree of certainty of predictions using statistical test and models.
- 12. Evaluation Pattern (70:30) • Internal – 70 PT1 & PT2(max 50 mks) - weightage 30 mks(15 each) • Thy -25 mks ; lab ex – 25 mks • Exam in Lab (2 hrs test + 1 hr for evaluation) Continuous Evaluation (weightage 40 mks) • Labs – 4 evaluations (10 mks each) • Final Examination - 30 End Semester Examinations (max 50 mks) - weightage 30 mks • Thy -25 mks ; lab ex – 25 mks • Exam in Lab (2 hrs test + 1 hr for evaluation)
- 13. Instructions to Students • FoDS will be handled in a flipped class room format • Students are expected to bring their laptop to the class room
- 15. Explore statistics for two classic novels • The Adventures of Huckleberry Finn by Mark Twain, and Little Women by Louisa May Alcott. • Books published before 1923 are currently in the public domain..Project Gutenberg is a website that publishes public domain books online. • Using Python, we can load the text of these books directly from the web. • First, read the text of both books into lists of chapters, called huck_finn_chapters and little_women_chapters.