Download to read offline


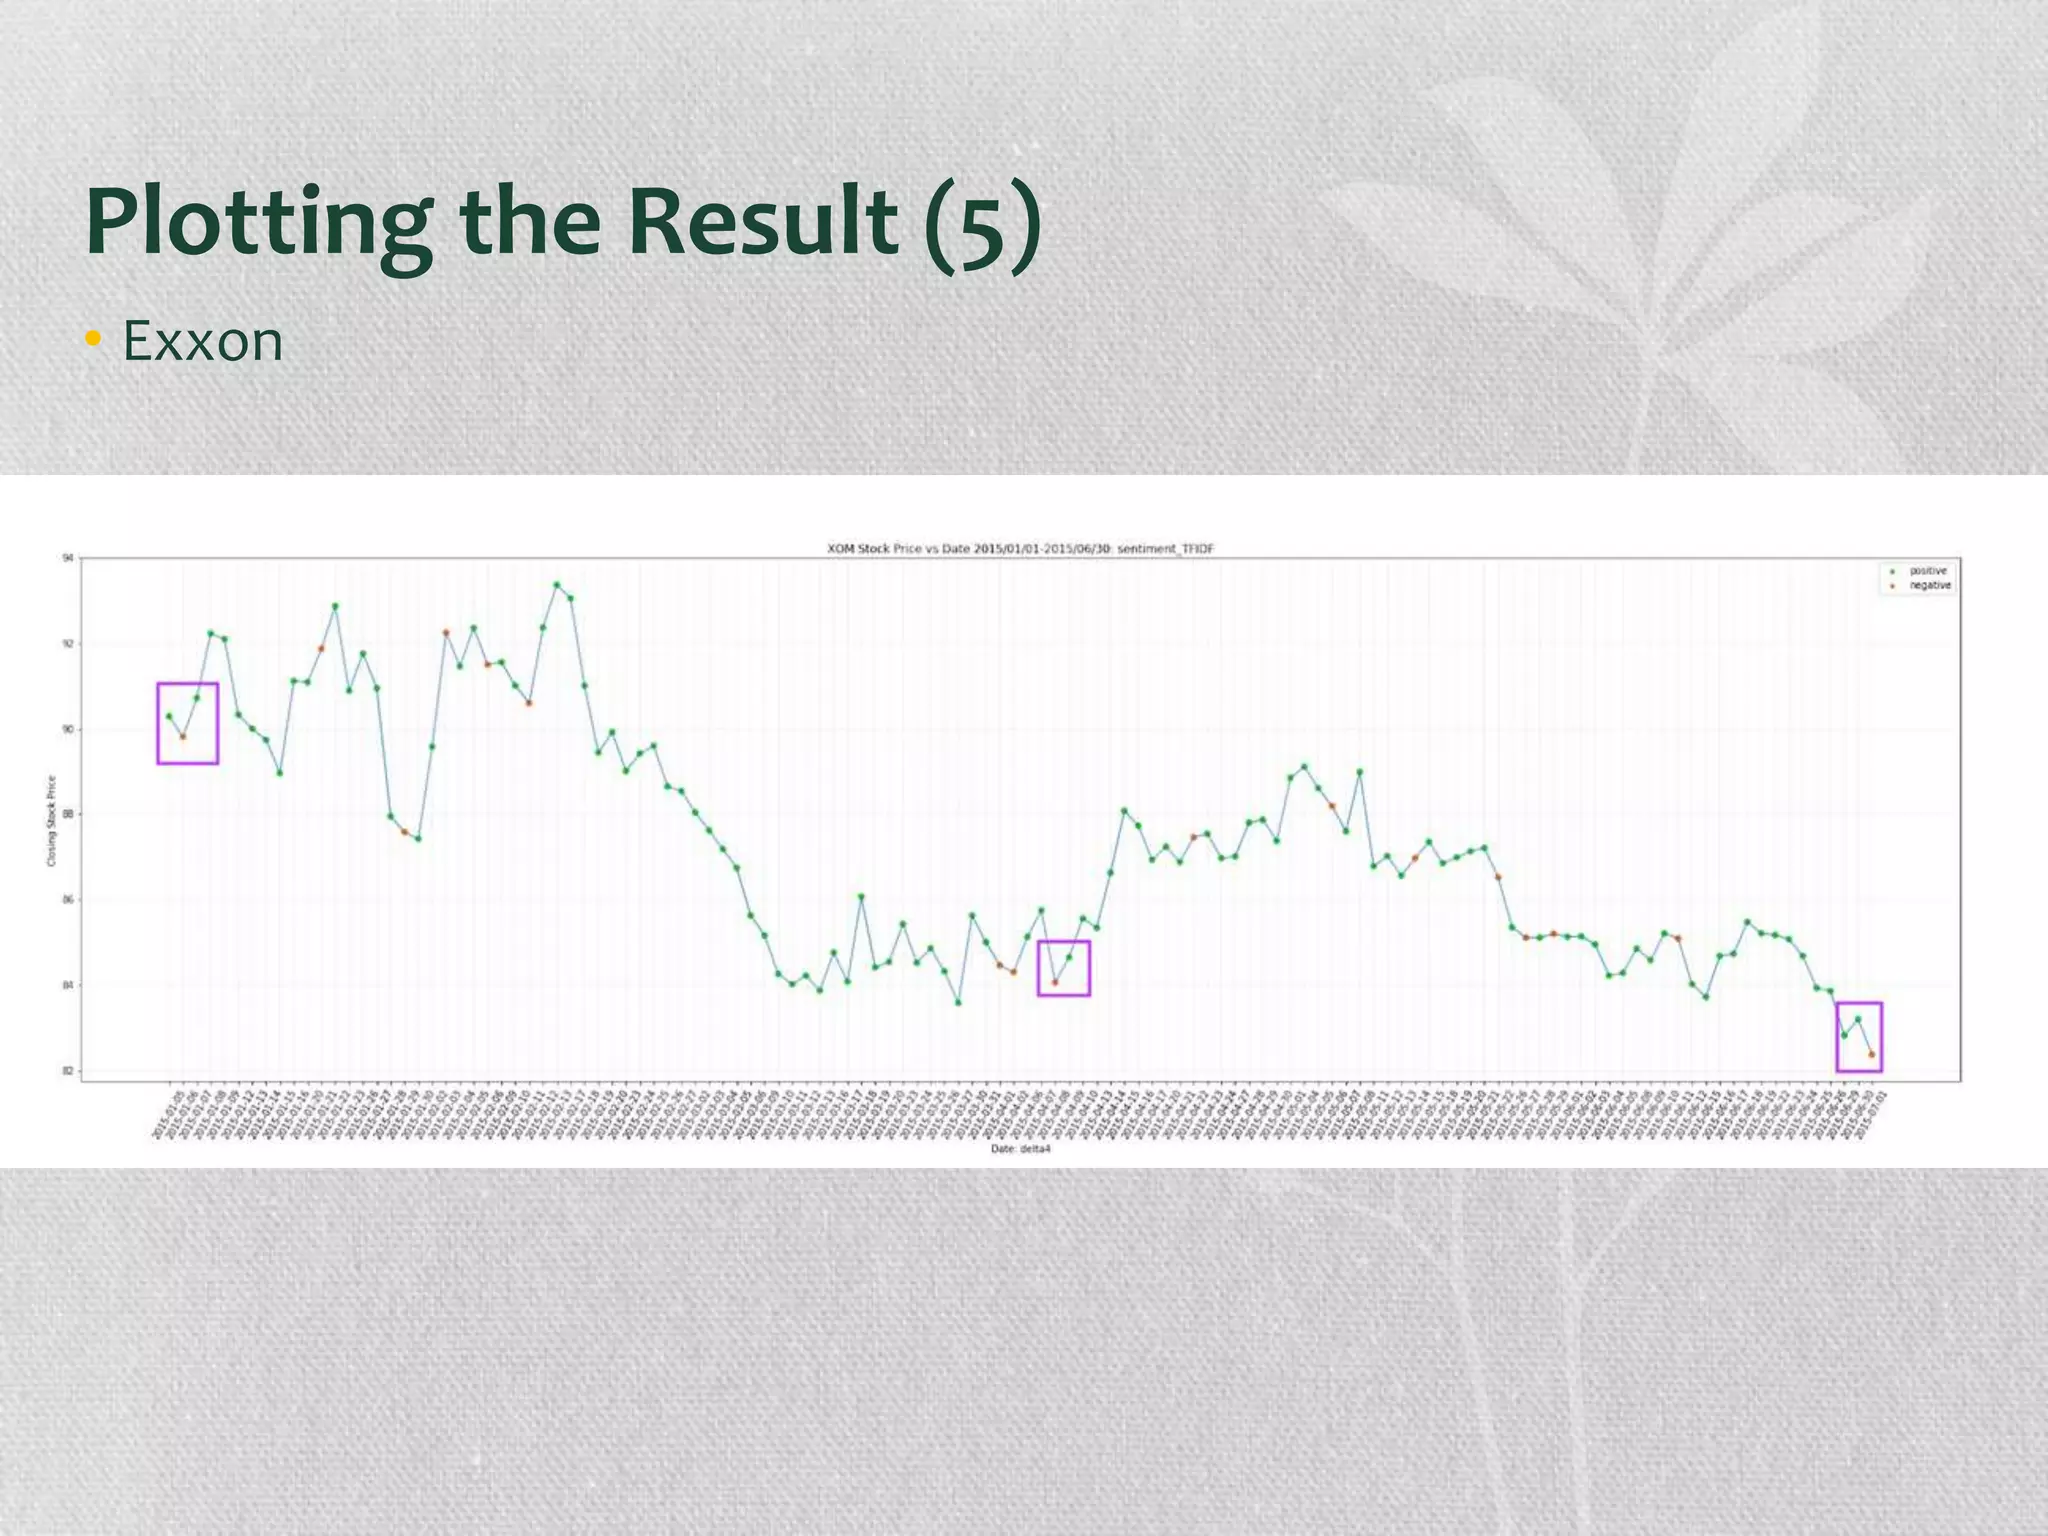

The document presents research on the correlation between the sentiment of environmental tweets and stock market fluctuations, using a dataset of over 5 million tweets analyzed through various machine learning and natural language processing techniques. Key findings suggest a potential correlation between negative sentiment and stock price declines, though challenges such as tweet positivity and varying corporate focuses were noted. Future work includes improving filtering strategies and expanding analysis models.