More Related Content
Similar to Ashg poster sp_compressed
Similar to Ashg poster sp_compressed (20)
Ashg poster sp_compressed
- 1. Analysis of PCR Duplicates and Library Diversity in RNA-Seq
Smita Pathak1, Irina Khrebtukova1, Angelica Barr1, Felix Schlesinger1, Tim Hill1, Lisa Watson1,
Abstract
In DNA sequencing, duplicates or reads that map to the same position are discarded but in RNA sequencing (RNA-Seq),
these reads can represent highly expressed genes. The issue of duplicates in RNA-Seq is even more complicated in low
input or degraded samples. Higher percentages of duplicates in very low input and degraded samples are routinely
observed in RNA-Seq using standard bioinformatics tools such as Picard but the source of duplicates is commonly
misunderstood. Under normal assay conditions, and with recommended input levels, three different RNA-Seq assays give
different apparent numbers of duplicates on the same standard UHRR and Brain RNA samples. These differences are not
necessarily due to PCR artifacts but occur because of the differences in complexity between the coding regions, the
mRNA, and the total RNA of a cell. When we measure true PCR duplicates using a molecular barcoding approach, it
becomes clear that there are much lower levels of potential PCR duplicates in standard RNA-Seq preps. However, we find
that when reducing input amounts for any of these three assays to 10ng or less, we observe dramatic increases in
percentage of duplicates. This value then becomes an important metric for overall efficacy of the experiment.
I. UMI Barcoding
The standard TruSeq® forked adaptor was modified to include a Unique Molecular Index (UMI), a 5 base random N
sequence in the index of read 1. The read 2 index was not modified, allowing pooled samples to demultiplex by read 2
only. The sequence of the UMI tag was used in combination with alignment information to count true PCR duplicates. Only
fragments that had the same alignment position and the same UMI sequence were considered true PCR duplicates. When
using the Illumina TopHat BaseSpace® Application, the duplicates metric is calculated at a read depth of 4M reads.
Figure 1: UMI Barcode in read1 Index of TruSeq forked adaptor allows separation of PCR duplicates
from “apparent” duplicates
Ryan Kelley1, Tatjana Singer1, and Gary P. Schroth1
1Illumina, Inc. 5200 Illumina Way, San Diego, CA 92122
Modied Forked Adaptor
NNNNN
NNNNN
II. Three RNA Sample Preparation Workflows
UMIs were used to track individual molecules through three different sample preparation workflows. TruSeq Stranded
mRNA uses oligo dT beads to capture poly-A tails of RNA, TruSeq RNA Access uses enrichment to select for the coding
region of the transcriptome using capture probes followed by purification with magnetic streptavidin beads, and the
TruSeq Stranded Total RNA workflow removes rRNA and mtRNA via specific cRNA probes and removal with capture
beads.
A B
Total RNA
5’ 3’
TruSeq Total RNA
TruSeq RNA Access cDNA Library from Total RNA
Fragmentation
(Fresh Frozen RNA)
Priming with random hexamers
5’ 3’
TruSeq mRNA
5’ 3’
AAAAAAAA
TTTTTTTT
DNA-RNA Hybrid First Strand Synthesis
Second Strand Synthesis
3’ 5’
5’ 3’
with dUTP Double Stranded cDNA U U U U
3’ 5’
cDNA with Forked Adaptor U U U U A- Tailing and Adaptor Ligation
PCR
Fragmented RNA/FFPE
3’ 5’
5’ 3’
3’ 5’
p7 Adaptor p5 Adaptor
Final cDNA Library
with Strand Specicity
3’ 5’
Hybridization with Biotinylated
Exome Capture Probes
Streptavidin - Magnetic
Bead Binding
Biotinyated Probe Hybrid
Capture
3’
3’ 5’
Removal of unbound and nonspecically
bound material by heated washing
Elution from Bead
PCR
Final exome-targeted
cDNA Library
5’
3’ 5’
3’ 5’
p7 Adaptor p5 Adaptor
Sequencing
for mRNA/Total RNA
Sequencing for RNA Access
Figure 2: Sample Preparation Workflows
(A) Library Preparation for 3 different workflows: mRNA selects for coding regions of RNA via poly-A selection, RNA Access selects by enrichment,
and the Total RNA workflow depletes rRNA/mtRNA. Sequencing is performed after library preparation for mRNA and Total RNA workflows.
(B) Enrichment workflow for RNA Access only
III. PCR Cycling Study
In order to determine the effects of PCR cycling, we used the TruSeq Stranded mRNA workflow with the standard 100ng
input and varied the number of PCR cycles from 0 to 35 cycles in increments of 5 cycles. All samples were sequenced
on an Illumina NextSeq® 500 sequencing system, using 2 x 76 bp paired-end run. Universal Human Reference RNA
(UHRR) and Human Brain RNA (Brain) samples all had less than 6% duplicates as measured with the UMI across all
cycling conditions, based on our standard BaseSpace TopHat Alignment Application. Both showed the same trend of
increasing percent duplicates with increasing PCR cycles from less than 1% UMI duplicates at 0 cycles to 6% at 10 cycles.
After 10 cycles, no increase in duplicates was observed. Note that in standard TruSeq RNA prep kits, we only recommend
15 cycles of PCR.
A
B C
D E F
Figure 3: Duplicates from PCR Cycling Study
(A) Duplicates and Yield for UHRR with increasing number of PCR cycles. Yield increases dramatically but % duplicates does not increase.
(B) Duplicates and Yield for Brain with increaseing number of PCR Cycles. Yield increases but % duplicates does not.
(C) Differential Expression of UHRR to Brain for 0 vs 35 cycles of PCR.
(D-F) FPKM Correlation of low amounts of PCR (0 vs. 5 cycles), high amounts of PCR (20 vs. 25 cycles), and low vs. high (0 vs. 35 cycles).
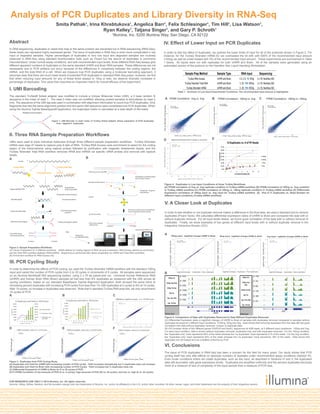
IV. Effect of Lower Input on PCR Duplicates
In order to test the effect of duplicates, we pushed the lower limits of input for all of the protocols shown in Figure 2. For
instance, for the TruSeq Stranded mRNA kit, we overloaded the kit with with 500% of the recommended input amount
(100ng) as well as under-loaded with 3% of the recommended input amount. These experiments are summarized in Table
1 below. All inputs were run with replicates for both UHRR and Brain. All of the samples were generated using an
automated version of the protocol on the Hamilton Star Liquid Handling Workstation.
Sample Prep Method Sample Type RNA Input Sequencing
TruSeq RNA Access UHRR and Brain 0.3, 2.5, 10, 50ng 2 x 76, NextSeq 500
TruSeq Stranded Total RNA UHRR and Brain 3, 25, 100, 500ng 2 x 76, NextSeq 500
TruSeq Stranded mRNA UHRR and Brain 3, 25, 100, 500ng 2 x 76, NextSeq 500
Table 1: Summary of Low Input Experimental Conditions. The recommended input amount is highlighted.
A B C
FPKM Correlation: 3ng vs. 3ng FPKM Correlation: 100ng vs. 3ng FPKM Correlation: 100ng vs. 100ng
D E
Figure 4: Duplicates in Low Input Conditions of three TruSeq Workflows
(A) FPKM correlation of 3ng vs. 3ng replicate condition in TruSeq mRNA workflow (B) FPKM correlation of 100ng vs. 3ng condition
in TruSeq mRNA workflow (C) FPKM correlation of 100ng vs. 100ng replicate condition in TruSeq mRNA workflow (D) Differential
Expression correlation of 100ng input vs. 3ng input for TruSeq mRNA workflow (E) Plot of % Duplicates vs. Read Number for
different input conditions (TruSeq mRNA workflow)
V. A Closer Look at Duplicates
In order to test whether or not duplicate removal makes a difference in the final data, we used a standard tool to remove
duplicates (Picard Tools). We calculated differential expression ratios of UHRR to Brain and compared the data with or
without duplicate removal. For all input levels tested, we found good correlation of the data with or without removal of
duplicates. Finally, we show examples of two genes at different input levels with or without duplicate removal in the
Integrative Genomics Brower (IGV).
A
B
Figure 5: Comparison of Data with Duplicates Removed to Data Without Duplicates Removed
(A) Differential Expression plots or log2(fold change) of UHRR to Brain of samples with duplicates removed compared to samples without
duplicates removed at 3 different input conditions: 5100ng, 25ng and 3ng. Data shows that removing duplicates from the data still has good
correlation with data without duplicates removed. Unique vs duplicate data.
(B) IGV browser shots of two different genes (GAPDH and ApoE), sequenced at 40M reads, at 2 different input conditions: 100ng and 3ng.
For each input condition, data is shown without duplicates removed, duplicates only, and with duplicates removed. For the 100ng condition,
the “duplicates only” track represents 49% of the reads whereas the “no duplicates” track represents 51% of the reads. For the 3ng condition,
the “duplicates only” track represents 82% of the reads whereas the “no duplicates” track represents 18% of the reads. Data shows that
duplicates are not biased and are amplified uniformly by PCR.
VI. Conclusions
The issue of PCR duplicates in RNA-Seq has been a concern for the field for many years. Our study shows that PCR
cycling itself has very little effects on absolute numbers of dupliates under recommended assay conditions (Section III).
Even under conditions where we create duplicates, such as low input, as described in Sections IV and V, the duplicated
data still accurately calls gene expression levels. Duplicates are amplified uniformly and the percent duplicates becomes
more of a measure of lack of complexity of the input sample than a measure of PCR bias.
FOR RESEARCH USE ONLY © 2014 Illumina, Inc. All rights reserved.
Illumina, HiSeq, MiSeq, Nextera, and the pumpkin orange color are trademarks of Illumina, Inc. and/or its affiliate(s) in the U.S. and/or other countries. All other names, logos, and other trademarks are the property of their respective owners.