1. Real-Time PCR Array for Simultaneous Evaluation of Multiple Cytokine mRNA Expression
Emi Arikawa, Min You, Jie Wang, Jing-yi Lo, Sean Yu, and Jingping Yang
SuperArray Bioscience Corporation, Frederick, MD 21704
Abstract
Performance of RT²Profiler™ PCR Array
RT² Profiler™
Ct Values
10-25
25-30
30-35
≥35
Not Detectable
Total
Ave SD Frequency (%)
0.11
45
0.19
41
0.40
11
0.96
3
0
0
0.20
100
Coefficient of Variance (%)
A
75
50
25
0
0-2%
2-4%
C
35
CHRNA5
30
Ct
20
1010
108
106
104
102
10
15
10
1
5
copy number
4
5
6
7
8
9
10
11
12
A
G1
G2
G3
G4
G5
G6
G7
G8
G9
G10
G11
G12
B
G13
G14
G15
G16
G17
G18
G19
G20
G21
G22
G23
G24
C
G25
G26
G27
G28
G29
G30
G31
G32
G33
G34
G35
G36
D
G37
G38
G39
G40
G41
G42
G43
G44
G45
G46
G47
G48
E
G49
G50
G51
G52
G53
G54
G55
G56
G57
G58
G59
Special Features of the RT²Profiler™ PCR Array:
RT² Profiler™
G60
F
G61
G62
G63
G64
G65
G66
G67
G68
G69
G70
G71
G72
G
G73
G74
G75
G76
G77
G78
G79
G80
G81
G82
G83
G84
H
HK1
HK2
HK3
HK4
HK5
GDC
RTC
RTC
RTC
PPC
PPC
PPC
1.E+02
1.E+04
1.E+06
1.E+08
Data Analysis Controls (wells H1-H12):
Five House Keeping Genes (HKG) primers for raw Ct
value data normalization (HK1-HK5)
Genomic DNA Contamination (GDC) control primers to
detect repetitive non-RNA encoding genomic DNA
Reverse Transcription Control (RTC) primers to detect
an External RNA Control sequence from SuperArray’s
RT2 PCR Array First Strand Kit (C-02)
Positive PCR Control (PPC) wells with a pre-dispensed
external DNA template and primers to detect it to produce
a defined Ct value under proper PCR conditions
RT2 Primer Design Criteria
Amplicon length
50-210 bp
Primer length
19-23 nucleotides
GC Content
35 – 65 %
Tm
60 – 68 ºC
Specificity
BLAST versus the entire mRNA Refseq database for the
relevant species and the E.Coli DNA database
Sequence
More than ten thermodynamic criteria set to improve
priming efficiency and minimize primer-dimer formation
e.g., 3' end stability and no self-complementary structure
Our stringent primer design criteria and specially formulated PCR master
mixes guarantee specificity and help ensure highly efficient amplification for
target genes of interest. In addition, all primer sets on the PCR Array are
experimentally validated to insure gene-specific amplification.
Data Analysis Method
Fold-changes in gene expression are calculated using the ΔΔCt method.
For each gene of interest (GOI):
ΔCt (Control Replicate 1) = Ct (GOI) – average Ct (HKG)
ΔCt (Control Replicate 2) = Ct (GOI) – average Ct (HKG)
ΔCt (Control Replicate 3) = Ct (GOI) – average Ct (HKG)…
ΔCt (Expt Replicate 1) = Ct (GOI) – average Ct (HKG)
Download the PCR Array Data Analysis
ΔCt (Expt Replicate 2) = Ct (GOI) – average Ct (HKG)
Template at:
ΔCt (Expt Replicate 3) = Ct (GOI) – average Ct (HKG)…
http://superarray.com/pcrarraydataanalysis.php
ΔΔCt (GOI) = average ΔCt (Expt) – average ΔCt (Control)
The GOI fold-change from control to experimental group = 2 ^ (-ΔΔCt).
The significance of the fold-change in gene expression between the two groups is evaluated by the Student t-test.
References
1. MAQC Consortium; Shi, L, et al. The MicroArray Quality Control (MAQC) project shows inter- and intra-platform reproducibility of
gene expression measurements. Nature Biotechnology. 2006 Sep; 24(9): 1151-1161.
2. Canales RD, et al. Evaluation of DNA microarray results with quantitative gene expression platforms. Nature Biotechnology. 2006
Sep; 24(9): 1115-1122.
CSF2
FAM3B
FASLG
GDF5
GDF8
GDF9
IFNA1
IFNA2
IFNA4
IFNA5
IL10
IL11
IL12A
IL12B
IL13
TXLNA
IL15
IL16
IL25
IL18
IL19
IL1A
IL1B
IL1F10
IL1F5
IL1F6
IL1F7
IL1F9
IL2
IL20
IL21
IL22
IL24
IL3
IL4
IL5
IL6
IL8
IL9
TGFA
1
INHA
0
10
20
30
40
TGFB3
Average Ct
120%
100%
80%
60%
20%
0%
A
Genes
HPRT1 RPL13A GAPDH
BMP8B
CSF1
NODAL PDGFA
IL7
LTA
LTB
TGFB1
TGFB2
TNFSF
11
TNFSF
12
TNFSF
13
TNFSF
13B
TNFSF
14
TNFSF
4
CD70
ACTB
HGDC
RTC
RTC
RTC
PPC
PPC
Gene Table of
Human Common Cytokine
PCR Array (APHS-021)
TNFSF
8
PPC
Figure 6: Identifying Differentially Expressed Genes Between Resting and Stimulated PBMC
Resting
Using the Common Cytokine RT2 Profiler™ PCR Array
Profiler™
B
D
40%
1.E+10
TNF
B2M
INHBA LEFTY2
TNFRSF TNFSF
11B
10
BMP7
The flow chart on the left panel illustrates the design of the present study. Peripheral blood mononuclear cells (PBMC) were
treated with or without 50ng/mL PMA+ 1µg/mL ionomycin for 6 or 24 hours. After each incubation period, total RNA was
isolated from each preparation, and first strand cDNAs were prepared from 500ng total RNA of each sample using RT2 PCR
Array First Strand kit (C-02). Template cDNAs were then characterized in technical triplicates using the Human Common
Cytokine PCR Array (APHS-21C) with the RT² SYBR Green / ROX PCR master mix (PA-012) on the ABI 7500 FAST®
Real-Time PCR System. The above table shows the layout of the PCR Array. Fold changes in gene expression between the
stimulated and resting PBMC RNA were calculated using the ΔΔCt method. The significance of the change in gene
expression between the two samples was evaluated by unpaired Student t-test for each gene. The level of statistical
significance is set at p<0.005. To validate the results obtained from the PCR Array, the protein level of eight selected
cytokines secreted by the PBMC (IL-2, 4, 5, 10, 12, 13, and IFN-γ and TNF-α) was measured using a multiplex cytokine
ELISA Array (Human Th1/Th2 Cytokines Multi-Analyte Profiler ELISArray™ (MEH-001A)).
140%
Gene Copy
Quality-controlled primer sets for a thoroughly researched
panel of 84 pathway-focused genes (wells G1-G84)
Each assay has been experimentally validated to insure
gene-specific amplification.
DNA sequencing demonstrated 100% of the PCR products
amplified from the correct target genes.
BMP6
GDF3
IFNK
IL17C
IL1F8
Standard curves were constructed for selected assays on the PCR Array using a ten-fold serial dilution of purified DNA as templates. The amplification plot
and the standard curve for one example are displayed in Panels A and B, respectively. The RT2 PCR system can detect from one to 1010 copies of template
with a linear dynamic range of 10 to 109 copies. Panel C shows the amplification efficiencies and their corresponding 95% confidence intervals (CI) for 200
selected assays performed on the PCR Arrays. In this case, a five-fold serial dilution of DNA template was characterized on individual PCR Arrays. The
average amplification efficiency is 99 % with a 95% CI of 90 to 110 %.
Figure 3: The RT2Profiler™ PCR Array Demonstrates a High Degree of Specificity
Profiler™
B
A
BMP1 BMP2 BMP3 BMP4 BMP5 BMP6 BMP7
BMP1
BMP2
BMP3
BMP4
BMP6
BMP5
BMP7
BMP15
BMP15
C
B
100000.00
Stim ulated
10000.00
A sample of Human Universal Total RNA was characterized on the Human TGFβ / BMP Signaling Pathway PCR Array (APH-035A) using the RT2 RealTime™ SYBR Green / Fluorescein PCR Master Mix (PA-011) on the Bio-Rad iCycler®. After a standard PCR cycling and melting curve program,
dissociation curves were obtained (Panel A), and the products were characterized by agarose gel electrophoresis (Panel B). Each reaction yields a single genespecific product of the predicted size.
Fold Difference (Stimulated/Resting)
3
BMP5
GDF2
IFNG
IL17B
2
Figure 4: Cross Platform Comparisons between Different Technologies
Technologies
— PCR Arrays Yield Similar Results as TaqMan®
16
1000.00
100.00
10.00
1.00
0.10
0.01
12
y = 0.9941x - 0.5701
12 11
10
8
4
-16
-12
-8
-4
4
8
12
16
-4
TaqMan
0.97
TaqMan
-8
-12
Correlation (R)
PCR Array
86 genes
-16
RT 2 PCR Log2 FC
QuantiGene
QuantiGene
0.93
StaRT-PCR
0.91
0.90*
0.94*
0.92*
RT2
Correlation of fold-change between
PCR Arrays and other platforms: PCR Array results were compared with three quantitative assays (the
foldTaqMan® Gene Expression Assays from Applied Biosystems, Standardized (Sta)RT-PCRTM from Gene Express, and QuantiGene® from Panomics). A custom
PCR Array was produced containing primer sets for ninety (90) genes that overlapped the most with each of the MAQC gene lists. For comparison, data from
the other gene expression analysis technologies were obtained from published results1, 2. The concordance of the log2 fold differences between the two RNA
samples from the PCR Array and each of the other platforms was individually evaluated by regression analysis. The scatter plot for the comparison with
TaqMan is presented above. The purple dashed line on the graph represents a straight line with an ideal slope of 1.0. The solid blue line shows the linear
regression data fit. The Pearson correlation coefficients (R) between the PCR Array and all three quantitative assays are listed in the above tables. Correlation
(R) values labeled with an asterisk (*) were derived from the published data1,2.
Conclusions
The RT²Profiler™ PCR Array provides highly reliable qRT-PCR gene expression analyses with exceedingly high reproducibility,
specificity, amplification efficiency, sensitivity, and a wide linear dynamic range. The PCR Array System performs as well as
TaqMan® PCR and is highly comparable with other quantitative gene expression analysis platforms. It is specifically designed to
accelerate the task of simultaneous expression profiling of multiple gene targets belonging to a specific pathway or biological
function for any laboratories with a real-time PCR instrument.
Reproducibility: Replicate Ct value measurements within 0.20 cycle average standard deviation with an average CV of 0.73%.
Wide linear dynamic range and high amplification efficiency: A linear dynamic range from 10-109 template copies with an
average amplification efficiency of 99% (with a 95% CI of 90% - 110%).
Specificity: Amplification of target gene only. Ability to distinguish different genes from the same family with one-base pair
difference.
Comparability with TaqMan® PCR: High degree of correlation (R=0.97) in the fold-change results with TaqMan®.
Convenience and cost-effectiveness: Simultaneous measurement of 84 pathway-related genes and five housekeeping genes
with SYBR® Green based real-time PCR technology using thoroughly tested primer sets, eliminating the time required for
optimization of the PCR conditions and the need for those expensive probes with a reporter dye.
Using the Human Common Cytokine PCR Array, we identified 29 genes that exhibited at least a 5-fold change in gene
expression between resting and PMA/ionomycin stimulated peripheral blood mononuclear cells at 6 h after stimulation. Our
data show that changes in cytokine mRNA levels detected by PCR Arrays accurately predict changes in protein levels
measured by ELISA.
Pathway-focused PCR arrays offer a simple, reliable and sensitive tool for parallel profiling of multiple genes in the
cytokine pathway.
9
Resting
8
7
6
Column
5
4
3
2
1
A
B
C
D
E
F
G
H
Row
RNA isolated from resting PBMC or PBMC stimulated with PMA+ionomycin for 6 or 24 hours were
characterized on the Human Common Cytokine PCR Array RT2Profiler™ PCR Array (APHS-021C). The 6-h
results are presented in Panels A to D. The scatter plot (Panel A) depicts a log transformation plot of the relative
expression level of each gene (2^(-ΔCt)) between resting and stimulated PBMC. The pink lines indicate the 5fold change in gene expression threshold. The volcano plot (panel B) depicts the log2 fold changes versus the pvalues from the t-test. Panel C plots the fold changes of each gene as a z-axis displacement from the xy-plane
representing the 96-well layout of the PCR Array. Genes that showed at least a five-fold difference in expression
between the two samples are listed in the table in panel D. A total of 29 genes had at least a 5-fold change in
expression between the stimulated and resting PBMC, with 23 genes having increased expression and 6 genes
having decreased expression in stimulated PBMC. As shown in the table, at 24 h, the effects of PMA-ionomycin
on genes such as BMPs, CSFs, IFN-γ, IL-1β, IL-6, IL-11, TGF-β and TNF were continuously observed, whereas
the effects on other genes such as IL-2, 3, 5, 9, 10, 13, 17 and 22 diminished 24 h after stimulation.
Secreted cytokine mRNA expression
protein level
Fold Change Vs
(pg/ml)
Untreated Cells
2
TaqMan Log 2 FC
1
0
1.E+00
PCR Efficiency and 95% of CI
B
BMP4
GDF11
IFNB1
3
Coefficient of Variance Range
CHRNA5
BMP3
GDF10
IL17A
Figure 2: The PCR Array Demonstrates A Wide Dynamic Range and High Amplification Efficiency
High
A
BMP2
FIGF
4
0
4-6%
BMP1
IFNA8
Figure 5: Study Design
5
The two MicroArray Quality Control (MAQC) Reference RNA samples1,2 (Universal Human Reference RNA from Stratagene (Catalog# 740000, Lot#
1130623) and Human Brain Reference RNA from Ambion (Catalog# 6050, Lot# 105P055201A)) were each characterized in six replicate PCR arrays. The
table in Panel A lists the average standard deviation for different Ct value ranges as well as the percentage of genes in each group (percent frequency). Panel
B charts the frequency of genes exhibiting a coefficient of variation in Ct value determination within a given range. Panel C plots the average coefficient of
variance for each average Ct values.
25
What is the RT²Profiler™ PCR Array?
RT² Profiler™
Mulitple Cytokine Profiling in Stimulated Peripheral Blood Mononuclear Cells (PBMC)
Cells
Using a Cytokine-Focused PCR Array
Cytokine-
Figure 1: The PCR Array Yields Highly Reproducible Ct Values across Replicate Plates
B 100
C 6
Frequency (%)
Cytokine quantification is an important element in studies of inflammation and immune responses.
Quantitative RT-PCR, a rapid and sensitive assay, is the preferred method to quantify cytokine
mRNA levels because they are often expressed at low levels. The RT2Profiler™ PCR Array
combines the reliable performance of SYBR® Green based qRT-PCR with multi-gene profiling
capabilities to simultaneously analyze the expression of a panel of genes from the same pathway.
Using PCR Arrays, we have monitored the mRNA levels of 84 different cytokines in human
peripheral blood mononuclear cells (PBMC) in response to treatment with 50ng/mL PMA and
1µg/mL ionomycin for up to 24 h. The results identify 23 up-regulated and 6 down-regulated genes
(with >5 fold-change & p<0.005) in the stimulated cells when compared to the resting cells at 6 h. At
24 h, the effects of PMA-ionomycin on genes such as BMPs, CSFs, IFN-γ, IL-1β, IL-6, IL-11, TGF-β
and TNF are continuously observed, while the effects on other genes such as IL-2, 3, 5, 9, 10, 13,
17 and 22 diminish 24 h after stimulation. To validate these results, the protein level of eight
selected cytokines secreted by the PBMC was measured using a multiplex ELISA array. Our data
show that changes in cytokine mRNA levels detected by PCR Arrays accurately predict changes in
protein levels measured by ELISA. Hence, the PCR Array offers a simple, reliable and sensitive tool
for multiple cytokine profiling.
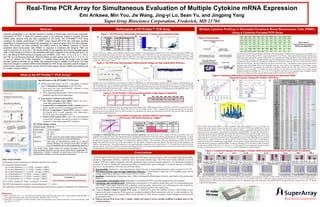
Figure 7: Comparison between the Changes in Cellular mRNA Expression and Secreted Protein Levels of Cytokines
Expression
IL-2
IL-4
IL-5
IL-10
0.00
20.00
24 hr
11190.60
6 hr
-2.08
6 hr
24 hr
208.71
12.70
24 hr
1.42
IL4
IL5
6 hr
-3.87
100000.0
0 hr
6 hr
24 hr 48 hr
IL2 0.0 12917 17390 37355
Time (Hours after Stimulation)
0 hr
6 hr
24 hr
48 hr
IL4 19.4 50.7 214.3 170.1
Time (Hours after Stimulation)
6 hr
24 hr
0 hr
48 hr
33.6 183.4 190.8
IL5 13.7
Time (Hours after Stimulation)
14000.0
400000.0
12000.0
10000.0
300000.0
IL10
6 hr
24 hr
48 hr
10.4
44.9
533.2
550.9
Time (Hours after Stimulation)
8000.0
200000.0
300.0
200.0
6000.0
4000.0
100000.0
100.0
0.0
2000.0
0.0
0.0
0 hr
6 hr
24 hr
48 hr
0
0
0
IL12 32.3
Time (Hours after Stimulation)
24 hr
40.00
34.54
TNF
Time (Hours after Stimulation)
16000.0
400.0
5.0
6 hr
24 hr
1287.18
IFNG 525.91
Time (Hours after Stimulation)
500000.0
500.0
10.0
0.0
0 hr
24 hr
600.0
15.0
100.0
0.0
6 hr
6 hr
144.6744818
IL13 3961.963846
Time (Hours after Stimulation)
700.0
20.0
200.0
50.0
0.0
0.0
-2.46
800.0
25.0
400.0
50.0
50000.0
30.00
0.00
0
24 hr
-4.25
Time (Hours after Stimulation)
300.0
150000.0
1000
6 hr
IL12B (p40)
30.0
500.0
100.0
24 hr
35.0
150.0
200000.0
35.00
1500
-5.00
1.14
1.06
IL12A (p35)
Time (Hours after Stimulation)
600.0
200.0
100.0
250000.0
250.0
150.0
300000.0
2000
500
24 hr
Time (Hours after Stimulation)
200.0
350000.0
40.00
500.00
2500
-4.00
6 hr
62.77
IL10
250.0
400000.0
45.00
1000.00
3000
-3.00
1.00
-20.00
Time (Hours after Stimulation)
Time (Hours after Stimulation)
TNF-α
1500.00
3500
-2.00
1.05
0.00
0.00
-3.00
6 hr
Time (Hours after Stimulation)
IFN-γ
4500
4000
40.00
100.00
-2.00
IL2 47820.23
IL-13
0.00
-1.00
1.10
200.00
0.00
-1.00
20000.00
IL-12
60.00
1.00
40000.00
1.15
80.00
300.00
2.00
60000.00
0 hr
6 hr
24 hr
48 hr
IL13 21.2 229.5 707.9 753.1
Time (Hours after Stimulation)
0.0
0 hr
6 hr
24 hr 48 hr
IFNG 0.5 25300 224912404176
Time (Hours after Stimulation)
0 hr
6 hr
24 hr
48 hr
TNFa 38.3 1819 8170 14475
Time (Hours after Stimulation)
The effects of PMA-ionomyocin on the secretion of the eight selected cytokines were assessed by multiplex cytokine ELISA. In parallel with the PCR Array results (upper panel), a
marked increase in cytokine release (lower panel) was seen for IL-2, 10, 13, and IFN-γ and TNF-α, while only moderate changes were detected for IL-4, 5 and 12. The induction in
cytokine secretion by PMA-ionomycin were sustained up to 48 h of stimulation, despite the observation of the subdued mRNA expression for some cytokines such as IL-2, 5, 10 and
13 after 24 h of stimulation.