Download as PDF, PPTX
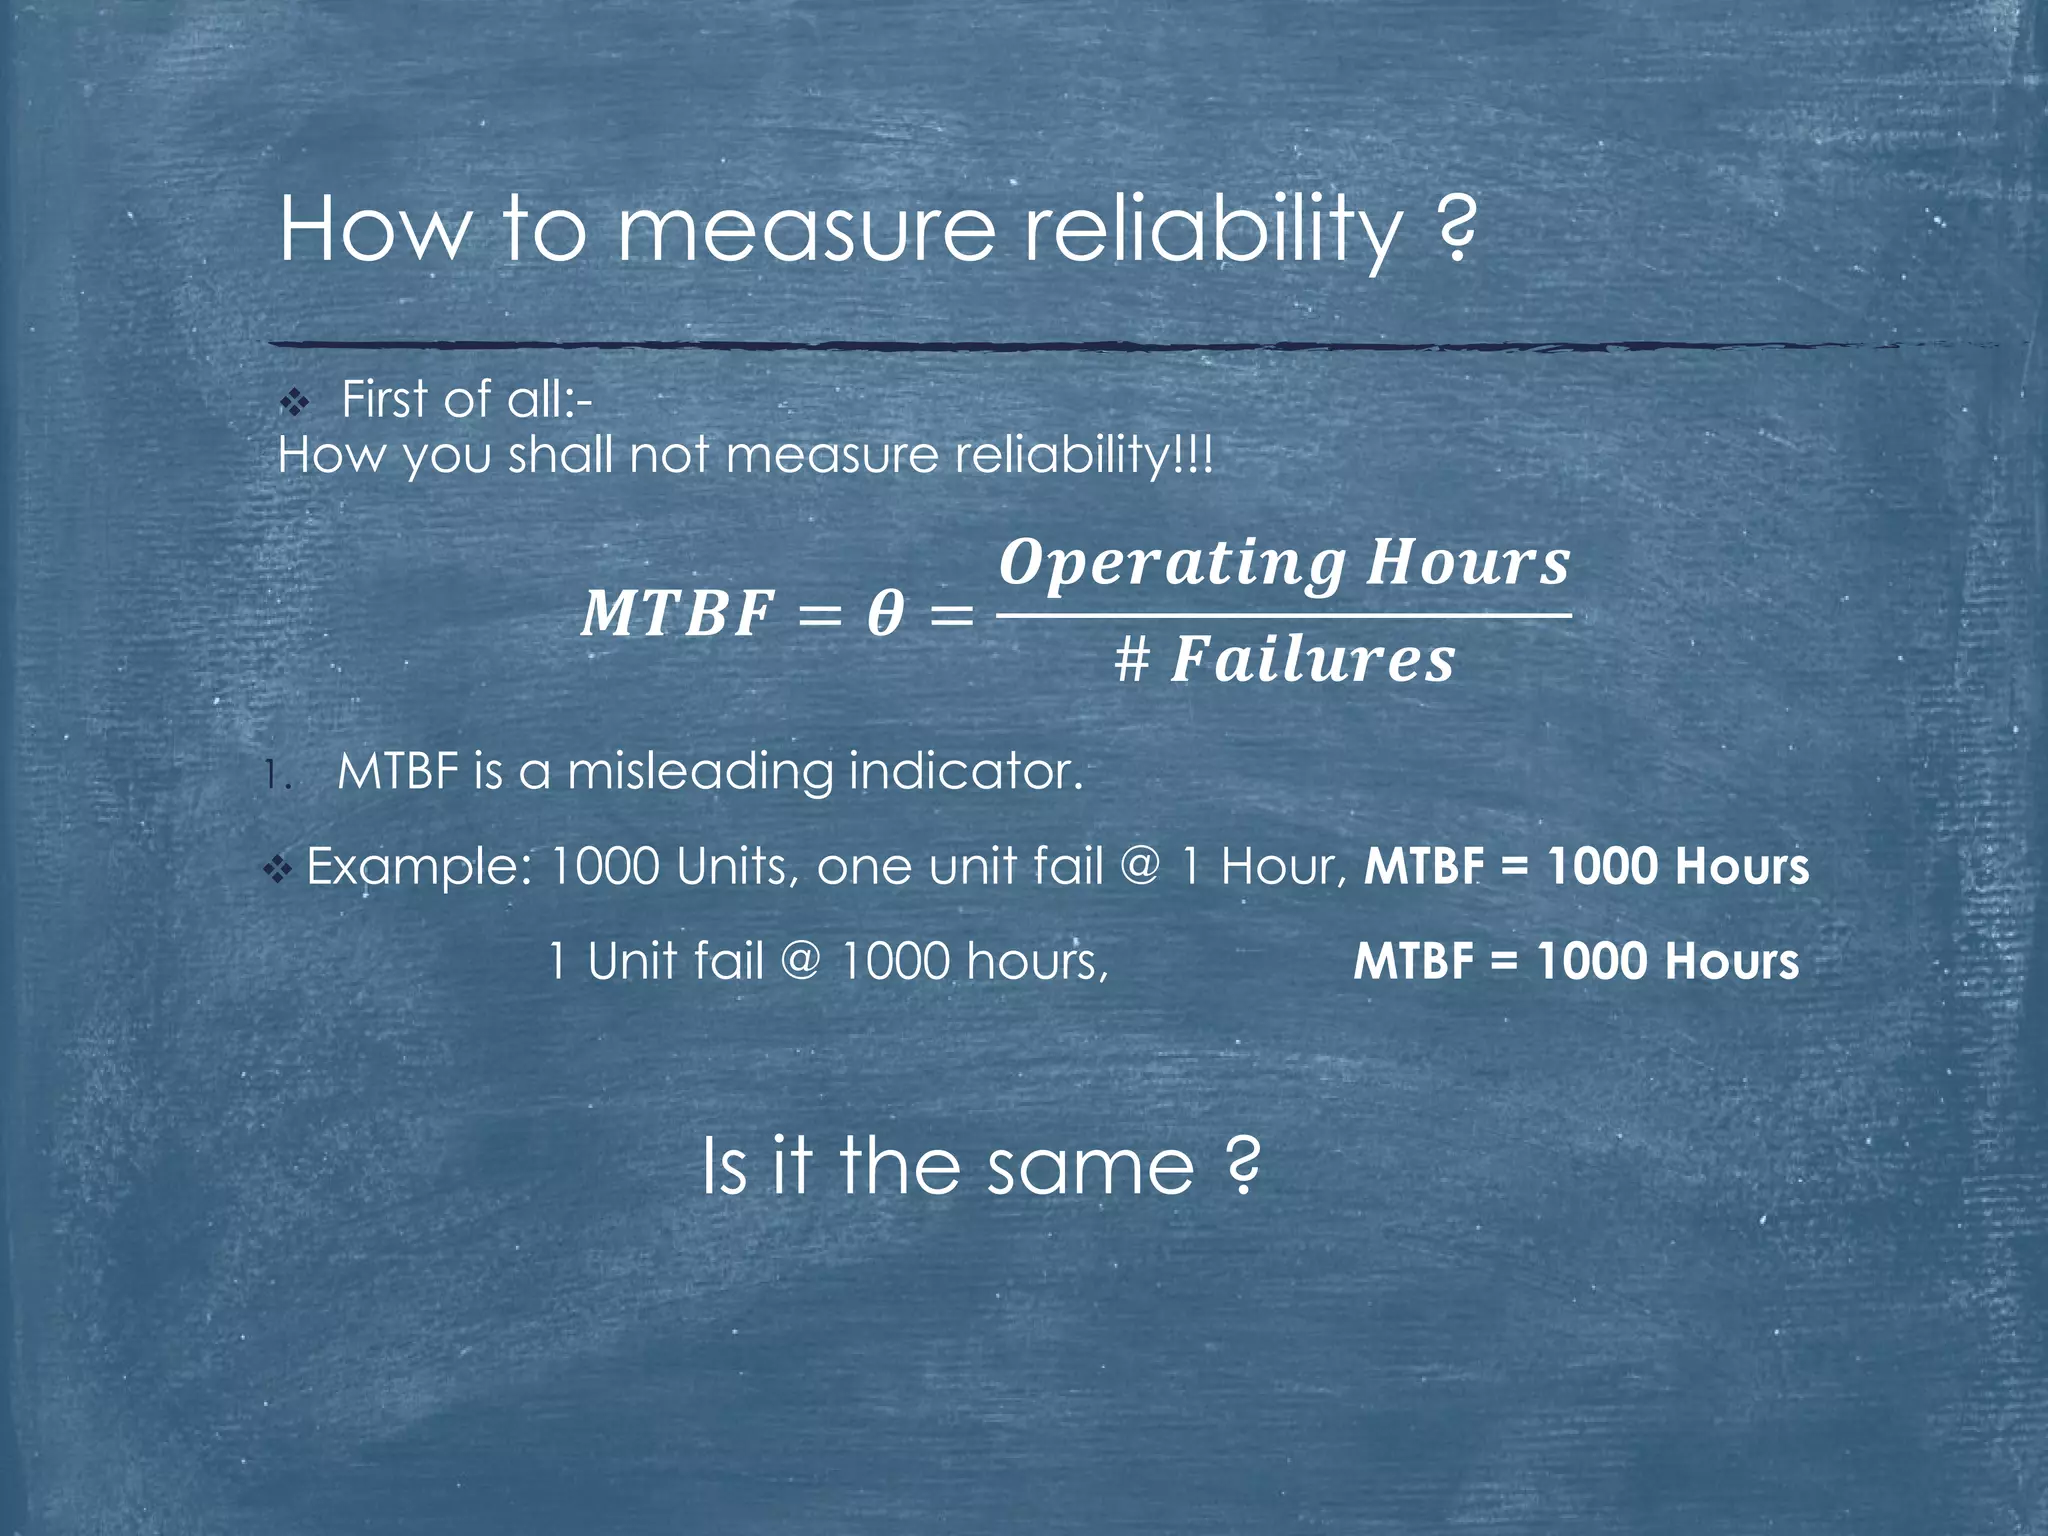
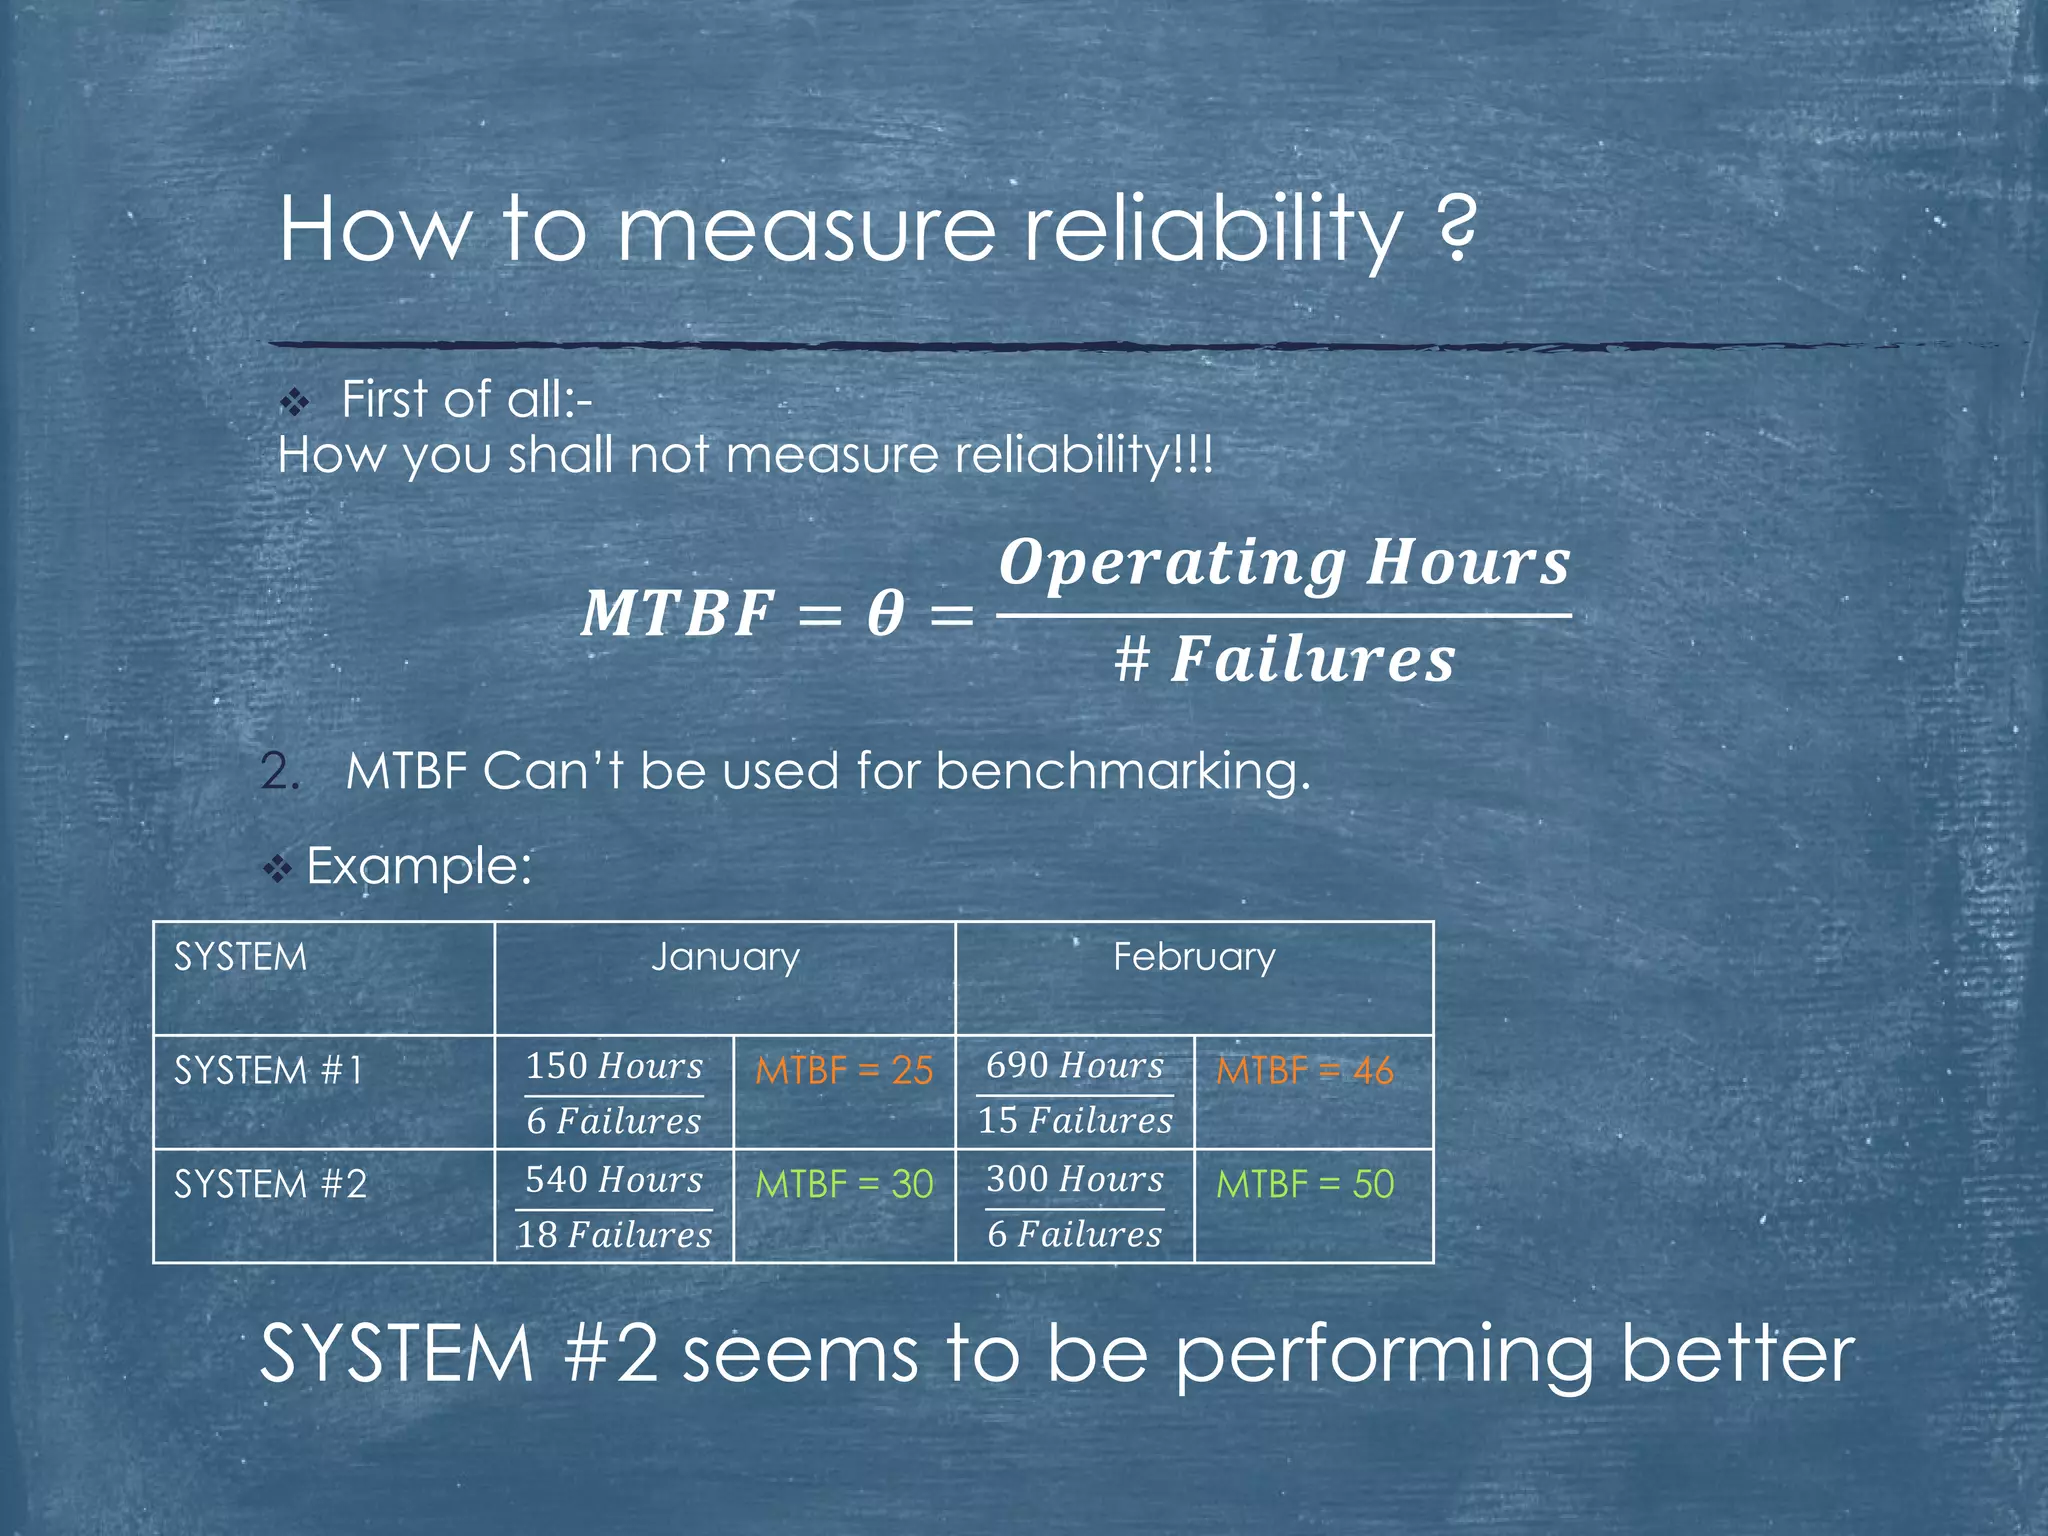
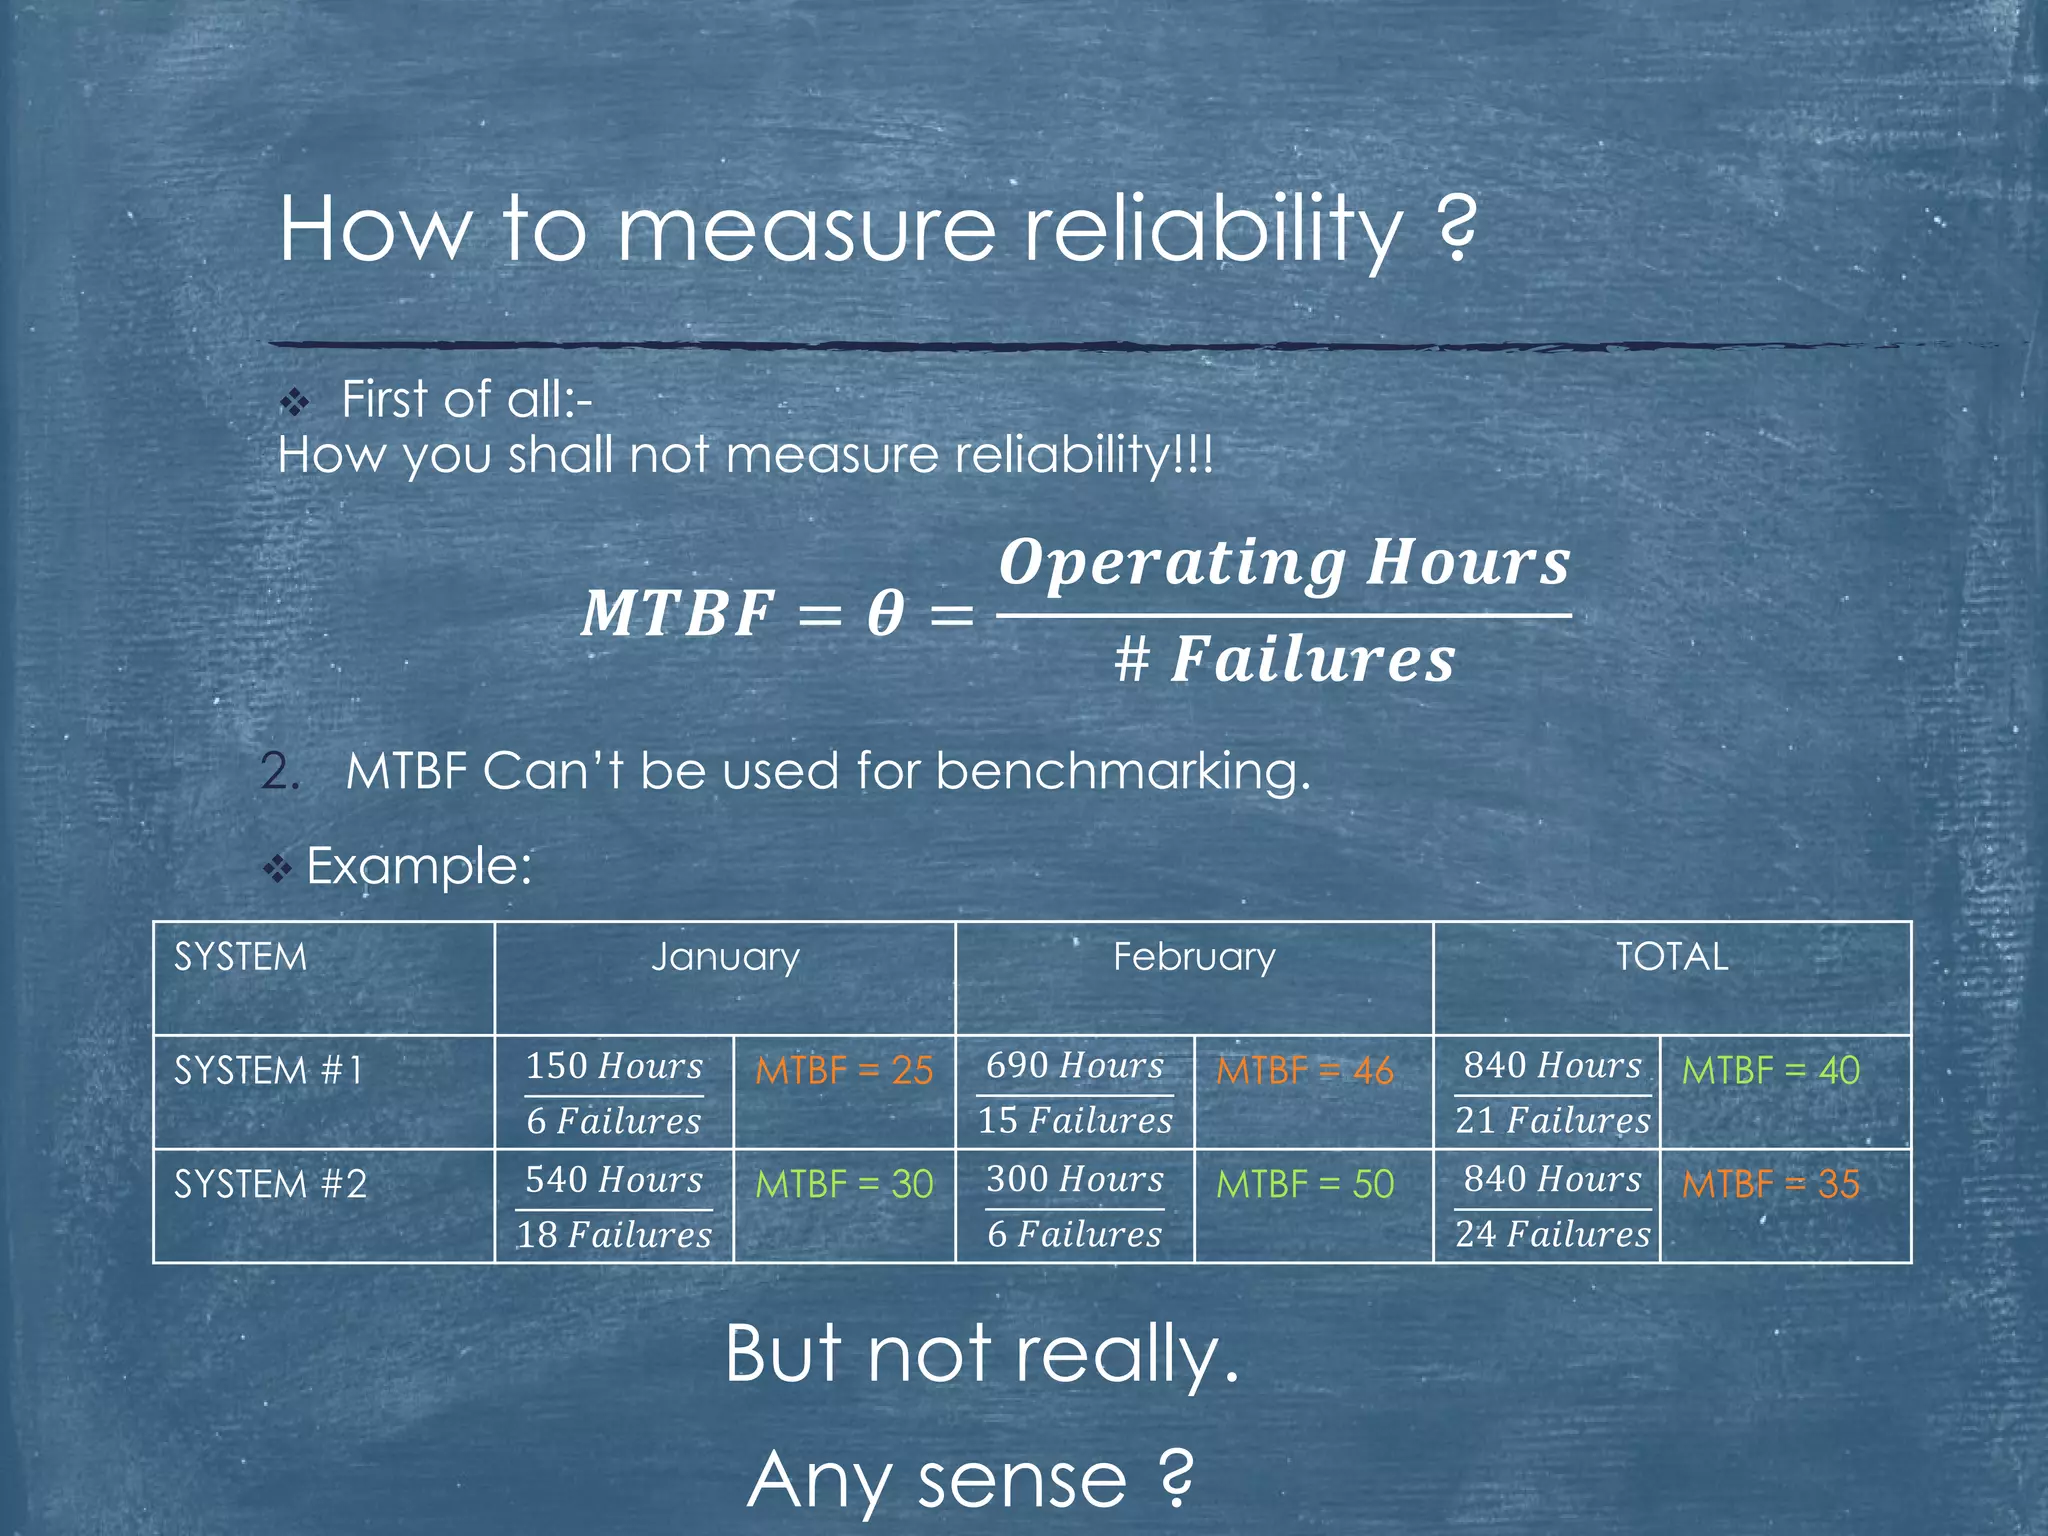
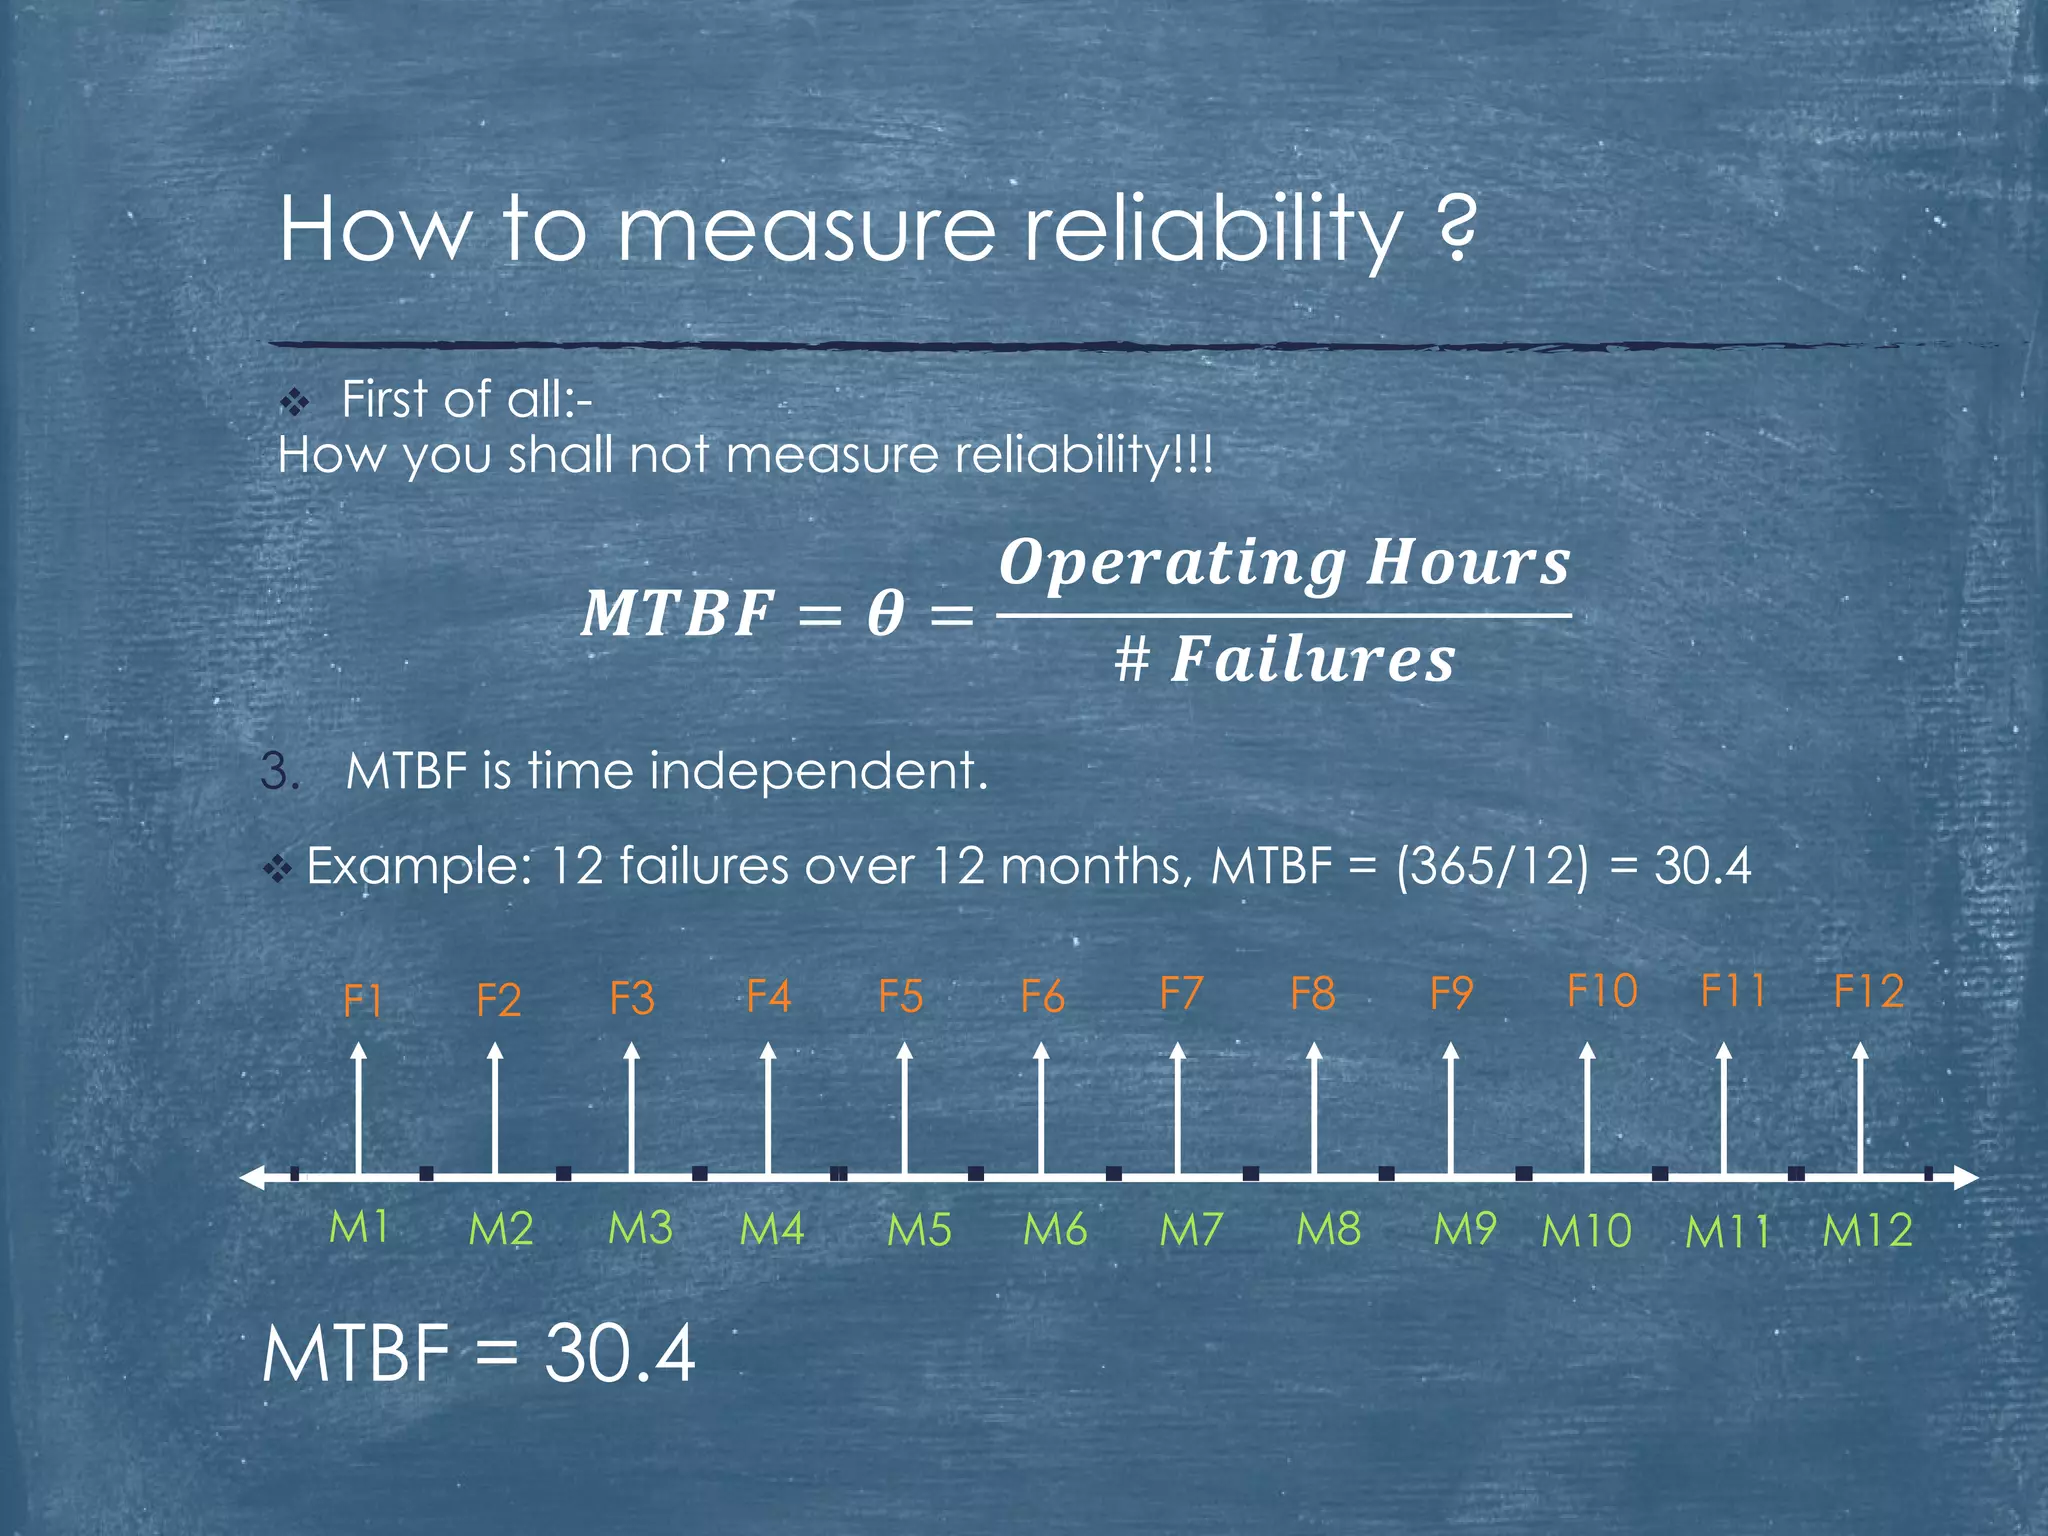
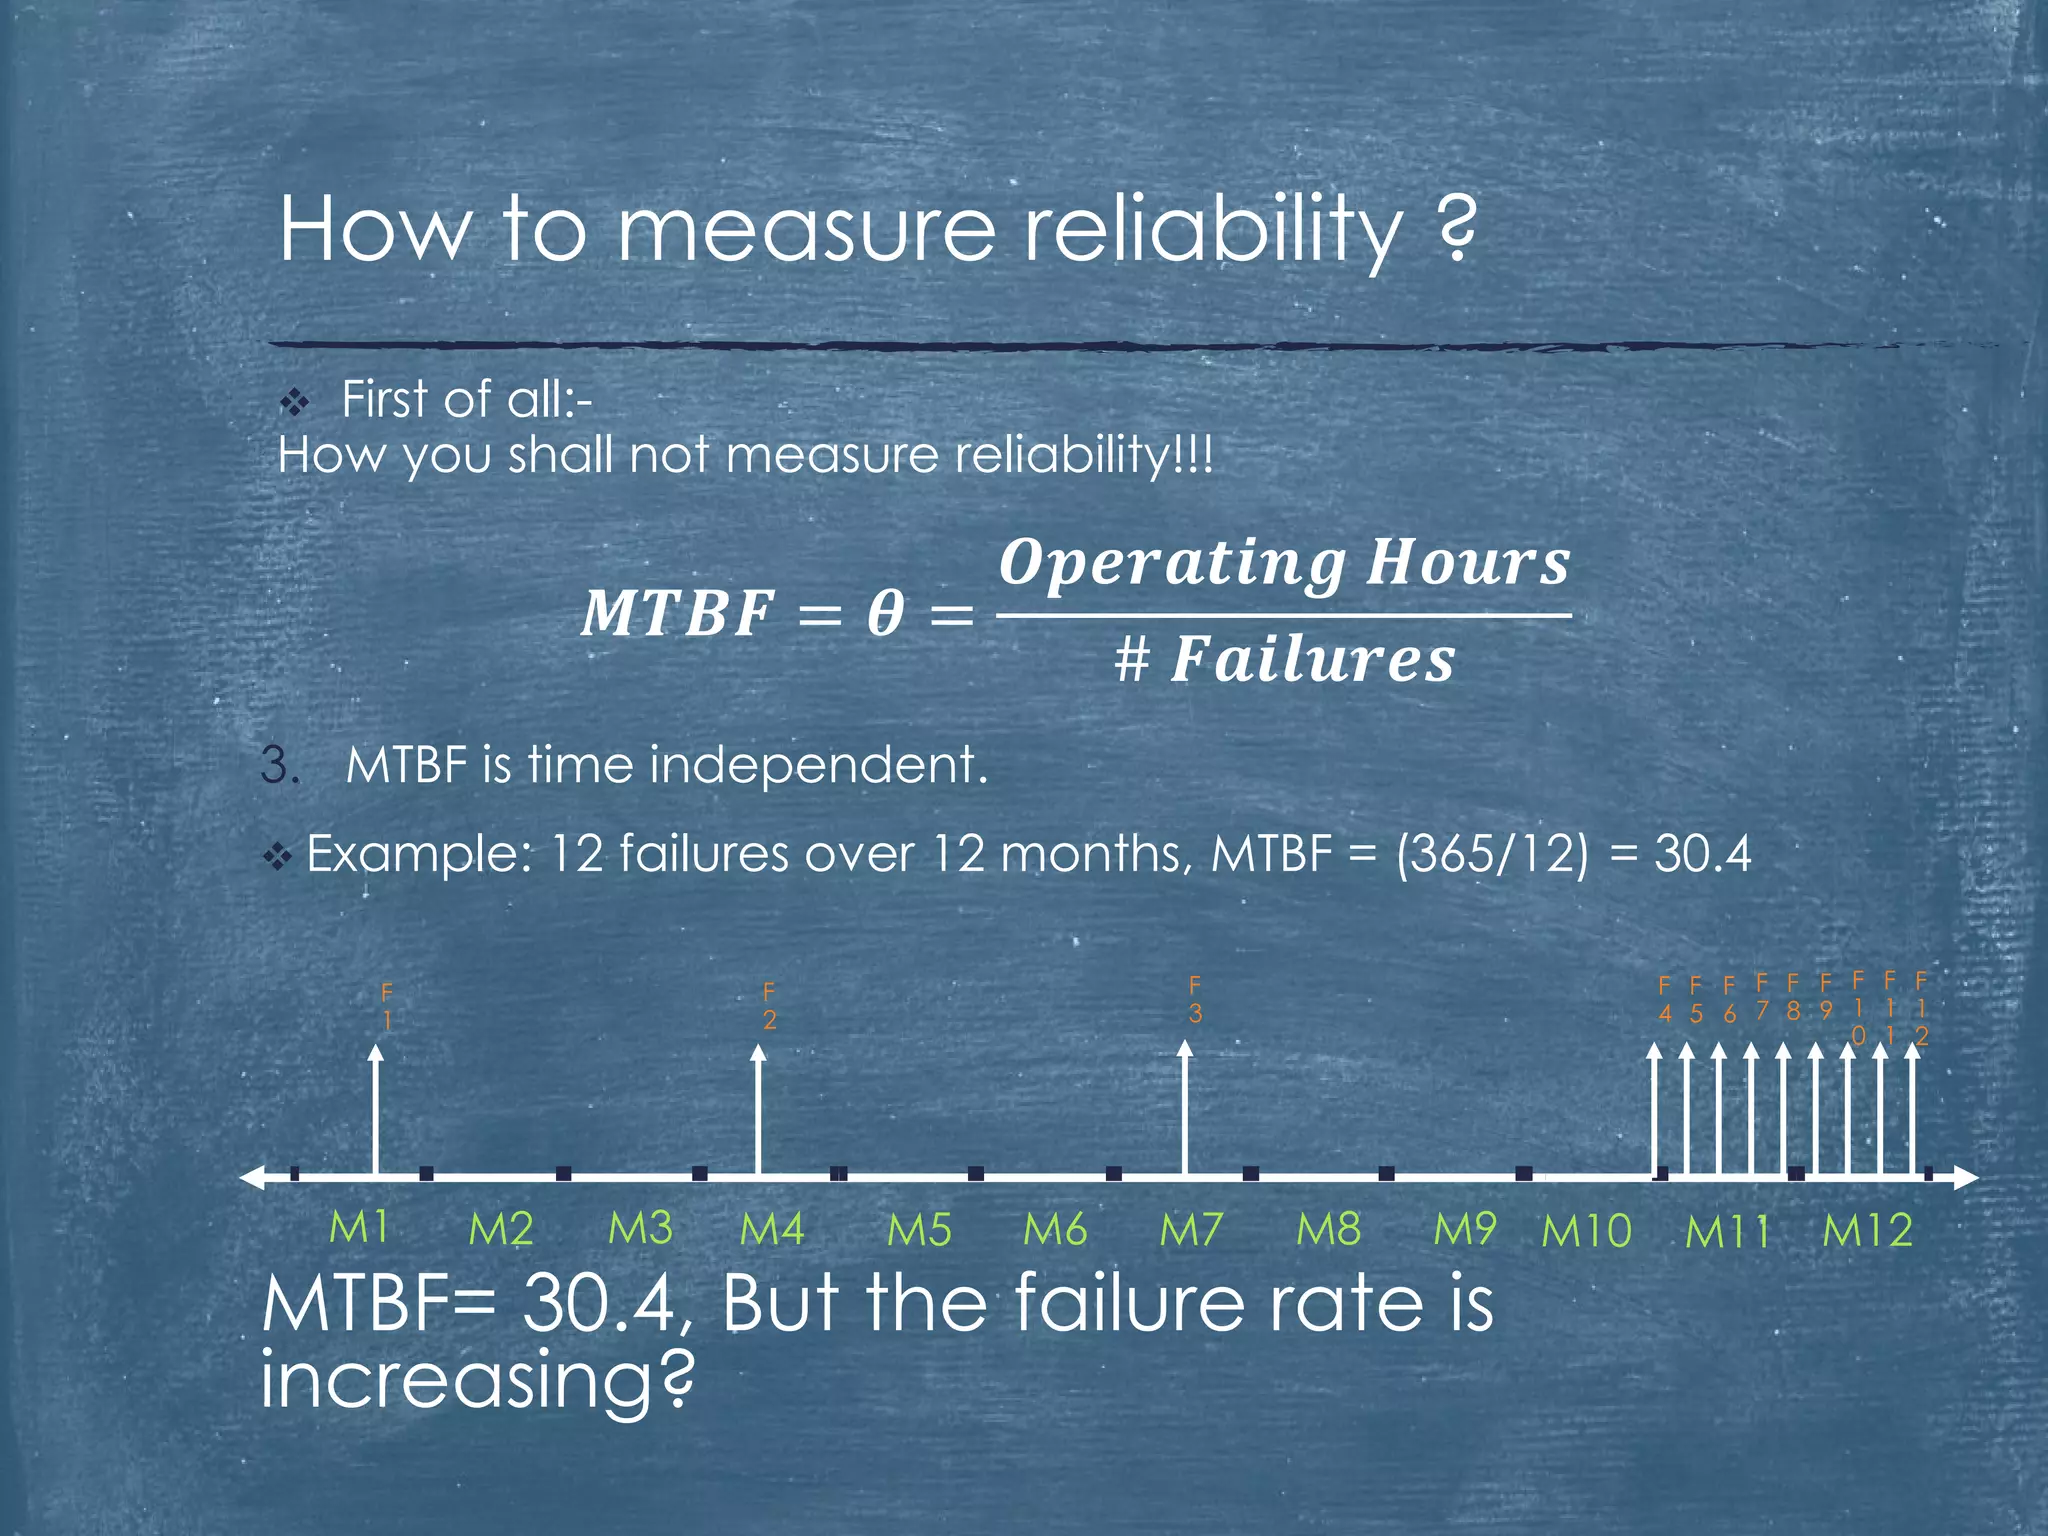
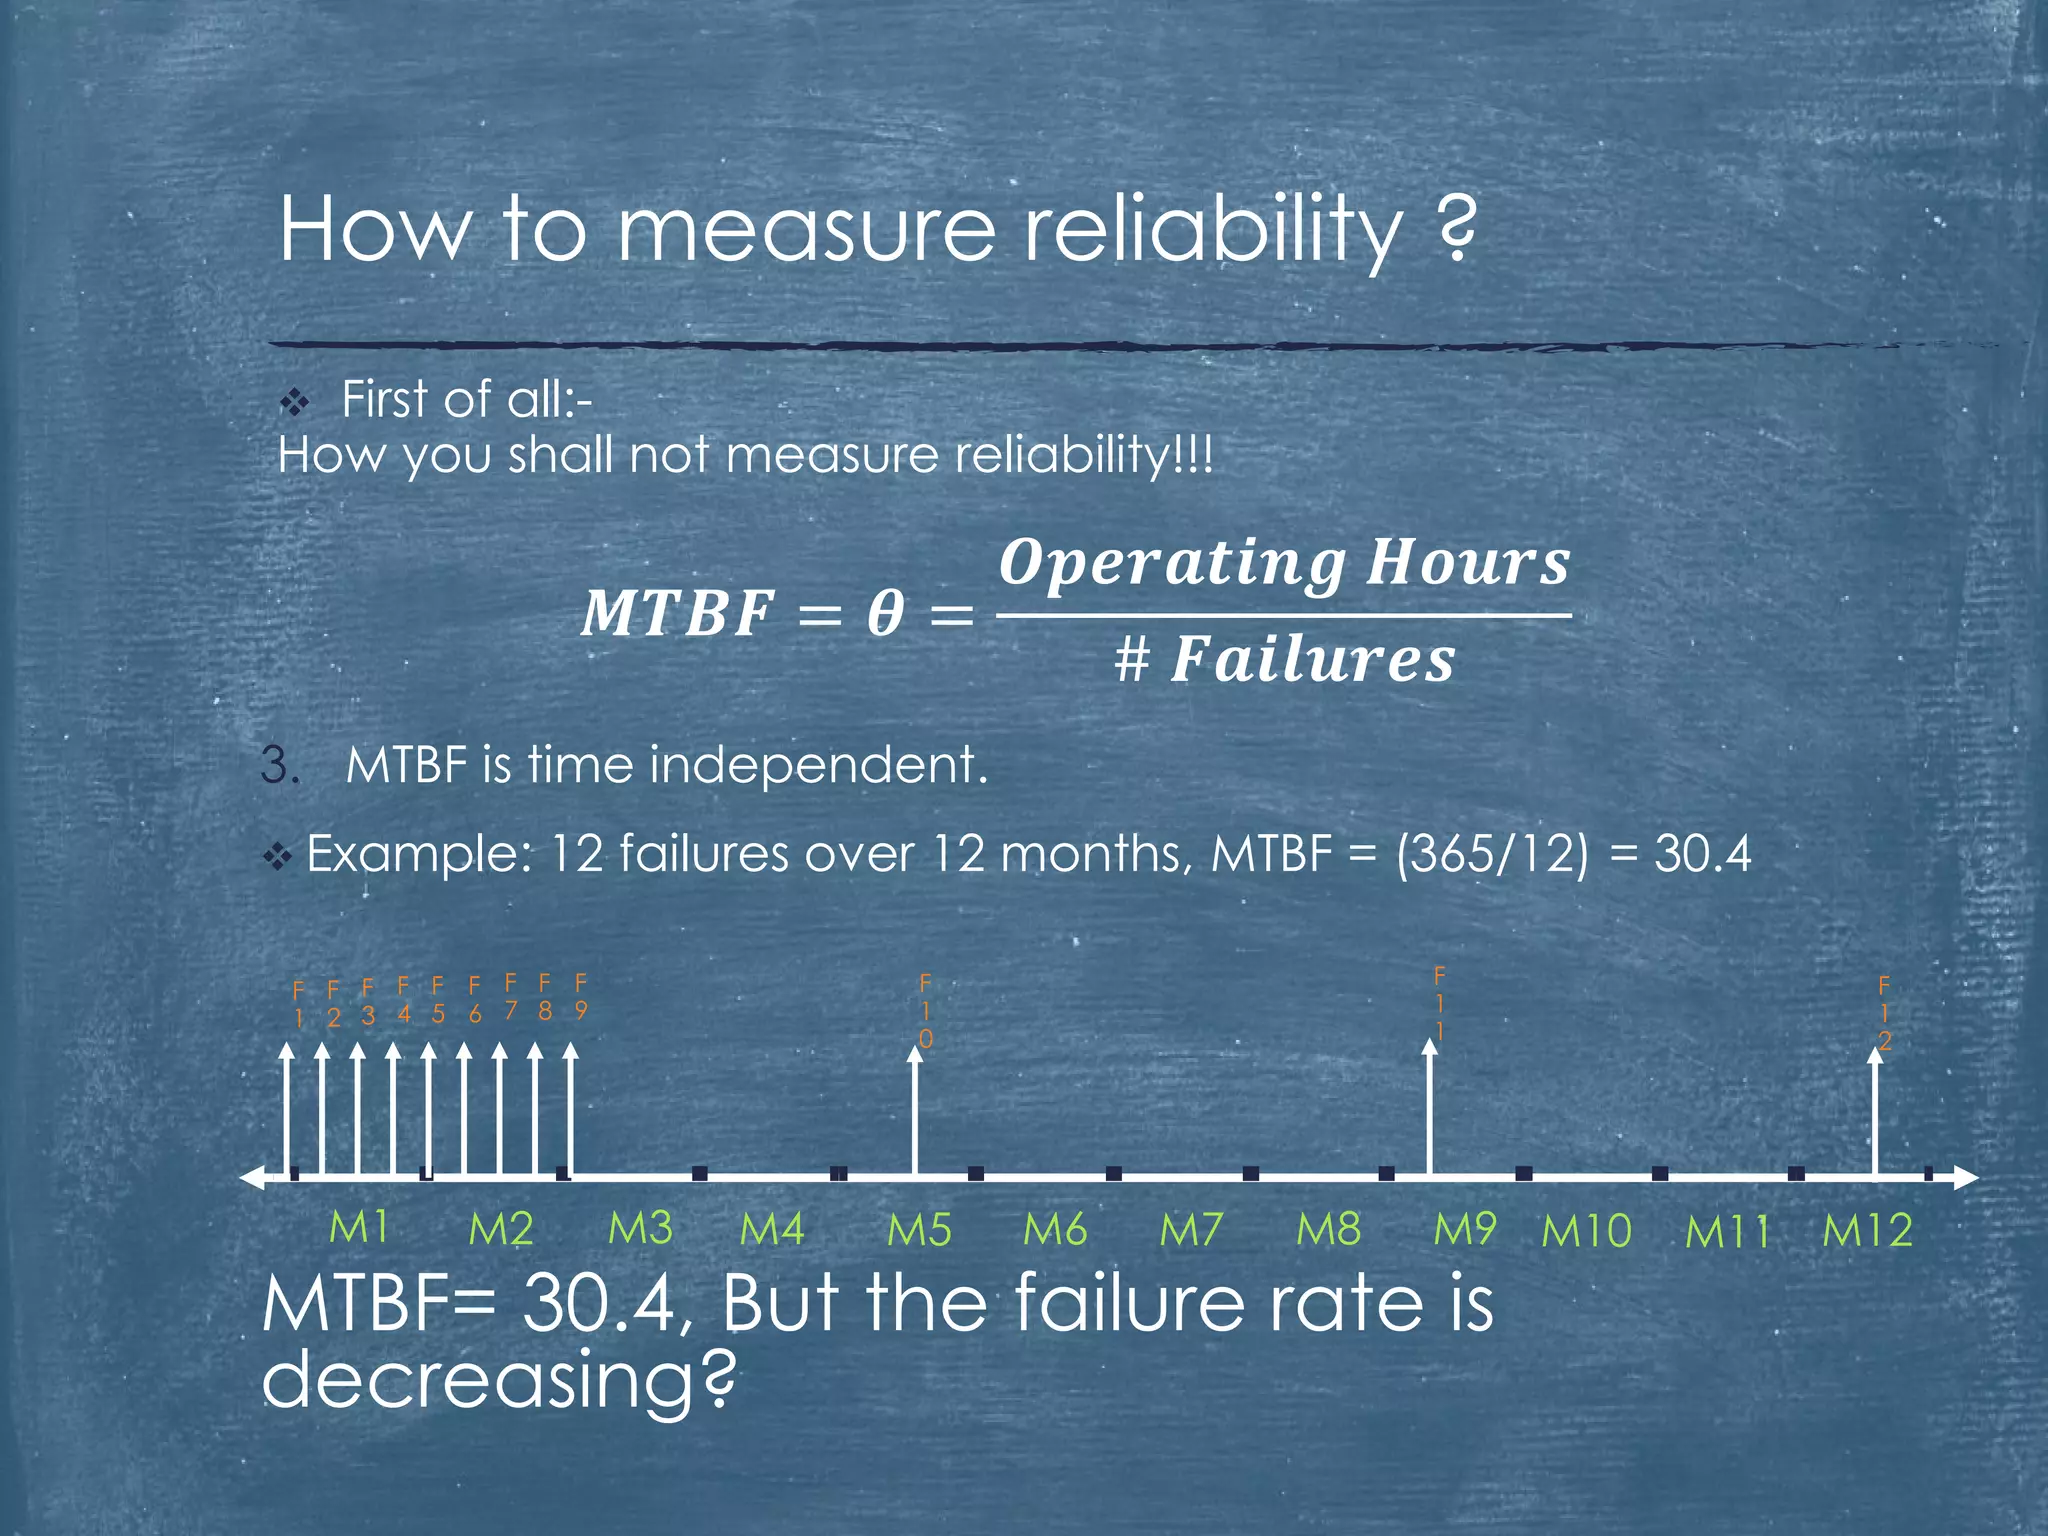
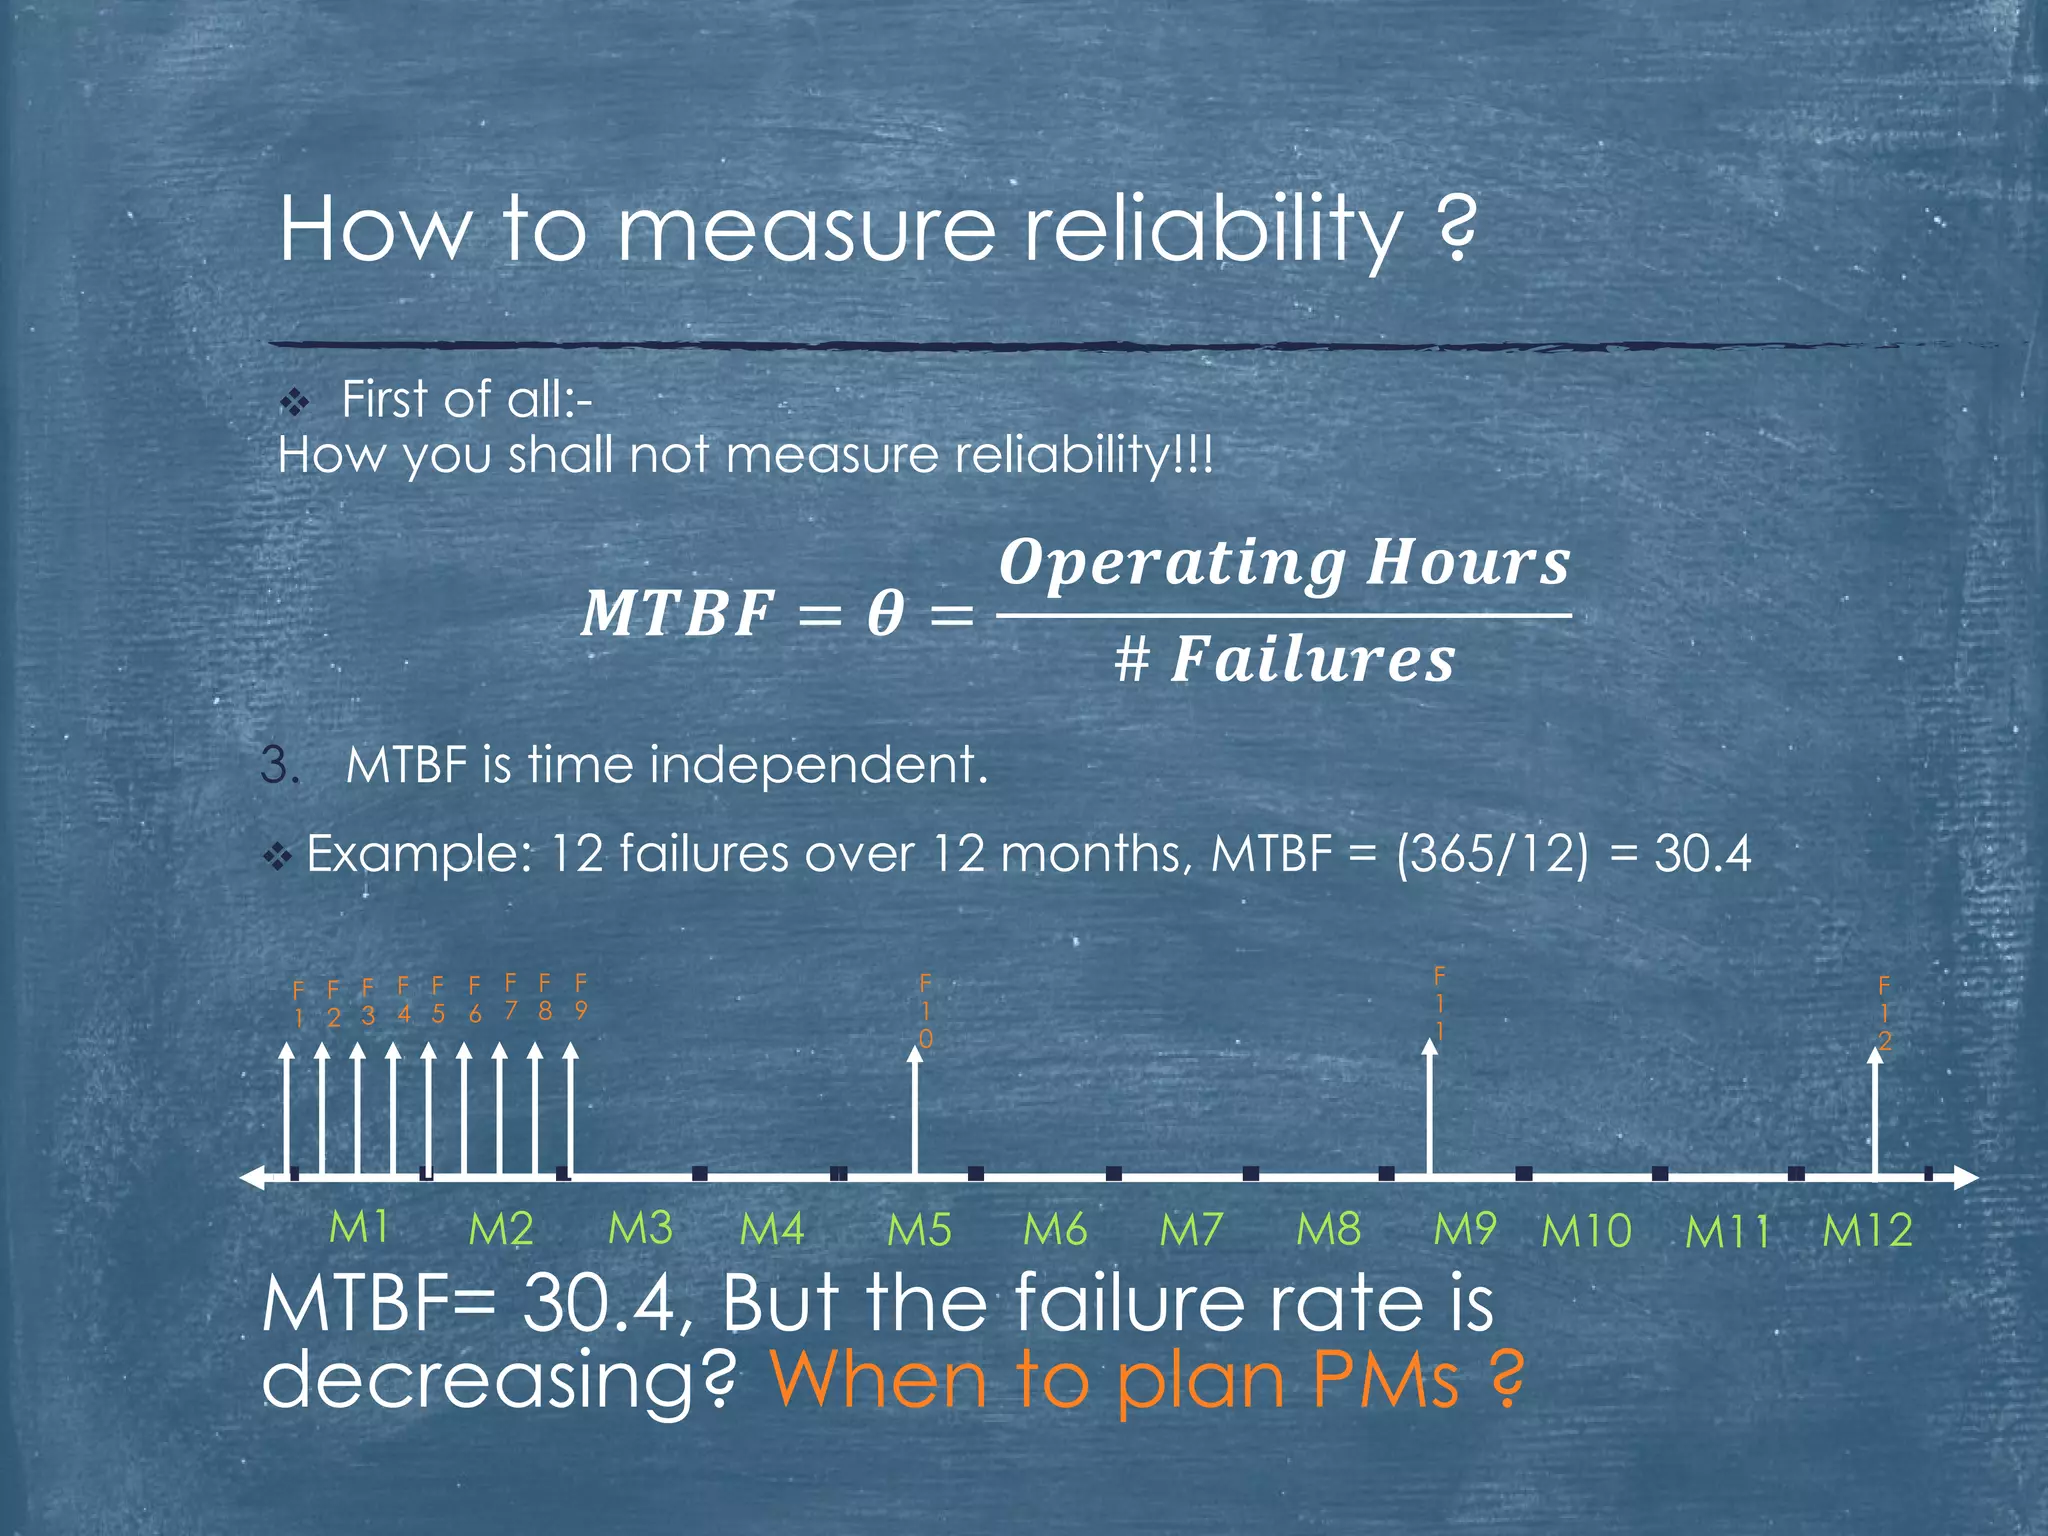
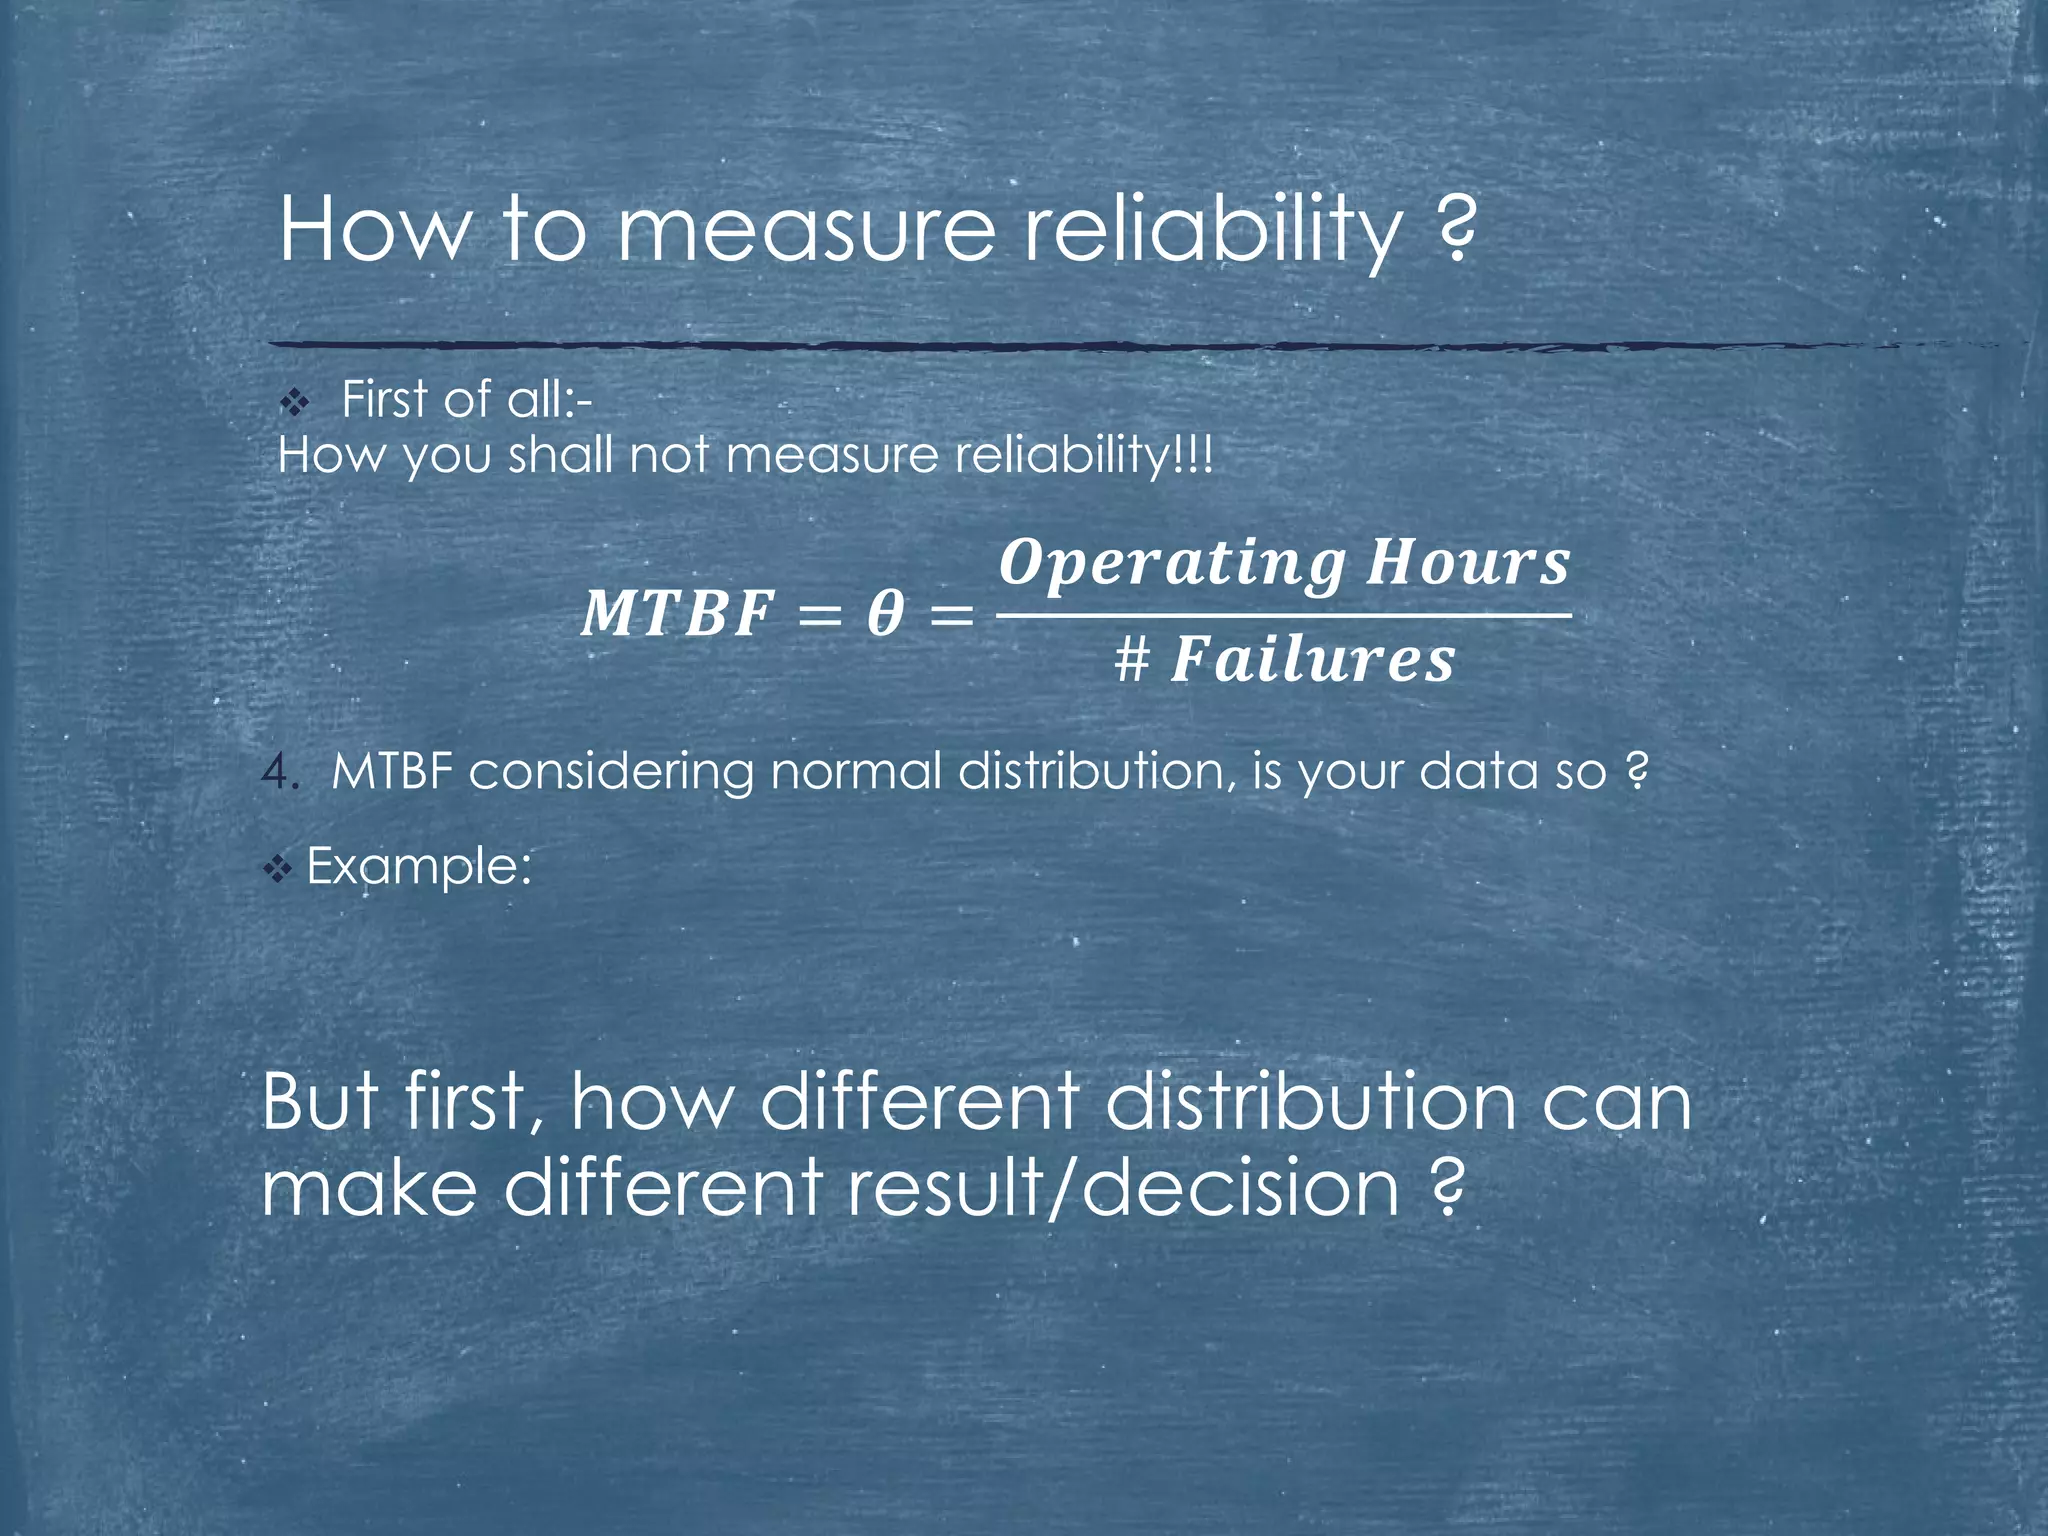

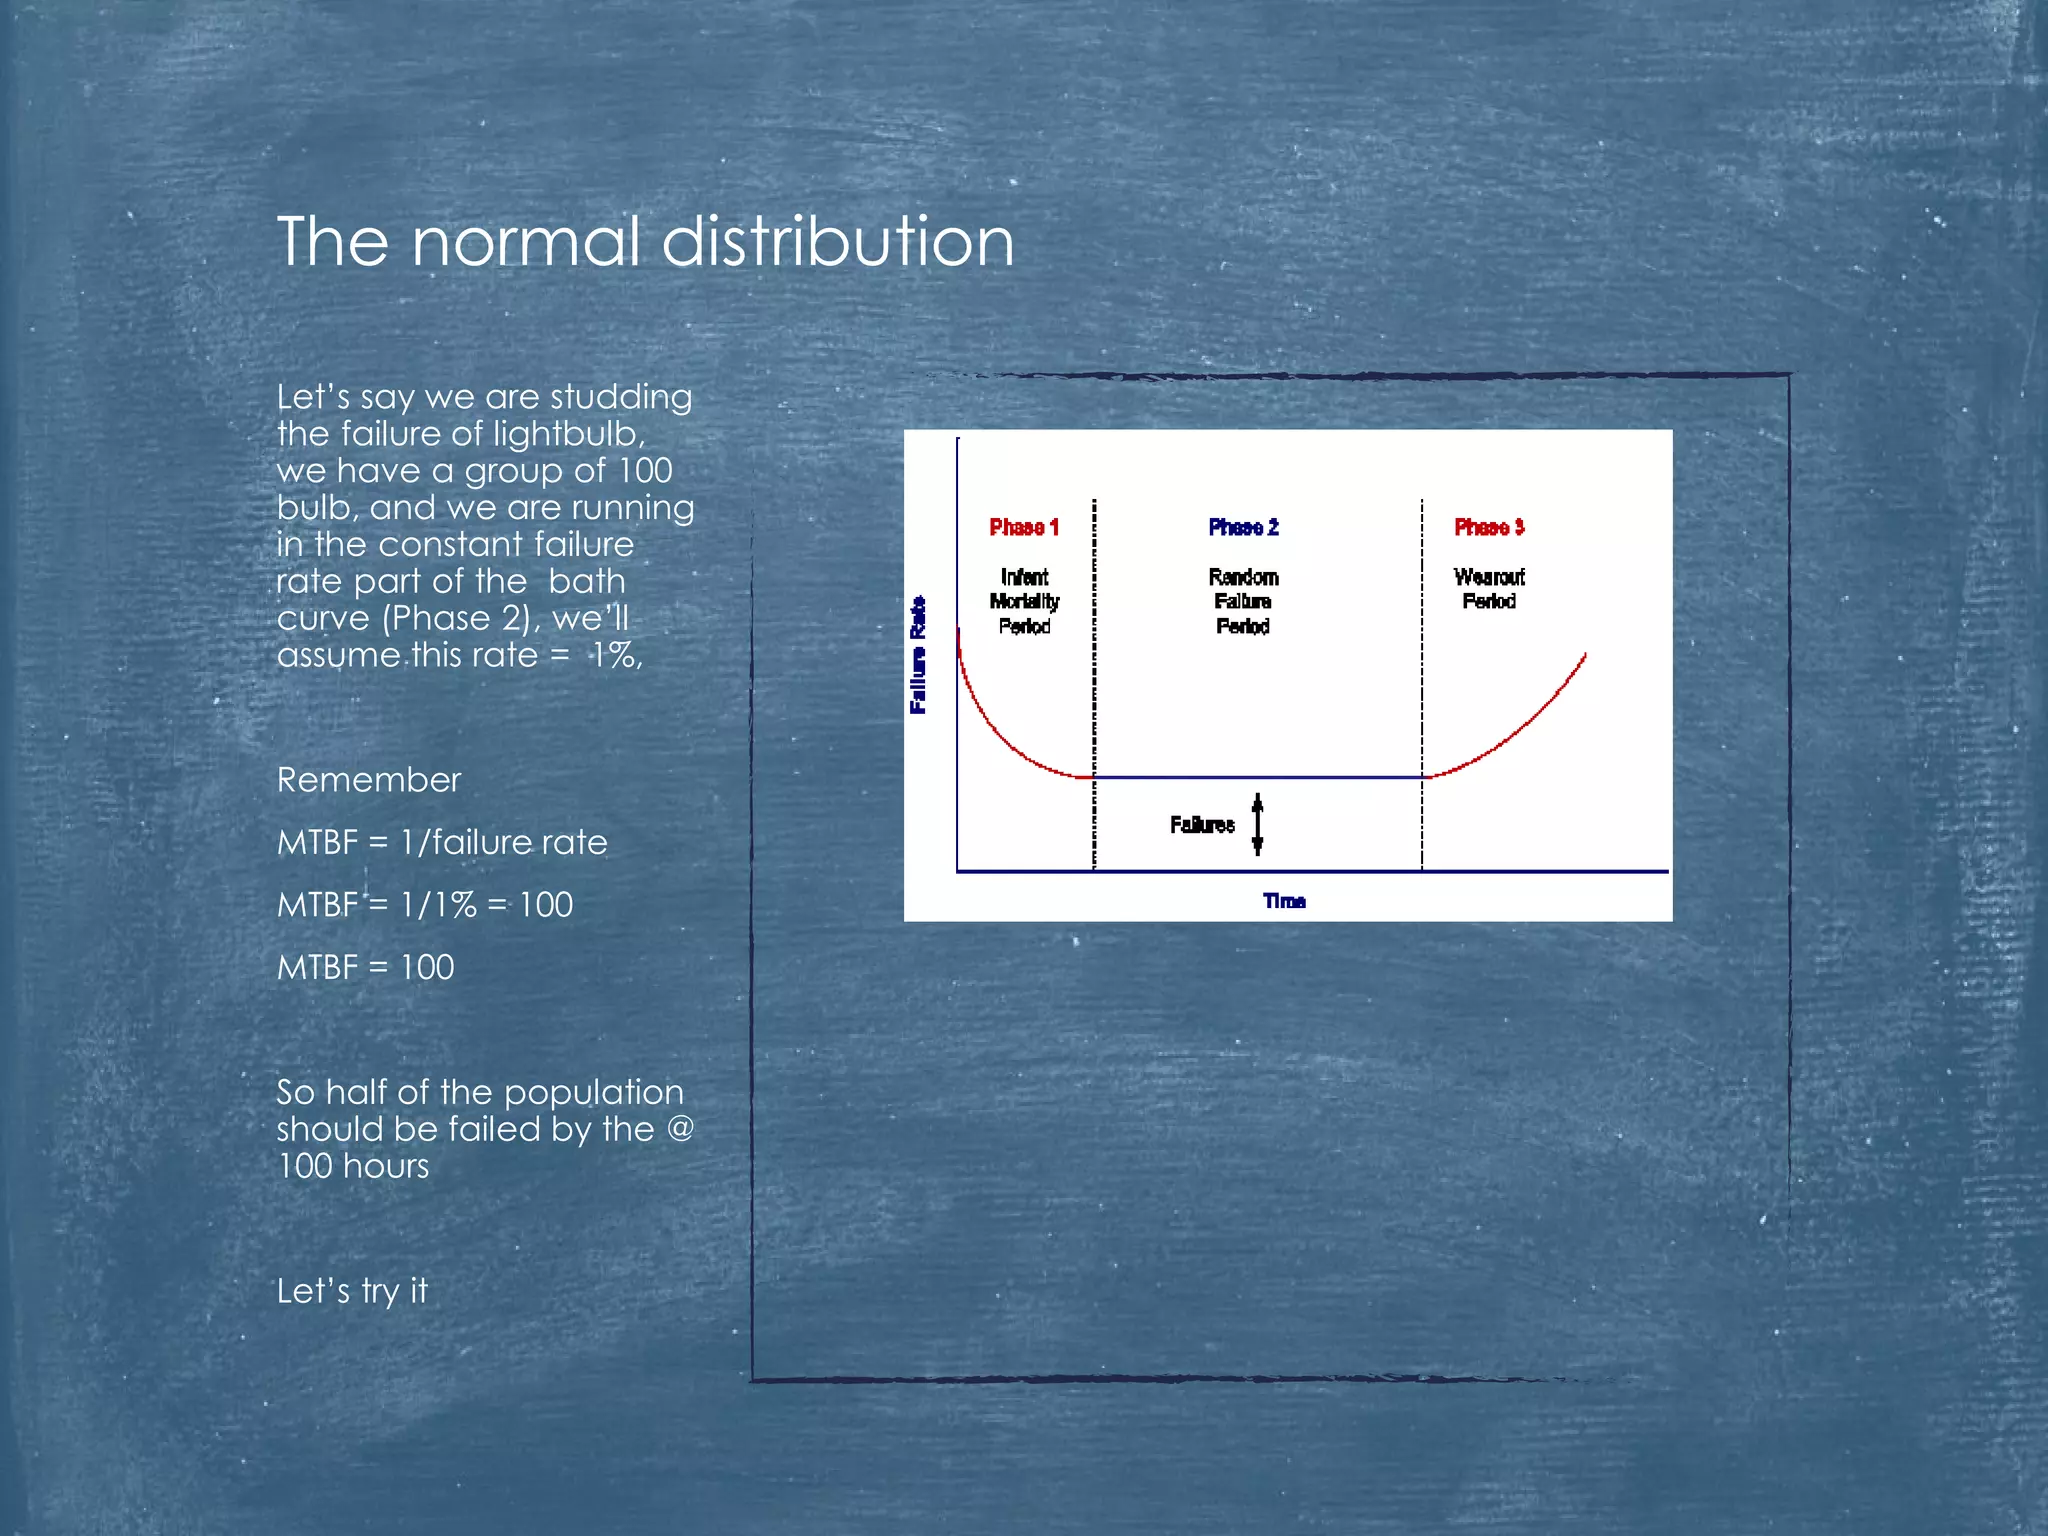
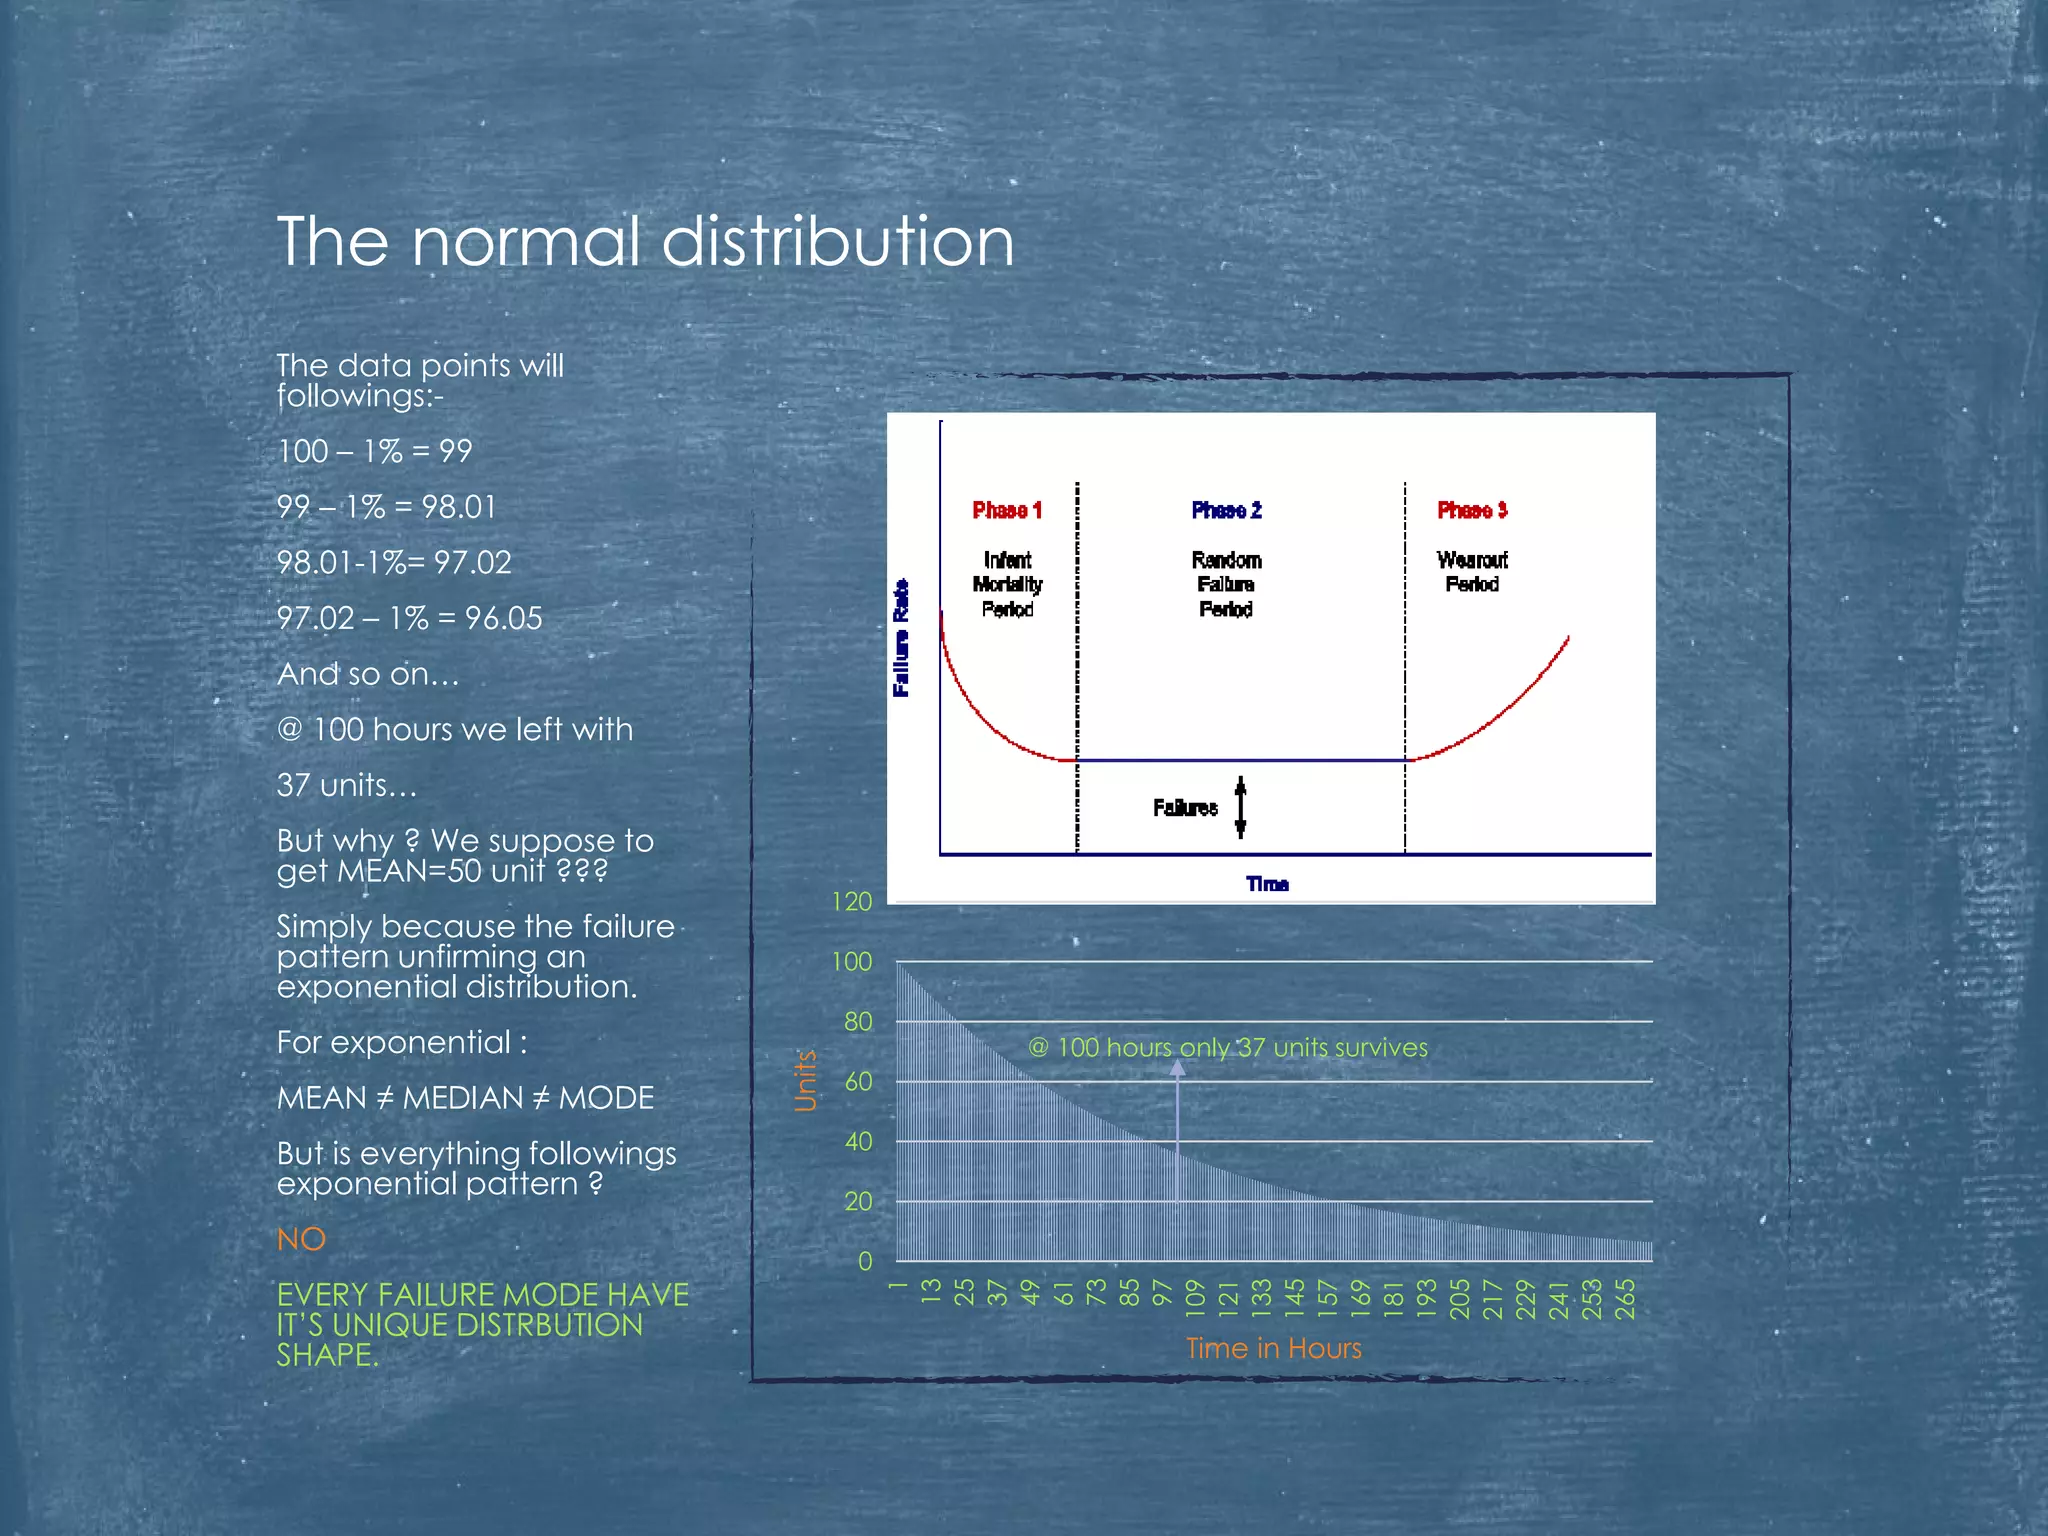
The document critiques the use of Mean Time Between Failures (MTBF) as a reliable indicator, highlighting its misleading nature and inability to accurately measure or benchmark reliability. It discusses examples demonstrating how MTBF can yield identical values despite differing failure patterns and emphasizes that it is time-independent. Ultimately, the author argues for alternative methods of measuring reliability that provide better insights into performance and improvement.