SlideShare a Scribd company logo
1 of 8
Download to read offline
ASSESSING THE IMPACTS OF FLOODING CAUSED BY EXTREME RAINFALL
EVENTS THROUGH A COMBINED GEOSPATIAL AND NUMERICAL MODELING
APPROACH
J. R. Santillana∗
, A. M. Amoraa
, M. Makinano-Santillana,b
, J. T. Marquesoa
, L. C. Cutamoraa
, J. L. Servianoa
, R. M. Makinanoa
a
CSU Phil-LiDAR 1 Project, Caraga Center for Geo-Informatics, College of Engineering and Information Technology,
Caraga State University, Ampayon, Butuan City, Agusan del Norte, Philippines - jrsantillan@carsu.edu.ph
b
Division of Geodetic Engineering, College of Engineering and Information Technology,Caraga State University,
Ampayon, Butuan City, Agusan del Norte, Philippines - mmsantillan@carsu.edu.ph
KEY WORDS: Extreme rainfall, Flooding, Impact assessment, 2D Flood modeling, LiDAR, Landsat
ABSTRACT:
In this paper, we present a combined geospatial and two dimensional (2D) flood modeling approach to assess the impacts of flooding
due to extreme rainfall events. We developed and implemented this approach to the Tago River Basin in the province of Surigao del
Sur in Mindanao, Philippines, an area which suffered great damage due to flooding caused by Tropical Storms Lingling and Jangmi
in the year 2014. The geospatial component of the approach involves extraction of several layers of information such as detailed
topography/terrain, man-made features (buildings, roads, bridges) from 1-m spatial resolution LiDAR Digital Surface and Terrain
Models (DTM/DSMs), and recent land-cover from Landsat 7 ETM+ and Landsat 8 OLI images. We then used these layers as inputs
in developing a Hydrologic Engineering Center Hydrologic Modeling System (HEC HMS)-based hydrologic model, and a hydraulic
model based on the 2D module of the latest version of HEC River Analysis System (RAS) to dynamically simulate and map the depth
and extent of flooding due to extreme rainfall events. The extreme rainfall events used in the simulation represent 6 hypothetical
rainfall events with return periods of 2, 5, 10, 25, 50, and 100 years. For each event, maximum flood depth maps were generated
from the simulations, and these maps were further transformed into hazard maps by categorizing the flood depth into low, medium
and high hazard levels. Using both the flood hazard maps and the layers of information extracted from remotely-sensed datasets in
spatial overlay analysis, we were then able to estimate and assess the impacts of these flooding events to buildings, roads, bridges and
landcover. Results of the assessments revealed increase in number of buildings, roads and bridges; and increase in areas of land-cover
exposed to various flood hazards as rainfall events become more extreme. The wealth of information generated from the flood impact
assessment using the approach can be very useful to the local government units and the concerned communities within Tago River
Basin as an aid in determining in an advance manner all those infrastructures (buildings, roads and bridges) and land-cover that can be
affected by different extreme rainfall event flood scenarios.
1. INTRODUCTION
1.1 Background
Flooding is one of the most destructive natural disasters in the
Philippines. Excessive quantity of rainfall brought by tropical
storms is the most common cause of flooding, just like what hap-
pened in various provinces in Mindanao Island when Tropical
Storms Lingling (Local name: Agaton) and Jangmi (Local name:
Seniang) caused rivers and lakes to overflow in 2014 (NDRRMC,
2014; 2015). In the advent of climate change which has caused
tropical storms and the rains that it brings along becoming fiercer
and extreme, the need to become more prepared for flood dis-
asters has also become more urgent (Few, 2003; Vidal and Car-
rington, 2013). It is in this need that simulating and assessing
the impacts of various flood scenarios is important not only for
the purpose of establishing a baseline information where disas-
ter managers can make a reference to when doing pre- and post-
disaster management and recovery efforts, but also for getting a
detailed picture of how and why such kind of flooding can oc-
cur or have occurred. These assessments are vital in figuring out
strategies that can minimize, or even avoid, the impacts should
similar events occur in the future. Flood impact assessment can
also help communities and local government units to be empow-
ered in finding ways to mitigate the negative impacts of flooding,
∗Corresponding author
as well as in evaluating adaptation strategies if such kind of flood-
ing will actually occur in the near future (Few, 2003).
1.2 Flood Risk Assessment
Assessing the risk of present and future flooding, especially those
brought by extreme rainfall events, is a very challenging task,
especially that the components of flood risk, such as the expo-
sures and hazards are subject to fast changes in time due to eco-
nomic development and the possible effect of the changing cli-
mate (Alfieri et al., 2015). In many studies (e.g. Alfieri et al.,
2015; Gilbuena et al., 2013; Ortiz et al., 2016), deriving potential
damages caused by flooding includes combining and intersecting
flood hazard maps with the exposed population and land cover
features. These methods are done with the use of Remote Sens-
ing (RS) and Geographic Information System (GIS) techniques,
which has significantly improved the efficiency of flood disas-
ter monitoring and management (Haq et al., 2012; Van Westen,
2013). Utilizing these technologies, a quicker and precise moni-
toring and mapping of flooding can be done by using satellite im-
ages and state-of-the-art modelling or simulation software (Hal-
dar and Khosa, 2015; Haq et al., 2012).
In the last few decades, numerical modeling has been signifi-
cantly enhanced and utilized in flood mapping due to the exis-
tence of reliable numerical methods and innovative topographic
survey techniques such as those provided by Light Detection
and Ranging or LiDAR technology (Costabile and Macchione,
2015). Typically, flood mapping through numerical simulations
comprises two components known as the hydrological simulation
which quantifies the size, duration and probability of the flood
event; and the hydraulic simulation which employs the mapping
of inundated areas (Dimitriadis, et al., 2016). Flood mapping can
be done in either 1-dimensional (1D) or 2-dimensional (2D) ap-
proach, but despite the efficiency if 1D flood modeling approach,
it has been progressively encouraged recently the use of 2D flood
simulation, since it can give detailed description of the hydraulic
behaviour of the river’s flow dynamics (Costabile and Macchione,
2015).
1.3 The case of Tago River Basin in Mindanao, Philippines
Tago River Basin (Figure 1) is located in the province of Surigao
del Sur in the island of Mindanao, Philippines. It is geograph-
ically facing the Pacific region wherein typhoons usually come
from. The basin’s large catchment area of approximately 1,444
km2
and a very wide floodplain traversed by a dense network of
rivers and streams make it vulnerable to flooding. Flooding in the
river basin due to overflowing of Tago River and its tributaries oc-
curs almost every year, especially during the rainy seasons from
the month of December to February. In 2014, the basin was one
of the many areas greatly affected by flooding due to heavy to tor-
rential rains brought about by the passing of tropical storms Aga-
ton and Seniang (NDRRMC, 2014; 2015). These flood events
affected not only the communities living in the flood plain but
also the sources of income which include large cropland areas.
A preliminary assessment of the impacts of Agaton and Seni-
ang in the Tago River Basin has recently been conducted by
Makinano-Santillan (2015). Using an integrated approach involv-
ing the use of LiDAR datasets, land-cover from Landsat images,
and one-dimensional (1D) flood models based on HEC HMS and
HEC RAS, the study was able to estimate 52.57% and 22.29%
of the buildings situated in the floodplains to have been flooded
during the two flood events, respectively. Cropland areas were
also found to be the most affected based on the model simula-
tions and geospatial analysis. However, the results of the study
was hindered by the low accuracy (70.30%) of the flood models
to predict flood depth and extents which may have been caused
by the limitations in the input data as well as in the 1D mod-
elling approach used. The input data limitation was on the use of
LiDAR Digital Terrain Model (DTM) without bathymetry data.
Since the flood model did not account the actual river bed topog-
raphy, the river flow dynamics were not fully characterized, and
may have falsely predicted flood depth and extent. On the other
hand, the low accuracy of the 1D hydraulic model (based on HEC
RAS) maybe due to the model’s discretization of topography as
cross sections rather than as a surface, including the subjectivity
of cross-section location and orientation as well as its inability
to simulate lateral diffusion of the flood wave (Samuels, 1990;
Hunter et al., 2007). With 2D flood modeling, these fundamental
constraints can be overcome (Hunter et al., 2007).
1.4 Objectives of the Study
In this paper, we present a combined geospatial and numerical
modeling approach to assess the impacts of flooding due extreme
rainfall events by fully utilizing the benefits of high spatial res-
olution topographic and feature information provided by LiDAR
technology, land-cover information from Landsat images, and 2D
flood models. Focusing on the Tago River Basin as our case study
area, we apply this approach to estimate how hypothetical ex-
treme rainfall events with return periods of 2, 5, 10, 25, 50 and
100-years can bring flooding, and how it can impact buildings,
roads, bridges and land-cover.
2. METHODS AND MATERIALS
2.1 The Combined Geospatial and 2D-Numerical Modeling
Approach
Figure 2 summarizes the combined geospatial and numerical
modeling approach as implemented in this study for flood impact
assessment.
The geospatial component of the approach involves extraction
of exposure datasets from remotely-sensed high spatial resolu-
tion elevation models and images. These exposure datasets are
the man-made features (buildings, roads, bridges) and land-cover
which are extracted through manual digitization and image clas-
sification, respectively. The numerical modeling consisted of de-
veloping the hydrologic model of the river basin which is then
used to determine the volume and discharge of water entering
the floodplains; and the 2D hydraulic model which simulates the
flow of water entering on the rivers and on the floodplains as
rain pours to the area. The development of the hydrologic and
hydraulic models utilizes high spatial resolution elevation mod-
els and were parameterized using the information extracted from
the land-cover map. The models simulate flooding events by in-
putting rainfall data which can either be actual or hypothetical
rainfall events.
2D numerical modeling is very advantageous compared to 1D
modeling especially when dealing with a complicated river sys-
tem that has multiple streams with complex flows. 2D modeling
also removes subjective techniques usually employed in develop-
ing a 1D model, such as cross-section orientation.
The 2D hydraulic model uses flow information computed by the
hydrologic model to generate flood maps corresponding to hypo-
thetical rainfall events with return periods of 2, 5, 10, 25, 50 and
100 years. The flood depth and extent generated are then catego-
rized based on the different flood hazard levels. The categoriza-
tion are low hazard for depths of less than 0.50 m, medium hazard
for depths from 0.50 m to 1.50 m, and high hazard for depths of
greater than 1.50 m. These maps are then utilized together with
the extracted exposure datasets in the spatial overlay analysis to
assess the various levels of impacts of flooding brought by 6 dif-
ferent extreme rainfall events.
2.2 Exposure Dataset Extraction
2.2.1 Feature Extraction: One of the basic inputs for flood
impact assessment is a hazard exposure dataset. The expo-
sure datasets considered in this study are the man-made features
(buildings, roads, bridges) and the land-cover within the flood-
plains of Tago River Basin. The man-made exposure datasets
were manually digitized from 1-m spatial resolution LiDAR-
derived DTM and DSM acquired last 2014 by the University of
the Philippines - Diliman Disaster Risk and Exposure Assessment
for Mitigation (UP DREAM) Program. The extraction process
was aided with the use of high-resolution satellite images from
Google Earth.
2.2.2 Land-cover Map Derivation: The land-cover informa-
tion of Tago River Basin was obtained though Maximum Likeli-
hood (ML) classification of Landsat 8 OLI and Land 7 ETM+
satellite images which were downloaded from the USGS Earth
Explorer (http://earthexplorer.usgs.gov/). More than one image
was utilized for Tago River Basin image classification. This was
done to supplement missing data in one image caused by the pres-
ence of cloud-cover. The images used are the Landsat 8 OLI im-
ages acquired last March 31 and June 3, 2014, and Landsat 7
Figure 1: Map showing the location and coverage of Tago River Basin.
Figure 2: A combined geospatial and 2D numerical modeling approach for flood impact assessment.
ETM+ image acquired last August 8, 2012. These images un-
derwent pre-processing including radiometric calibration which
converts image pixel values to top-of-atmosphere (TOA) radi-
ance; and atmospheric correction which corrects the pixel val-
ues for atmosphere effects and to convert the TOA radiance to
surface reflectance. NDVI and DEM were also incorporated to
the Landsat surface reflectance bands as additional data sources
for land-cover classification since it has been found to increase
classification accuracy. NDVI and DEM can account for the
rugged topography so as to eliminate the presence or absence
of certain classes in some elevation zones, and reduces the im-
pact of shadows and to enhance the separation among various
land-cover classes (Watanachaturaporn et al., 2008). There were
seven classes considered in the analysis: barren, built-up, crop-
land, grassland, palm, forest, and water areas. The March 2014
image served as the main image for classification. The missing
land-cover information due to the presence of cloud and cloud
shadow in this image was supplemented using the land-cover
maps derived from individual ML classification of the June 2014
and August 2012 images. After supplementing the missing data
in the land-cover map, it was further subjected to contextual edit-
ing to correct obvious misclassification through visual inspection.
The accuracy of the finalized land-cover map was then assessed
using a procedure suggested by Congalton and Green (2009). The
procedure involves a random selection of at least 50 points (or
validation pixels) for each land-cover class in the finalized land-
cover map. The actual land-cover classes of these random points
were then verified by overlaying them to high resolution satellite
images available in Google Earth. The minimum of 50 points
per class is considered a rule-of-thumb in assessing the accuracy
of land-cover maps whose coverage is less than 1 million acres
(approx. 40,469 km2
) in size and with fewer than 12 land-cover
classes (Congalton and Green, 1999). For Tago River Basin, the
area covered is only 1,444 km2
. Hence, only 50 random points
per class were selected. With 8 land-cover classes, there were
a total of 400 random points. The comparisons between the ac-
tual and classified land-cover classes for each random point were
then summarized using a confusion or error matrix. From this
matrix, the Overall Classification Accuracy, Producers Accuracy
and Users Accuracy were then computed.
The land-cover map was used to obtain land-cover statistics of the
basin. It was also converted into runoff potential (or Curve Num-
ber, CN) and Mannings roughness maps which are required pa-
rameters in the development of the hydrologic and 2D hydraulic
models.
2.3 Numerical Modeling and Flood Hazard Maps Genera-
tion
2.3.1 Hydrologic Model Development and Calibration:
The hydrologic model of Tago River Basin was developed using
the Hydrologic Engineering Center Hydrologic Modeling Sys-
tem (HEC HMS) Version 3.5, a software specifically designed
to simulate the precipitation-runoff processes of watershed sys-
tems (USACE, 2000). HEC HMS modeling is dependent on three
components: the basin model, meteorological model, and a set of
control specification indicating the time step and simulation pe-
riod. The basin model, which is the physical representation of the
watershed, was developed by utilizing a 10-m Synthetic Aperture
Radar Digital Elevation Model (SAR DEM) and the rivers net-
works in the delineation of watersheds; and was parameterized
using the information from the land-cover map that was gener-
ated earlier.
The hydrologic model can simulate actual and historical rainfall
events by using the rainfall data recorded by the Advanced Sci-
ence and Technology Institute of the Department of Science and
Technology (ASTI DOST) rain gauge located at Barangay Tina
in the Municipality of San Miguel (Figure 1); and hypothetical
rainfall events by using the Rainfall Intensity Duration Frequensy
(RIDF) data from the Philippine Atmospheric, Geophysical and
Astronomical Services Administration (PAGASA). RIDF curves
provide information on the likelihood of rainfall events of various
amounts and durations. For this study, we used RIDF of the Hi-
natuan PAGASA Weather Station which is nearest to the basin.
These extreme rainfall events are expressed as “return period”.
For every rain return period, a 24-hour duration rainfall scenario
was constructed in HEC HMS wherein the rain was set to peak at
the sixth hour from the start of the simulation (see Figure 3 and
Table 1).
Prior to its use in simulating flow hydrographs due to extreme
rainfall events, the parameters of the model were calibrated by
relating the simulated flow hydrographs to the actual measured
flow in the river. The station utilized during model calibration
was Cabtik Bridge. Hydrological data necessary for calibration
was gathered from this station last 12/16/2014 to 12/23/2014 with
the use of water level and velocity data logging sensors together
with the river cross-section data. In evaluating the model perfor-
mance before and after calibration, three measures of accuracy
were used. These are the Nash-Sutcliffe Coefficient of Model
Efficiency (NSE), percentage bias (PBIAS), and the RMSE - ob-
servations standard deviation ratio (RSR). These measures were
computed by comparing the observed and the simulated hydro-
graphs in accordance with existing evaluation guidelines for sys-
tematic quantification of accuracy in hydrological simulations
(Moriasi et al., 2007).
2.3.2 Hydraulic Model Development: The 2D hydraulic
model of Tago River Basin was based on the Hydrologic En-
gineering Center River Analysis System (HEC RAS) version
5.0, which is designed to perform one-dimensional (1D), two-
dimensional (2D), or combined 1D and 2D hydraulic calculations
for a full network of natural and constructed channels (USACE,
2016). For Tago River Basin, 2D modeling was performed with
no 1D element present. The 2D HEC RAS model was developed
by creating a 2D flow area (i.e., the 2D model domain) repre-
senting the entire floodplain of the river basin. The 2D flow area
mesh of Tago has an approximate area of 565.31 km2
and was
computed using a 60-m by 60-m cell size. This cell size was cho-
sen since Tago River Basin has a very large 2D area and setting it
with a much smaller cell size would make run times of the simu-
lations much longer. With the aid of break lines representing the
roads, dikes, levees and river banks, the 2D flow area was finally
computed to consist a total of 162,565 cells. The 1-m spatial res-
olution LiDAR-derived DTM and the Manning’s roughness co-
efficients extracted from the land-cover map were used as inputs
in setting the model’s geometric data. The model consisted of 10
boundary conditions in which 8 are inflows from upstream rivers,
1 as the tidal boundary condition at the sea, and 1 boundary con-
dition for the precipitation that falls to the 2D area
2.3.3 Flood Depth and Hazard Mapping: The flow hydro-
graphs generated by the calibrated HEC HMS model were used
as inputs into the HEC RAS 2D hydraulic model to predict or es-
timate flood depths and extents. Each hydrograph represents the
flow of water entering the 2D model domain, i.e., at the 8 inflow
boundary condition locations. These flow hydrographs together
with the time series of rainfall and tidal data were utilized by
the unsteady flow analysis module of HEC RAS to dynamically
simulate depth and extent of flooding. For each extreme rainfall
event flood simulation, a spatially-distributed grid of maximum
flood depths was generated. This depth grid was then exported as
a raster file in the GIS software ArcGIS and converted into flood
hazards by categorizing depths to its corresponding hazard levels
(low: < 0.50 m depth, medium: 0.50 m - 1.50 m depth, and high:
> 1.50 m depth).
Before using the combined HEC HMS-HEC RAS 2D in generat-
ing flood hazard maps, its accuracy was first determined. Using
the 2 models, a flooding in the area that happened last January
2014 caused by tropical storm Agaton was reconstructed. The
combined models utilized actual rainfall data recorded from the
ASTI-DOST rainfall station at barangay Tina, San Miguel. The
resulting flood map from this flooding reconstruction was then
compared to the actual flooding information gathered in the field.
Flood map validation surveys were conducted to gather this in-
formation last February 2015. Pre-determined random locations
within the floodplain of Tago River Basin were visited to deter-
mine whether they were flooded or not during Agaton. The accu-
racy computation includes the use of confusion matrix approach
which was done by comparing the total number of correctly pre-
dicted points over the total number of points collected; and the
measure of fit known as F Measure which answers the question
of whether the flood extent reflected in the map is the same on
the ground (Aronica, et al., 2002; Horritt, 2006). The computa-
tion was done using the formula:
F =
A
A + B + C
(1)
where F = the measure of fit; A = the number of points cor-
rectly predicted as “flooded’; B = the number of over-predicted
points (“not flooded” in reality but predicted as “flooded”); and C
= the number of under-predicted points (“flooded” in reality but
predicted as “not flooded”). F = 1 means that the observed and
predicted flooding extents coincide exactly, while F = 0 means
that no overlap exists between predicted and observed flooding
extents. Flooding extents generated by the model can be assessed
either as Good Fit (F is greater than or equal to 0.7), Intermedi-
ate Fit (F is from 0.5 to less than 0.7), or Bad Fit (F less than 0.5)
(Breilh, et al., 2013).
Duration
Return Period (Years)
2 5 10 25 50 100
5 min 12.1 15.9 18.5 21.7 24.1 26.4
15 min 27.2 35.9 41.7 49.0 54.4 59.8
1 hr 61.8 82.8 96.6 114.2 127.2 140.1
2 hrs 85.8 116.9 137.5 163.5 182.8 202.0
3 hrs 103.8 141.9 167.2 199.1 222.8 246.3
6 hrs 132.7 190.6 228.9 277.3 313.2 348.8
12 hrs 164.3 230.6 274.4 329.8 370.9 411.7
24 hrs 201.0 276.5 326.5 389.7 436.6 483.1
Table 1: The extreme values (in mm) of precipitation of the 6
hypothetical rainfall events based on RIDF data of Hinatuan PA-
GASA Weather Station.
2.4 Flood Impact Assessment
The impacts of flooding were assessed through spatial overlay-
ing of the exposure datasets (building, roads, bridges and land-
Figure 3: 24-hour rainfall scenario for the 6 hypothetical extreme
rainfall events.
cover) with the generated flood hazard maps for the different rain-
fall events using ArcGIS software. The flooding impact to land-
cover classes was determined by computing the inundated areas
for each class for all events. For buildings and roads, flooding
impacts were assessed by categorizing every building and road
according to hazard level (low, medium, high, or not flooded)
depending on what hazard level they are intersected with. The
impacts of flooding to bridges were assessed by comparing their
elevation to the maximum elevation of flood water where there
are located; this will determine whether a certain bridge will al-
ready be un-passable if a flooding due to a particular extreme
rainfall event will occur.
3. RESULTS AND DISCUSSION
3.1 Exposure Datasets
3.1.1 Buildings, Roads and Bridges: The digitized expo-
sure datasets derived using the 1-m spatial resolution LiDAR-
derived DSM of Tago River Basin floodplain areas totaled to
12,830 buildings, 228 roads and 69 bridges. These features were
checked and validated using the high-resolution satellite images
from Google Earth.
3.1.2 Land-cover: The land-cover map of Tago River Basin
derived from the analysis of the Landsat satellite images is shown
in Figure 4 with its statistics listed in Table 2. This land-cover
map has an over-all classification accuracy of 92%, with the Pro-
ducer’s and User’s Accuracies for all land-cover classes greater
than 85%. It can be found that next to forest, cropland is the ma-
jor land-cover in the river basin, occupying 11.65% of the basin‘s
total land area.
3.2 Accuracy of the Hydrologic Model
Figure 5 shows the results after the calibration of the Tago HEC
HMS model. Based on Moriasi et al. (2007)’s evaluation guide-
lines, the overall performance of the model was found to be very
good, with an NSE = 0.98, PBIAS = -0.76, and RSR = 0.15. This
means that the HEC HMS can be confidently used in simulating
flow hydrographs for extreme rainfall event scenarios.
Figure 4: The year 2014 land-cover map of Tago River Basin
derived from Landsat images.
Class Name Area, in km2
Barren Areas 51.14
Built-ups and Roads 4.39
Cropland 168.35
Forest 999.12
Grasses and Shrubs 146.43
Palm (Coconut and Banana) 55.30
Water Bodies 19.75
Total 1,444.49
Table 2: Area per land-cover class in Tago river basin
Figure 5: Result of calibrating the Tago HEC HMS model using
the measured flow data at Cabtik Bridge.
3.3 Flood Hazard Maps Generated using Combined HMS
and RAS Models and Its Accuracy
Example flow hydrographs simulated by the calibrated HEC
HMS model at Cabtik Bridge station for the different extreme
rainfall events are shown in Figure 6. It can be seen that as the
rainfall return period increases (i.e., as rainfall becomes extreme),
the peak flow rate in Cabtik Bridge also increases from approxi-
mately 2,500 m3
/s for a 2-year return period to more than 8,000
m3
/s for a 100-year return period rainfall event.
The generated flood hazard maps of Tago River Basin for the 6
extreme rainfall events are shown in Figure 7. It can be found
that as the rainfall return period increases, the extent of flooding
also increases.
The accuracy of these flood hazard maps can be approximated
using the results of the validation of the Agaton flood map gen-
Figure 7: The generated flood hazard maps of Tago River Basin for the 6 rainfall return periods.
Figure 6: 24-hour outflow hydrographs generated at Cabtik
Bridge station for the 6 rain return periods.
erated by the same models (Figure 8). Utilizing the flood in-
formation gathered within Tago River Basin floodplain areas the
reconstructed flooding extent during tropical storm Agaton was
analyzed. The F Measure was calculated as 0.81, indicating that
the flood map generated by the combined HEC HMS-HEC RAS
2D models is a good fit. The accuracy of the model, based on
the result of the confusion matrix analysis (Table 3), is 83.33%,
which leads us to an assumption that any flooding event the mod-
els generates is approximately 83.33% accurate.
Figure 8: Map showing the validation points in Tago River Basin
overlaid in the generated Agaton flood hazard map.
3.4 Flood Impact Assessment
The results of assessing the impacts of flooding to the buildings,
roads, bridges and land-cover in Tago River Basin floodplain ar-
eas are shown in Figure 9, Figure 10 Figure 11 and Figure 12,
respectively.
It was found that the area of inundated land-cover and the number
of affected buildings, roads and bridges increase as the rainfall
event return period increases. Among the land-cover classes, the
Actual Flooding Scenario User’s
Accuracy
Flooded
Not
Flooded
Total
Flood
Model
Simulated
Flooding
Flooded 74 11 85 87.06%
Not
Flooded
6 11 17 64.71%
Total 80 22 102
Producer’s Accuracy 92.50% 50.00%
Sum of Diagonal
Values
85
Overall Accuracy 83.33% (85/102)
Table 3: Result of the flood map accuracy analysis in Tago River
Basin for the Agaton event.
cropland areas are the most affected with 66.27% and 90.70% in-
undated for a 2-year and 100-year rainfall return periods, respec-
tively. For the flooding impact assessment on the buildings expo-
sure datasets, it can be noted that several structures are flooded
even for just a 2-year rainfall return. A total of 6,662 out of
12,830 buildings or 51.93% will be flooded for a 2-year rain re-
turn event that is having a 50% probability of occurrence every
year. For the worst case scenario, a 100-year rain return event is
expected to inundate 10,674 or 83.20% buildings, 204 or 89.47%
roads, and 33 or 47.83% bridges. All of these results are assumed
to be 83.33% accurate based on the result of the flood map vali-
dation.
Figure 9: Number of affected buildings for each of the 6 extreme
rainfall events.
Figure 10: Number of affected roads for each of the 6 extreme
rainfall events.
Figure 11: Number of flooded bridges for each of the 6 extreme
rainfall events.
Figure 12: Percentage of flooded land-cover class for each of the
6 extreme rainfall events.
4. CONCLUSION
A detailed assessment of flooding was presented with the use of
the combined geospatial and numerical modeling approach. This
approach was found to be very useful in assessing flooding im-
pacts of extreme rainfall events to the features at risk within the
floodplains of Tago river basin. With the utilization of high spatial
resolution digital elevation models, Landsat satellite images and
flood models, detailed information on the possible affected build-
ings, roads, bridges and land-cover was determined. The results
of the assessments ashowed an increase in the number of build-
ings and roads, and increase in areas of inundated land-cover as
rainfall events become more extreme (i.e., increase in return peri-
ods). The results of these assessments can be considered more re-
liable than the assessment conducted earlier (Makinano-Santillan
et al., 2015) due to higher accuracy of the flood maps generated
in the present study.
The wealth of information generated from the flood impact as-
sessment using the approach can be very useful to the local gov-
ernment units (LGUs) and the concerned communities within
Tago River Basin as an aid in determining in an advance man-
ner all those infrastructures (buildings, roads and bridges) and
land-cover that can be affected by different extreme rainfall event
flood scenarios. These assessments are very timely especially
that rains brought by storms have become fiercer in recent years,
and will continue to be so due to the effect of climate change.
With the knowledge learned from the numerical model simula-
tions and flood hazard mapping, LGUs and the communities in
Tago River Basin can be informed and empowered in finding
ways to mitigate the negative impacts of flooding, as well as in
evaluating adaptation strategies if more intense events will occur
in the near future. These adaptation strategies may include (i.)
localized land-use planning integrating flood hazard information,
(ii.) relocating communities to safe grounds, (iii.) identification
and improvement of evacuation routes, and (iv.) building flood
defences (specifically in areas where river overflowing occurs),
among many others.
ACKNOWLEDGEMENTS
This work is an output of the Caraga State University (CSU) Phil-
LiDAR 1 project under the Phil-LiDAR 1. Hazard Mapping of
the Philippines using LiDAR program funded by the Department
of Science and Technology (DOST). The SAR DEM and the Li-
DAR DTM and DSM including the river bathymetric data used
in this work were provided by the University of the Philippines
Disaster Risk and Exposure for Mitigation (UP DREAM)/Phil-
LIDAR 1 Program. We thank all CSU-Phil-LIDAR 1 technical
staff and assistants, as well as the Local Government Units in the
Tago River Basin for their assistance during the conduct of hy-
drological measurements and flood map validation surveys.
REFERENCES
Alfieri, L., Feyen, L., Dottori F., Bianchi A., 2015. Ensemble
flood risk assessment in Europe under high end climate scenarios.
Global Environmental Change, 35, pp. 199-212.
Aronica, G., Bates, P. D., and Horritt, M. S., 2002. Assessing the
uncertainty in distributed model predictions using observed bi-
nary pattern information within GLUE. Hydrological Processes,
16(10), pp. 2001-2016.
Breilh, J. F., Chaumillon, E., Bertin, X., Gravelle, M., 2013. As-
sessment of static flood modeling techniques: application to con-
trasting marshes flooded during Xynthia (western France). Natu-
ral Hazards and Earth System Science, 13(6), 1595-1612.
Congalton, R.G., Green, K., 2009. Assessing the Accuracy of
Remotely Sensed Data: Principles and Practices Second Edition,
CRC Press/Taylor and Francis, Boca Raton, Florida, USA.
Costabile P., Macchione F., 2015. Enhancing river model set-up
for 2-D dynamic flood modelling. Environmental Modelling and
Software, 67, pp. 89-107.
Dimitriadis P., Tegos A., Oikonomou A., Pagana V., Koukouvi-
nos A., Mamassis N., Koutsoyiannis D., Efstratiadis A., 2016.
Comparative evaluation of 1D and quasi-2D hydraulic models
based on benchmark and real-world applications for uncertainty
assessment in flood mapping. Journal of Hydrology, 534, pp.478-
492.
Few R., 2003. Flooding, vulnerability and coping strategies: lo-
cal response to a global threat. Progress in Development Studies,
3(1), pp. 43-58.
Gilbuena Jr. R., Kawamura A., Medina, R., Nakagawa, N.,
Amaguchi H., 2013. Environmental impact assessment using a
utility-based recursive evidential reasoning approach for struc-
tural flood mitigation measures in Metro Manila, Philippines.
Journal of Environmental Management, 131, pp. 92-102.
Haldar, R., Khosa R., 2015. Flood level mitigation study using
1-D hydrodynamic modeling. Aquatic Procedia, 4, pp. 925-932.
Haq M., Akhtar M., Muhammed S., Paras S., Rahmatullah J.,
2012. Techniques of remote sensing and GIS for flood moni-
toring and damage assessment: A case study of Sindh province,
Pakistan. The Egyptian Journal of Remote Sensing and Space
Science, 15(2) , pp. 135-141.
Horritt, M. S., 2006. A methodology for the validation of uncer-
tain flood inundation models. Journal of Hydrology, 326, 153-
165.
Hunter, N.M., Bates, P.D., Horrit, M.S., Wilson, M.D., 2007.
Simple spatially-distributed models for predicting flood inunda-
tion: A review. Geomorphology, 90, pp. 208-225.
Makinano-Santillan, M., Santillan, J.R, Amora, A.M., Marqueso,
J.T., Cutamota L.C., Serviano J.L., Oconer P.C.R., Makinano
R.M., 2015. Assessing the impacts of flooding in Tago River
Basin, Mindanao, Philippines through integration of high reso-
lution elevation datasets, Landsat image analysis, and numerical
modelling. In: 36th Asian Conference on Remote Sensing 2015
(ACRS 2015): Fostering Resilient Growth in Asia, Quezon City,
Metro Manila, Philippines, Vol. 3, pp. 1606-1617.
Moriasi, D.N., Arnold, J.G., Van Liew, M.W., Bingner, R.L.,
Harmel, R.D., Veith, T.L., 2007. Model evaluation guidelines for
systematic quantification of accuracy in watershed simulations.
Transactions of the ASABE, 50, pp. 885-900.
NDRRMC, 2014. NDRRMC Updates Sitrep No. 33 re: Effects
of Tropical Depression Agaton. National Disaster Risk Reduc-
tion and Management Council. http://www.ndrrmc.gov.ph/ (01
February 2014).
NDRRMC, 2015. NDRRMC Updates Sitrep No. 22 re: Effects
of Tropical Storm Seniang. National Disaster Risk Reduction
and Management Council. http://www.ndrrmc.gov.ph/ (22 Jan-
uary 2015).
Ortiz R., Ortiz P., Martin J. M., Vazquez, M. A., 2016. A new
approach to the assessment of flooding and dampness hazards in
cultural heritage, applied to the historic centre of Seville (Spain).
Science of the Total Environment, 551-552, pp. 546-555.
Samuels, P.G., 1990. Cross-section location in 1-D models. In:
White, W.R., Watts, J. (Eds.), 2nd International Conference on
River Flood Hydraulics, Wiley, Chichester, pp. 339350.
USACE, 2000. Hydrologic Modeling System HEC-HMS Tech-
nical Reference Manual, United States Army Corps of Engineers,
Hydrologic Engineering Center, Davis, California, USA.
USACE, 2016. HEC-RAS River Analysis System Hydraulic Ref-
erence Manual, Institute for Water Resources Hydrologic Engi-
neering Center, Davis, California, USA.
Van Westen, C. J., 2014. Remote sensing and GIS for natural haz-
ards assessment and disaster risk management. Reference Module
in Earth Systems and Environmental Sciences, pp. 259-298.
Vidal J., Carrington, D., 2013. Is climate change to
blame for Typhoom Haiyan?.Guardian News and Media.
http://www.theguardian
.com/world/2013/nov/12/typhoon-haiyan-climate-change-
blame-philippines.html (14 Januaryl 2016).
Watanachaturaporn, P., Arora, M.K., Varshney, P.K., 2008. Mul-
tisource classification using support vector machines: an empiri-
cal comparison with decision tree and neural network classifiers.
Photogrammetric Engineering and Remote Sensing, 74, pp. 239-
246.

More Related Content

What's hot

Forecasting Model of Flood Inundated Areas along Sharda River in U.P.
Forecasting Model of Flood Inundated Areas along Sharda River in U.P.Forecasting Model of Flood Inundated Areas along Sharda River in U.P.
Forecasting Model of Flood Inundated Areas along Sharda River in U.P.iosrjce
 
IRJET- Flood Susceptibility Assessment through GIS-Based Multi-Criteria Appro...
IRJET- Flood Susceptibility Assessment through GIS-Based Multi-Criteria Appro...IRJET- Flood Susceptibility Assessment through GIS-Based Multi-Criteria Appro...
IRJET- Flood Susceptibility Assessment through GIS-Based Multi-Criteria Appro...IRJET Journal
 
Role of Geologists in Natural Hazard Mapping and Application_Dr Kyi Khin_MGSS...
Role of Geologists in Natural Hazard Mapping and Application_Dr Kyi Khin_MGSS...Role of Geologists in Natural Hazard Mapping and Application_Dr Kyi Khin_MGSS...
Role of Geologists in Natural Hazard Mapping and Application_Dr Kyi Khin_MGSS...KYI KHIN
 
ÖNCEL AKADEMİ: İSTANBUL DEPREMİ
ÖNCEL AKADEMİ: İSTANBUL DEPREMİÖNCEL AKADEMİ: İSTANBUL DEPREMİ
ÖNCEL AKADEMİ: İSTANBUL DEPREMİAli Osman Öncel
 
Analysis of runoff for vishwamitri river watershed using scs cn method and ge...
Analysis of runoff for vishwamitri river watershed using scs cn method and ge...Analysis of runoff for vishwamitri river watershed using scs cn method and ge...
Analysis of runoff for vishwamitri river watershed using scs cn method and ge...vishvam Pancholi
 
Dissertation Defense Powerpoint FINAL
Dissertation Defense Powerpoint FINALDissertation Defense Powerpoint FINAL
Dissertation Defense Powerpoint FINALKhalil A. Lezzaik
 
DEM-based Methods for Flood Risk Mapping at Large Scale
DEM-based Methods for Flood Risk Mapping at Large ScaleDEM-based Methods for Flood Risk Mapping at Large Scale
DEM-based Methods for Flood Risk Mapping at Large ScaleSalvatore Manfreda
 
IRJET- Estimation of Surface Runoff using Curve Number Method- A Geospatial A...
IRJET- Estimation of Surface Runoff using Curve Number Method- A Geospatial A...IRJET- Estimation of Surface Runoff using Curve Number Method- A Geospatial A...
IRJET- Estimation of Surface Runoff using Curve Number Method- A Geospatial A...IRJET Journal
 
Sea level rise and storm surge tools and datasets supporting Municipal Resili...
Sea level rise and storm surge tools and datasets supporting Municipal Resili...Sea level rise and storm surge tools and datasets supporting Municipal Resili...
Sea level rise and storm surge tools and datasets supporting Municipal Resili...GrowSmart Maine
 
Application of remote sensing and gis for groundwater
Application of remote sensing and gis for groundwaterApplication of remote sensing and gis for groundwater
Application of remote sensing and gis for groundwaterRamodh Jayawardena
 
urpl969-group2-paper-03May06
urpl969-group2-paper-03May06urpl969-group2-paper-03May06
urpl969-group2-paper-03May06Wintford Thornton
 
Toronto Overland Flow & Basement Flooding – ArcScene 3D Visualization of Fluv...
Toronto Overland Flow & Basement Flooding – ArcScene 3D Visualization of Fluv...Toronto Overland Flow & Basement Flooding – ArcScene 3D Visualization of Fluv...
Toronto Overland Flow & Basement Flooding – ArcScene 3D Visualization of Fluv...Robert Muir
 
Estimation of morphometric parameters and
Estimation of morphometric parameters andEstimation of morphometric parameters and
Estimation of morphometric parameters andeSAT Publishing House
 
IDENTIFICATION OF GROUNDWATER POTENTIAL ZONES USING REMOTE SENSING AND GEOGRA...
IDENTIFICATION OF GROUNDWATER POTENTIAL ZONES USING REMOTE SENSING AND GEOGRA...IDENTIFICATION OF GROUNDWATER POTENTIAL ZONES USING REMOTE SENSING AND GEOGRA...
IDENTIFICATION OF GROUNDWATER POTENTIAL ZONES USING REMOTE SENSING AND GEOGRA...IAEME Publication
 
Hydrological Risk Assessment at Praia, Cape Verde
Hydrological Risk Assessment at Praia, Cape VerdeHydrological Risk Assessment at Praia, Cape Verde
Hydrological Risk Assessment at Praia, Cape VerdeIJEAB
 

What's hot (18)

Forecasting Model of Flood Inundated Areas along Sharda River in U.P.
Forecasting Model of Flood Inundated Areas along Sharda River in U.P.Forecasting Model of Flood Inundated Areas along Sharda River in U.P.
Forecasting Model of Flood Inundated Areas along Sharda River in U.P.
 
IRJET- Flood Susceptibility Assessment through GIS-Based Multi-Criteria Appro...
IRJET- Flood Susceptibility Assessment through GIS-Based Multi-Criteria Appro...IRJET- Flood Susceptibility Assessment through GIS-Based Multi-Criteria Appro...
IRJET- Flood Susceptibility Assessment through GIS-Based Multi-Criteria Appro...
 
Role of RS & GIS; gis in disaster management prepared by er. bishnu khatri
Role of RS & GIS; gis in disaster management prepared by er. bishnu khatriRole of RS & GIS; gis in disaster management prepared by er. bishnu khatri
Role of RS & GIS; gis in disaster management prepared by er. bishnu khatri
 
Role of Geologists in Natural Hazard Mapping and Application_Dr Kyi Khin_MGSS...
Role of Geologists in Natural Hazard Mapping and Application_Dr Kyi Khin_MGSS...Role of Geologists in Natural Hazard Mapping and Application_Dr Kyi Khin_MGSS...
Role of Geologists in Natural Hazard Mapping and Application_Dr Kyi Khin_MGSS...
 
ÖNCEL AKADEMİ: İSTANBUL DEPREMİ
ÖNCEL AKADEMİ: İSTANBUL DEPREMİÖNCEL AKADEMİ: İSTANBUL DEPREMİ
ÖNCEL AKADEMİ: İSTANBUL DEPREMİ
 
Analysis of runoff for vishwamitri river watershed using scs cn method and ge...
Analysis of runoff for vishwamitri river watershed using scs cn method and ge...Analysis of runoff for vishwamitri river watershed using scs cn method and ge...
Analysis of runoff for vishwamitri river watershed using scs cn method and ge...
 
Dissertation Defense Powerpoint FINAL
Dissertation Defense Powerpoint FINALDissertation Defense Powerpoint FINAL
Dissertation Defense Powerpoint FINAL
 
DEM-based Methods for Flood Risk Mapping at Large Scale
DEM-based Methods for Flood Risk Mapping at Large ScaleDEM-based Methods for Flood Risk Mapping at Large Scale
DEM-based Methods for Flood Risk Mapping at Large Scale
 
IRJET- Estimation of Surface Runoff using Curve Number Method- A Geospatial A...
IRJET- Estimation of Surface Runoff using Curve Number Method- A Geospatial A...IRJET- Estimation of Surface Runoff using Curve Number Method- A Geospatial A...
IRJET- Estimation of Surface Runoff using Curve Number Method- A Geospatial A...
 
Sea level rise and storm surge tools and datasets supporting Municipal Resili...
Sea level rise and storm surge tools and datasets supporting Municipal Resili...Sea level rise and storm surge tools and datasets supporting Municipal Resili...
Sea level rise and storm surge tools and datasets supporting Municipal Resili...
 
Application of remote sensing and gis for groundwater
Application of remote sensing and gis for groundwaterApplication of remote sensing and gis for groundwater
Application of remote sensing and gis for groundwater
 
urpl969-group2-paper-03May06
urpl969-group2-paper-03May06urpl969-group2-paper-03May06
urpl969-group2-paper-03May06
 
Toronto Overland Flow & Basement Flooding – ArcScene 3D Visualization of Fluv...
Toronto Overland Flow & Basement Flooding – ArcScene 3D Visualization of Fluv...Toronto Overland Flow & Basement Flooding – ArcScene 3D Visualization of Fluv...
Toronto Overland Flow & Basement Flooding – ArcScene 3D Visualization of Fluv...
 
AlfredoConetta_EGM712_GIS_Project
AlfredoConetta_EGM712_GIS_ProjectAlfredoConetta_EGM712_GIS_Project
AlfredoConetta_EGM712_GIS_Project
 
Estimation of morphometric parameters and
Estimation of morphometric parameters andEstimation of morphometric parameters and
Estimation of morphometric parameters and
 
IDENTIFICATION OF GROUNDWATER POTENTIAL ZONES USING REMOTE SENSING AND GEOGRA...
IDENTIFICATION OF GROUNDWATER POTENTIAL ZONES USING REMOTE SENSING AND GEOGRA...IDENTIFICATION OF GROUNDWATER POTENTIAL ZONES USING REMOTE SENSING AND GEOGRA...
IDENTIFICATION OF GROUNDWATER POTENTIAL ZONES USING REMOTE SENSING AND GEOGRA...
 
Applications of remote sensing and modelling in flood risk analysis and irrig...
Applications of remote sensing and modelling in flood risk analysis and irrig...Applications of remote sensing and modelling in flood risk analysis and irrig...
Applications of remote sensing and modelling in flood risk analysis and irrig...
 
Hydrological Risk Assessment at Praia, Cape Verde
Hydrological Risk Assessment at Praia, Cape VerdeHydrological Risk Assessment at Praia, Cape Verde
Hydrological Risk Assessment at Praia, Cape Verde
 

Similar to Santillan assessing the-impacts_of_flooding_caused_by_extreme_rainfall_events_through_a_combined_geospatial_a

5. Flood-risk assessment in urban environment by
5. Flood-risk assessment in urban environment by5. Flood-risk assessment in urban environment by
5. Flood-risk assessment in urban environment byDr. Ravinder Jangra
 
GIS and Sensor Based Monitoring and Prediction of Landslides with Landslide M...
GIS and Sensor Based Monitoring and Prediction of Landslides with Landslide M...GIS and Sensor Based Monitoring and Prediction of Landslides with Landslide M...
GIS and Sensor Based Monitoring and Prediction of Landslides with Landslide M...iosrjce
 
Floodplain Modelling Materials and Methodology
Floodplain Modelling Materials and MethodologyFloodplain Modelling Materials and Methodology
Floodplain Modelling Materials and MethodologyIDES Editor
 
Basics of Disater And its Management.pdf
Basics of Disater And its Management.pdfBasics of Disater And its Management.pdf
Basics of Disater And its Management.pdfRanjitZende2
 
Abstract Shuvra
Abstract ShuvraAbstract Shuvra
Abstract Shuvra065msw418
 
Natural Hazards & ROLE of satellite remote sensing
Natural Hazards & ROLE of satellite remote sensingNatural Hazards & ROLE of satellite remote sensing
Natural Hazards & ROLE of satellite remote sensingABU UMEER BANBHAN
 
Disaster management using Remote sensing and GIS
Disaster management using Remote sensing and GISDisaster management using Remote sensing and GIS
Disaster management using Remote sensing and GISHarsh Singh
 
2021_Article_.pdf
2021_Article_.pdf2021_Article_.pdf
2021_Article_.pdfgautam3392
 
Flood Inundation Mapping(FIM) and Climate Change Impacts(CCI) using Simulatio...
Flood Inundation Mapping(FIM) and Climate Change Impacts(CCI) using Simulatio...Flood Inundation Mapping(FIM) and Climate Change Impacts(CCI) using Simulatio...
Flood Inundation Mapping(FIM) and Climate Change Impacts(CCI) using Simulatio...IRJET Journal
 
Application Of Deep Learning On UAV-Based Aerial Images For Flood Detection
Application Of Deep Learning On UAV-Based Aerial Images For Flood DetectionApplication Of Deep Learning On UAV-Based Aerial Images For Flood Detection
Application Of Deep Learning On UAV-Based Aerial Images For Flood DetectionTodd Turner
 
IRJET- Preparation of Flood Model and Hazard Estimation on Yamuna River (...
IRJET-  	  Preparation of Flood Model and Hazard Estimation on Yamuna River (...IRJET-  	  Preparation of Flood Model and Hazard Estimation on Yamuna River (...
IRJET- Preparation of Flood Model and Hazard Estimation on Yamuna River (...IRJET Journal
 
A Survey on Landslide Susceptibility Mapping Using Soft Computing Techniques
A Survey on Landslide Susceptibility Mapping Using Soft Computing TechniquesA Survey on Landslide Susceptibility Mapping Using Soft Computing Techniques
A Survey on Landslide Susceptibility Mapping Using Soft Computing Techniquesiosrjce
 
Inundation and Hazard Mapping on River Asa, using GIS
Inundation and Hazard Mapping on River Asa, using GISInundation and Hazard Mapping on River Asa, using GIS
Inundation and Hazard Mapping on River Asa, using GISOyeniyi Samuel
 
Gis and remote sensing tools to analyze landslides
Gis and remote sensing tools to analyze landslidesGis and remote sensing tools to analyze landslides
Gis and remote sensing tools to analyze landslideslkant1983
 
DEM-based Methods for Flood Risk Mapping at Large Scale
DEM-based Methods for Flood Risk Mapping at Large ScaleDEM-based Methods for Flood Risk Mapping at Large Scale
DEM-based Methods for Flood Risk Mapping at Large ScaleSalvatore Manfreda
 
URBAN FLOOD SUSCEPTIBILITY MAP OF CHENNAI - GIS AND RANDOM FOREST METHOD
URBAN FLOOD SUSCEPTIBILITY MAP OF CHENNAI - GIS AND RANDOM FOREST METHODURBAN FLOOD SUSCEPTIBILITY MAP OF CHENNAI - GIS AND RANDOM FOREST METHOD
URBAN FLOOD SUSCEPTIBILITY MAP OF CHENNAI - GIS AND RANDOM FOREST METHODIRJET Journal
 
Presentation of Academic Writting .pdf
Presentation of Academic Writting .pdfPresentation of Academic Writting .pdf
Presentation of Academic Writting .pdfAbdulmuqtadetrAhmadi
 
Application of GIS and Remote Sensing in Flood Risk Management
Application of GIS and Remote Sensing in Flood Risk ManagementApplication of GIS and Remote Sensing in Flood Risk Management
Application of GIS and Remote Sensing in Flood Risk ManagementAmitSaha123
 

Similar to Santillan assessing the-impacts_of_flooding_caused_by_extreme_rainfall_events_through_a_combined_geospatial_a (20)

5. Flood-risk assessment in urban environment by
5. Flood-risk assessment in urban environment by5. Flood-risk assessment in urban environment by
5. Flood-risk assessment in urban environment by
 
PROJECT AND THESIS slide.pptx
PROJECT AND THESIS slide.pptxPROJECT AND THESIS slide.pptx
PROJECT AND THESIS slide.pptx
 
GIS and Sensor Based Monitoring and Prediction of Landslides with Landslide M...
GIS and Sensor Based Monitoring and Prediction of Landslides with Landslide M...GIS and Sensor Based Monitoring and Prediction of Landslides with Landslide M...
GIS and Sensor Based Monitoring and Prediction of Landslides with Landslide M...
 
Floodplain Modelling Materials and Methodology
Floodplain Modelling Materials and MethodologyFloodplain Modelling Materials and Methodology
Floodplain Modelling Materials and Methodology
 
Basics of Disater And its Management.pdf
Basics of Disater And its Management.pdfBasics of Disater And its Management.pdf
Basics of Disater And its Management.pdf
 
Abstract Shuvra
Abstract ShuvraAbstract Shuvra
Abstract Shuvra
 
D43011925
D43011925D43011925
D43011925
 
Natural Hazards & ROLE of satellite remote sensing
Natural Hazards & ROLE of satellite remote sensingNatural Hazards & ROLE of satellite remote sensing
Natural Hazards & ROLE of satellite remote sensing
 
Disaster management using Remote sensing and GIS
Disaster management using Remote sensing and GISDisaster management using Remote sensing and GIS
Disaster management using Remote sensing and GIS
 
2021_Article_.pdf
2021_Article_.pdf2021_Article_.pdf
2021_Article_.pdf
 
Flood Inundation Mapping(FIM) and Climate Change Impacts(CCI) using Simulatio...
Flood Inundation Mapping(FIM) and Climate Change Impacts(CCI) using Simulatio...Flood Inundation Mapping(FIM) and Climate Change Impacts(CCI) using Simulatio...
Flood Inundation Mapping(FIM) and Climate Change Impacts(CCI) using Simulatio...
 
Application Of Deep Learning On UAV-Based Aerial Images For Flood Detection
Application Of Deep Learning On UAV-Based Aerial Images For Flood DetectionApplication Of Deep Learning On UAV-Based Aerial Images For Flood Detection
Application Of Deep Learning On UAV-Based Aerial Images For Flood Detection
 
IRJET- Preparation of Flood Model and Hazard Estimation on Yamuna River (...
IRJET-  	  Preparation of Flood Model and Hazard Estimation on Yamuna River (...IRJET-  	  Preparation of Flood Model and Hazard Estimation on Yamuna River (...
IRJET- Preparation of Flood Model and Hazard Estimation on Yamuna River (...
 
A Survey on Landslide Susceptibility Mapping Using Soft Computing Techniques
A Survey on Landslide Susceptibility Mapping Using Soft Computing TechniquesA Survey on Landslide Susceptibility Mapping Using Soft Computing Techniques
A Survey on Landslide Susceptibility Mapping Using Soft Computing Techniques
 
Inundation and Hazard Mapping on River Asa, using GIS
Inundation and Hazard Mapping on River Asa, using GISInundation and Hazard Mapping on River Asa, using GIS
Inundation and Hazard Mapping on River Asa, using GIS
 
Gis and remote sensing tools to analyze landslides
Gis and remote sensing tools to analyze landslidesGis and remote sensing tools to analyze landslides
Gis and remote sensing tools to analyze landslides
 
DEM-based Methods for Flood Risk Mapping at Large Scale
DEM-based Methods for Flood Risk Mapping at Large ScaleDEM-based Methods for Flood Risk Mapping at Large Scale
DEM-based Methods for Flood Risk Mapping at Large Scale
 
URBAN FLOOD SUSCEPTIBILITY MAP OF CHENNAI - GIS AND RANDOM FOREST METHOD
URBAN FLOOD SUSCEPTIBILITY MAP OF CHENNAI - GIS AND RANDOM FOREST METHODURBAN FLOOD SUSCEPTIBILITY MAP OF CHENNAI - GIS AND RANDOM FOREST METHOD
URBAN FLOOD SUSCEPTIBILITY MAP OF CHENNAI - GIS AND RANDOM FOREST METHOD
 
Presentation of Academic Writting .pdf
Presentation of Academic Writting .pdfPresentation of Academic Writting .pdf
Presentation of Academic Writting .pdf
 
Application of GIS and Remote Sensing in Flood Risk Management
Application of GIS and Remote Sensing in Flood Risk ManagementApplication of GIS and Remote Sensing in Flood Risk Management
Application of GIS and Remote Sensing in Flood Risk Management
 

Recently uploaded

GDSC ASEB Gen AI study jams presentation
GDSC ASEB Gen AI study jams presentationGDSC ASEB Gen AI study jams presentation
GDSC ASEB Gen AI study jams presentationGDSCAESB
 
Past, Present and Future of Generative AI
Past, Present and Future of Generative AIPast, Present and Future of Generative AI
Past, Present and Future of Generative AIabhishek36461
 
Gurgaon ✡️9711147426✨Call In girls Gurgaon Sector 51 escort service
Gurgaon ✡️9711147426✨Call In girls Gurgaon Sector 51 escort serviceGurgaon ✡️9711147426✨Call In girls Gurgaon Sector 51 escort service
Gurgaon ✡️9711147426✨Call In girls Gurgaon Sector 51 escort servicejennyeacort
 
(MEERA) Dapodi Call Girls Just Call 7001035870 [ Cash on Delivery ] Pune Escorts
(MEERA) Dapodi Call Girls Just Call 7001035870 [ Cash on Delivery ] Pune Escorts(MEERA) Dapodi Call Girls Just Call 7001035870 [ Cash on Delivery ] Pune Escorts
(MEERA) Dapodi Call Girls Just Call 7001035870 [ Cash on Delivery ] Pune Escortsranjana rawat
 
Call Girls Narol 7397865700 Independent Call Girls
Call Girls Narol 7397865700 Independent Call GirlsCall Girls Narol 7397865700 Independent Call Girls
Call Girls Narol 7397865700 Independent Call Girlsssuser7cb4ff
 
High Profile Call Girls Nagpur Meera Call 7001035870 Meet With Nagpur Escorts
High Profile Call Girls Nagpur Meera Call 7001035870 Meet With Nagpur EscortsHigh Profile Call Girls Nagpur Meera Call 7001035870 Meet With Nagpur Escorts
High Profile Call Girls Nagpur Meera Call 7001035870 Meet With Nagpur EscortsCall Girls in Nagpur High Profile
 
APPLICATIONS-AC/DC DRIVES-OPERATING CHARACTERISTICS
APPLICATIONS-AC/DC DRIVES-OPERATING CHARACTERISTICSAPPLICATIONS-AC/DC DRIVES-OPERATING CHARACTERISTICS
APPLICATIONS-AC/DC DRIVES-OPERATING CHARACTERISTICSKurinjimalarL3
 
Gfe Mayur Vihar Call Girls Service WhatsApp -> 9999965857 Available 24x7 ^ De...
Gfe Mayur Vihar Call Girls Service WhatsApp -> 9999965857 Available 24x7 ^ De...Gfe Mayur Vihar Call Girls Service WhatsApp -> 9999965857 Available 24x7 ^ De...
Gfe Mayur Vihar Call Girls Service WhatsApp -> 9999965857 Available 24x7 ^ De...srsj9000
 
Application of Residue Theorem to evaluate real integrations.pptx
Application of Residue Theorem to evaluate real integrations.pptxApplication of Residue Theorem to evaluate real integrations.pptx
Application of Residue Theorem to evaluate real integrations.pptx959SahilShah
 
microprocessor 8085 and its interfacing
microprocessor 8085  and its interfacingmicroprocessor 8085  and its interfacing
microprocessor 8085 and its interfacingjaychoudhary37
 
High Profile Call Girls Nagpur Isha Call 7001035870 Meet With Nagpur Escorts
High Profile Call Girls Nagpur Isha Call 7001035870 Meet With Nagpur EscortsHigh Profile Call Girls Nagpur Isha Call 7001035870 Meet With Nagpur Escorts
High Profile Call Girls Nagpur Isha Call 7001035870 Meet With Nagpur Escortsranjana rawat
 
College Call Girls Nashik Nehal 7001305949 Independent Escort Service Nashik
College Call Girls Nashik Nehal 7001305949 Independent Escort Service NashikCollege Call Girls Nashik Nehal 7001305949 Independent Escort Service Nashik
College Call Girls Nashik Nehal 7001305949 Independent Escort Service NashikCall Girls in Nagpur High Profile
 
Architect Hassan Khalil Portfolio for 2024
Architect Hassan Khalil Portfolio for 2024Architect Hassan Khalil Portfolio for 2024
Architect Hassan Khalil Portfolio for 2024hassan khalil
 
VIP Call Girls Service Hitech City Hyderabad Call +91-8250192130
VIP Call Girls Service Hitech City Hyderabad Call +91-8250192130VIP Call Girls Service Hitech City Hyderabad Call +91-8250192130
VIP Call Girls Service Hitech City Hyderabad Call +91-8250192130Suhani Kapoor
 
Internship report on mechanical engineering
Internship report on mechanical engineeringInternship report on mechanical engineering
Internship report on mechanical engineeringmalavadedarshan25
 
SPICE PARK APR2024 ( 6,793 SPICE Models )
SPICE PARK APR2024 ( 6,793 SPICE Models )SPICE PARK APR2024 ( 6,793 SPICE Models )
SPICE PARK APR2024 ( 6,793 SPICE Models )Tsuyoshi Horigome
 
Introduction to Microprocesso programming and interfacing.pptx
Introduction to Microprocesso programming and interfacing.pptxIntroduction to Microprocesso programming and interfacing.pptx
Introduction to Microprocesso programming and interfacing.pptxvipinkmenon1
 

Recently uploaded (20)

GDSC ASEB Gen AI study jams presentation
GDSC ASEB Gen AI study jams presentationGDSC ASEB Gen AI study jams presentation
GDSC ASEB Gen AI study jams presentation
 
Past, Present and Future of Generative AI
Past, Present and Future of Generative AIPast, Present and Future of Generative AI
Past, Present and Future of Generative AI
 
Gurgaon ✡️9711147426✨Call In girls Gurgaon Sector 51 escort service
Gurgaon ✡️9711147426✨Call In girls Gurgaon Sector 51 escort serviceGurgaon ✡️9711147426✨Call In girls Gurgaon Sector 51 escort service
Gurgaon ✡️9711147426✨Call In girls Gurgaon Sector 51 escort service
 
(MEERA) Dapodi Call Girls Just Call 7001035870 [ Cash on Delivery ] Pune Escorts
(MEERA) Dapodi Call Girls Just Call 7001035870 [ Cash on Delivery ] Pune Escorts(MEERA) Dapodi Call Girls Just Call 7001035870 [ Cash on Delivery ] Pune Escorts
(MEERA) Dapodi Call Girls Just Call 7001035870 [ Cash on Delivery ] Pune Escorts
 
Call Girls Narol 7397865700 Independent Call Girls
Call Girls Narol 7397865700 Independent Call GirlsCall Girls Narol 7397865700 Independent Call Girls
Call Girls Narol 7397865700 Independent Call Girls
 
9953056974 Call Girls In South Ex, Escorts (Delhi) NCR.pdf
9953056974 Call Girls In South Ex, Escorts (Delhi) NCR.pdf9953056974 Call Girls In South Ex, Escorts (Delhi) NCR.pdf
9953056974 Call Girls In South Ex, Escorts (Delhi) NCR.pdf
 
Call Us -/9953056974- Call Girls In Vikaspuri-/- Delhi NCR
Call Us -/9953056974- Call Girls In Vikaspuri-/- Delhi NCRCall Us -/9953056974- Call Girls In Vikaspuri-/- Delhi NCR
Call Us -/9953056974- Call Girls In Vikaspuri-/- Delhi NCR
 
High Profile Call Girls Nagpur Meera Call 7001035870 Meet With Nagpur Escorts
High Profile Call Girls Nagpur Meera Call 7001035870 Meet With Nagpur EscortsHigh Profile Call Girls Nagpur Meera Call 7001035870 Meet With Nagpur Escorts
High Profile Call Girls Nagpur Meera Call 7001035870 Meet With Nagpur Escorts
 
APPLICATIONS-AC/DC DRIVES-OPERATING CHARACTERISTICS
APPLICATIONS-AC/DC DRIVES-OPERATING CHARACTERISTICSAPPLICATIONS-AC/DC DRIVES-OPERATING CHARACTERISTICS
APPLICATIONS-AC/DC DRIVES-OPERATING CHARACTERISTICS
 
Gfe Mayur Vihar Call Girls Service WhatsApp -> 9999965857 Available 24x7 ^ De...
Gfe Mayur Vihar Call Girls Service WhatsApp -> 9999965857 Available 24x7 ^ De...Gfe Mayur Vihar Call Girls Service WhatsApp -> 9999965857 Available 24x7 ^ De...
Gfe Mayur Vihar Call Girls Service WhatsApp -> 9999965857 Available 24x7 ^ De...
 
Application of Residue Theorem to evaluate real integrations.pptx
Application of Residue Theorem to evaluate real integrations.pptxApplication of Residue Theorem to evaluate real integrations.pptx
Application of Residue Theorem to evaluate real integrations.pptx
 
microprocessor 8085 and its interfacing
microprocessor 8085  and its interfacingmicroprocessor 8085  and its interfacing
microprocessor 8085 and its interfacing
 
High Profile Call Girls Nagpur Isha Call 7001035870 Meet With Nagpur Escorts
High Profile Call Girls Nagpur Isha Call 7001035870 Meet With Nagpur EscortsHigh Profile Call Girls Nagpur Isha Call 7001035870 Meet With Nagpur Escorts
High Profile Call Girls Nagpur Isha Call 7001035870 Meet With Nagpur Escorts
 
College Call Girls Nashik Nehal 7001305949 Independent Escort Service Nashik
College Call Girls Nashik Nehal 7001305949 Independent Escort Service NashikCollege Call Girls Nashik Nehal 7001305949 Independent Escort Service Nashik
College Call Girls Nashik Nehal 7001305949 Independent Escort Service Nashik
 
Architect Hassan Khalil Portfolio for 2024
Architect Hassan Khalil Portfolio for 2024Architect Hassan Khalil Portfolio for 2024
Architect Hassan Khalil Portfolio for 2024
 
VIP Call Girls Service Hitech City Hyderabad Call +91-8250192130
VIP Call Girls Service Hitech City Hyderabad Call +91-8250192130VIP Call Girls Service Hitech City Hyderabad Call +91-8250192130
VIP Call Girls Service Hitech City Hyderabad Call +91-8250192130
 
Internship report on mechanical engineering
Internship report on mechanical engineeringInternship report on mechanical engineering
Internship report on mechanical engineering
 
SPICE PARK APR2024 ( 6,793 SPICE Models )
SPICE PARK APR2024 ( 6,793 SPICE Models )SPICE PARK APR2024 ( 6,793 SPICE Models )
SPICE PARK APR2024 ( 6,793 SPICE Models )
 
Introduction to Microprocesso programming and interfacing.pptx
Introduction to Microprocesso programming and interfacing.pptxIntroduction to Microprocesso programming and interfacing.pptx
Introduction to Microprocesso programming and interfacing.pptx
 
🔝9953056974🔝!!-YOUNG call girls in Rajendra Nagar Escort rvice Shot 2000 nigh...
🔝9953056974🔝!!-YOUNG call girls in Rajendra Nagar Escort rvice Shot 2000 nigh...🔝9953056974🔝!!-YOUNG call girls in Rajendra Nagar Escort rvice Shot 2000 nigh...
🔝9953056974🔝!!-YOUNG call girls in Rajendra Nagar Escort rvice Shot 2000 nigh...
 

Santillan assessing the-impacts_of_flooding_caused_by_extreme_rainfall_events_through_a_combined_geospatial_a

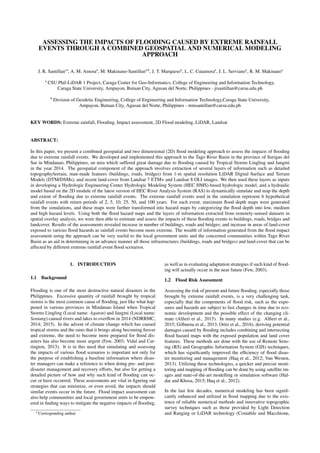
  • 1. ASSESSING THE IMPACTS OF FLOODING CAUSED BY EXTREME RAINFALL EVENTS THROUGH A COMBINED GEOSPATIAL AND NUMERICAL MODELING APPROACH J. R. Santillana∗ , A. M. Amoraa , M. Makinano-Santillana,b , J. T. Marquesoa , L. C. Cutamoraa , J. L. Servianoa , R. M. Makinanoa a CSU Phil-LiDAR 1 Project, Caraga Center for Geo-Informatics, College of Engineering and Information Technology, Caraga State University, Ampayon, Butuan City, Agusan del Norte, Philippines - jrsantillan@carsu.edu.ph b Division of Geodetic Engineering, College of Engineering and Information Technology,Caraga State University, Ampayon, Butuan City, Agusan del Norte, Philippines - mmsantillan@carsu.edu.ph KEY WORDS: Extreme rainfall, Flooding, Impact assessment, 2D Flood modeling, LiDAR, Landsat ABSTRACT: In this paper, we present a combined geospatial and two dimensional (2D) flood modeling approach to assess the impacts of flooding due to extreme rainfall events. We developed and implemented this approach to the Tago River Basin in the province of Surigao del Sur in Mindanao, Philippines, an area which suffered great damage due to flooding caused by Tropical Storms Lingling and Jangmi in the year 2014. The geospatial component of the approach involves extraction of several layers of information such as detailed topography/terrain, man-made features (buildings, roads, bridges) from 1-m spatial resolution LiDAR Digital Surface and Terrain Models (DTM/DSMs), and recent land-cover from Landsat 7 ETM+ and Landsat 8 OLI images. We then used these layers as inputs in developing a Hydrologic Engineering Center Hydrologic Modeling System (HEC HMS)-based hydrologic model, and a hydraulic model based on the 2D module of the latest version of HEC River Analysis System (RAS) to dynamically simulate and map the depth and extent of flooding due to extreme rainfall events. The extreme rainfall events used in the simulation represent 6 hypothetical rainfall events with return periods of 2, 5, 10, 25, 50, and 100 years. For each event, maximum flood depth maps were generated from the simulations, and these maps were further transformed into hazard maps by categorizing the flood depth into low, medium and high hazard levels. Using both the flood hazard maps and the layers of information extracted from remotely-sensed datasets in spatial overlay analysis, we were then able to estimate and assess the impacts of these flooding events to buildings, roads, bridges and landcover. Results of the assessments revealed increase in number of buildings, roads and bridges; and increase in areas of land-cover exposed to various flood hazards as rainfall events become more extreme. The wealth of information generated from the flood impact assessment using the approach can be very useful to the local government units and the concerned communities within Tago River Basin as an aid in determining in an advance manner all those infrastructures (buildings, roads and bridges) and land-cover that can be affected by different extreme rainfall event flood scenarios. 1. INTRODUCTION 1.1 Background Flooding is one of the most destructive natural disasters in the Philippines. Excessive quantity of rainfall brought by tropical storms is the most common cause of flooding, just like what hap- pened in various provinces in Mindanao Island when Tropical Storms Lingling (Local name: Agaton) and Jangmi (Local name: Seniang) caused rivers and lakes to overflow in 2014 (NDRRMC, 2014; 2015). In the advent of climate change which has caused tropical storms and the rains that it brings along becoming fiercer and extreme, the need to become more prepared for flood dis- asters has also become more urgent (Few, 2003; Vidal and Car- rington, 2013). It is in this need that simulating and assessing the impacts of various flood scenarios is important not only for the purpose of establishing a baseline information where disas- ter managers can make a reference to when doing pre- and post- disaster management and recovery efforts, but also for getting a detailed picture of how and why such kind of flooding can oc- cur or have occurred. These assessments are vital in figuring out strategies that can minimize, or even avoid, the impacts should similar events occur in the future. Flood impact assessment can also help communities and local government units to be empow- ered in finding ways to mitigate the negative impacts of flooding, ∗Corresponding author as well as in evaluating adaptation strategies if such kind of flood- ing will actually occur in the near future (Few, 2003). 1.2 Flood Risk Assessment Assessing the risk of present and future flooding, especially those brought by extreme rainfall events, is a very challenging task, especially that the components of flood risk, such as the expo- sures and hazards are subject to fast changes in time due to eco- nomic development and the possible effect of the changing cli- mate (Alfieri et al., 2015). In many studies (e.g. Alfieri et al., 2015; Gilbuena et al., 2013; Ortiz et al., 2016), deriving potential damages caused by flooding includes combining and intersecting flood hazard maps with the exposed population and land cover features. These methods are done with the use of Remote Sens- ing (RS) and Geographic Information System (GIS) techniques, which has significantly improved the efficiency of flood disas- ter monitoring and management (Haq et al., 2012; Van Westen, 2013). Utilizing these technologies, a quicker and precise moni- toring and mapping of flooding can be done by using satellite im- ages and state-of-the-art modelling or simulation software (Hal- dar and Khosa, 2015; Haq et al., 2012). In the last few decades, numerical modeling has been signifi- cantly enhanced and utilized in flood mapping due to the exis- tence of reliable numerical methods and innovative topographic survey techniques such as those provided by Light Detection and Ranging or LiDAR technology (Costabile and Macchione,
  • 2. 2015). Typically, flood mapping through numerical simulations comprises two components known as the hydrological simulation which quantifies the size, duration and probability of the flood event; and the hydraulic simulation which employs the mapping of inundated areas (Dimitriadis, et al., 2016). Flood mapping can be done in either 1-dimensional (1D) or 2-dimensional (2D) ap- proach, but despite the efficiency if 1D flood modeling approach, it has been progressively encouraged recently the use of 2D flood simulation, since it can give detailed description of the hydraulic behaviour of the river’s flow dynamics (Costabile and Macchione, 2015). 1.3 The case of Tago River Basin in Mindanao, Philippines Tago River Basin (Figure 1) is located in the province of Surigao del Sur in the island of Mindanao, Philippines. It is geograph- ically facing the Pacific region wherein typhoons usually come from. The basin’s large catchment area of approximately 1,444 km2 and a very wide floodplain traversed by a dense network of rivers and streams make it vulnerable to flooding. Flooding in the river basin due to overflowing of Tago River and its tributaries oc- curs almost every year, especially during the rainy seasons from the month of December to February. In 2014, the basin was one of the many areas greatly affected by flooding due to heavy to tor- rential rains brought about by the passing of tropical storms Aga- ton and Seniang (NDRRMC, 2014; 2015). These flood events affected not only the communities living in the flood plain but also the sources of income which include large cropland areas. A preliminary assessment of the impacts of Agaton and Seni- ang in the Tago River Basin has recently been conducted by Makinano-Santillan (2015). Using an integrated approach involv- ing the use of LiDAR datasets, land-cover from Landsat images, and one-dimensional (1D) flood models based on HEC HMS and HEC RAS, the study was able to estimate 52.57% and 22.29% of the buildings situated in the floodplains to have been flooded during the two flood events, respectively. Cropland areas were also found to be the most affected based on the model simula- tions and geospatial analysis. However, the results of the study was hindered by the low accuracy (70.30%) of the flood models to predict flood depth and extents which may have been caused by the limitations in the input data as well as in the 1D mod- elling approach used. The input data limitation was on the use of LiDAR Digital Terrain Model (DTM) without bathymetry data. Since the flood model did not account the actual river bed topog- raphy, the river flow dynamics were not fully characterized, and may have falsely predicted flood depth and extent. On the other hand, the low accuracy of the 1D hydraulic model (based on HEC RAS) maybe due to the model’s discretization of topography as cross sections rather than as a surface, including the subjectivity of cross-section location and orientation as well as its inability to simulate lateral diffusion of the flood wave (Samuels, 1990; Hunter et al., 2007). With 2D flood modeling, these fundamental constraints can be overcome (Hunter et al., 2007). 1.4 Objectives of the Study In this paper, we present a combined geospatial and numerical modeling approach to assess the impacts of flooding due extreme rainfall events by fully utilizing the benefits of high spatial res- olution topographic and feature information provided by LiDAR technology, land-cover information from Landsat images, and 2D flood models. Focusing on the Tago River Basin as our case study area, we apply this approach to estimate how hypothetical ex- treme rainfall events with return periods of 2, 5, 10, 25, 50 and 100-years can bring flooding, and how it can impact buildings, roads, bridges and land-cover. 2. METHODS AND MATERIALS 2.1 The Combined Geospatial and 2D-Numerical Modeling Approach Figure 2 summarizes the combined geospatial and numerical modeling approach as implemented in this study for flood impact assessment. The geospatial component of the approach involves extraction of exposure datasets from remotely-sensed high spatial resolu- tion elevation models and images. These exposure datasets are the man-made features (buildings, roads, bridges) and land-cover which are extracted through manual digitization and image clas- sification, respectively. The numerical modeling consisted of de- veloping the hydrologic model of the river basin which is then used to determine the volume and discharge of water entering the floodplains; and the 2D hydraulic model which simulates the flow of water entering on the rivers and on the floodplains as rain pours to the area. The development of the hydrologic and hydraulic models utilizes high spatial resolution elevation mod- els and were parameterized using the information extracted from the land-cover map. The models simulate flooding events by in- putting rainfall data which can either be actual or hypothetical rainfall events. 2D numerical modeling is very advantageous compared to 1D modeling especially when dealing with a complicated river sys- tem that has multiple streams with complex flows. 2D modeling also removes subjective techniques usually employed in develop- ing a 1D model, such as cross-section orientation. The 2D hydraulic model uses flow information computed by the hydrologic model to generate flood maps corresponding to hypo- thetical rainfall events with return periods of 2, 5, 10, 25, 50 and 100 years. The flood depth and extent generated are then catego- rized based on the different flood hazard levels. The categoriza- tion are low hazard for depths of less than 0.50 m, medium hazard for depths from 0.50 m to 1.50 m, and high hazard for depths of greater than 1.50 m. These maps are then utilized together with the extracted exposure datasets in the spatial overlay analysis to assess the various levels of impacts of flooding brought by 6 dif- ferent extreme rainfall events. 2.2 Exposure Dataset Extraction 2.2.1 Feature Extraction: One of the basic inputs for flood impact assessment is a hazard exposure dataset. The expo- sure datasets considered in this study are the man-made features (buildings, roads, bridges) and the land-cover within the flood- plains of Tago River Basin. The man-made exposure datasets were manually digitized from 1-m spatial resolution LiDAR- derived DTM and DSM acquired last 2014 by the University of the Philippines - Diliman Disaster Risk and Exposure Assessment for Mitigation (UP DREAM) Program. The extraction process was aided with the use of high-resolution satellite images from Google Earth. 2.2.2 Land-cover Map Derivation: The land-cover informa- tion of Tago River Basin was obtained though Maximum Likeli- hood (ML) classification of Landsat 8 OLI and Land 7 ETM+ satellite images which were downloaded from the USGS Earth Explorer (http://earthexplorer.usgs.gov/). More than one image was utilized for Tago River Basin image classification. This was done to supplement missing data in one image caused by the pres- ence of cloud-cover. The images used are the Landsat 8 OLI im- ages acquired last March 31 and June 3, 2014, and Landsat 7
  • 3. Figure 1: Map showing the location and coverage of Tago River Basin. Figure 2: A combined geospatial and 2D numerical modeling approach for flood impact assessment. ETM+ image acquired last August 8, 2012. These images un- derwent pre-processing including radiometric calibration which converts image pixel values to top-of-atmosphere (TOA) radi- ance; and atmospheric correction which corrects the pixel val- ues for atmosphere effects and to convert the TOA radiance to surface reflectance. NDVI and DEM were also incorporated to the Landsat surface reflectance bands as additional data sources for land-cover classification since it has been found to increase classification accuracy. NDVI and DEM can account for the rugged topography so as to eliminate the presence or absence of certain classes in some elevation zones, and reduces the im- pact of shadows and to enhance the separation among various land-cover classes (Watanachaturaporn et al., 2008). There were seven classes considered in the analysis: barren, built-up, crop- land, grassland, palm, forest, and water areas. The March 2014 image served as the main image for classification. The missing land-cover information due to the presence of cloud and cloud shadow in this image was supplemented using the land-cover maps derived from individual ML classification of the June 2014 and August 2012 images. After supplementing the missing data in the land-cover map, it was further subjected to contextual edit- ing to correct obvious misclassification through visual inspection. The accuracy of the finalized land-cover map was then assessed using a procedure suggested by Congalton and Green (2009). The procedure involves a random selection of at least 50 points (or validation pixels) for each land-cover class in the finalized land- cover map. The actual land-cover classes of these random points were then verified by overlaying them to high resolution satellite images available in Google Earth. The minimum of 50 points per class is considered a rule-of-thumb in assessing the accuracy of land-cover maps whose coverage is less than 1 million acres (approx. 40,469 km2 ) in size and with fewer than 12 land-cover classes (Congalton and Green, 1999). For Tago River Basin, the area covered is only 1,444 km2 . Hence, only 50 random points per class were selected. With 8 land-cover classes, there were a total of 400 random points. The comparisons between the ac- tual and classified land-cover classes for each random point were then summarized using a confusion or error matrix. From this matrix, the Overall Classification Accuracy, Producers Accuracy and Users Accuracy were then computed. The land-cover map was used to obtain land-cover statistics of the basin. It was also converted into runoff potential (or Curve Num- ber, CN) and Mannings roughness maps which are required pa- rameters in the development of the hydrologic and 2D hydraulic models. 2.3 Numerical Modeling and Flood Hazard Maps Genera- tion 2.3.1 Hydrologic Model Development and Calibration: The hydrologic model of Tago River Basin was developed using the Hydrologic Engineering Center Hydrologic Modeling Sys- tem (HEC HMS) Version 3.5, a software specifically designed to simulate the precipitation-runoff processes of watershed sys- tems (USACE, 2000). HEC HMS modeling is dependent on three components: the basin model, meteorological model, and a set of
  • 4. control specification indicating the time step and simulation pe- riod. The basin model, which is the physical representation of the watershed, was developed by utilizing a 10-m Synthetic Aperture Radar Digital Elevation Model (SAR DEM) and the rivers net- works in the delineation of watersheds; and was parameterized using the information from the land-cover map that was gener- ated earlier. The hydrologic model can simulate actual and historical rainfall events by using the rainfall data recorded by the Advanced Sci- ence and Technology Institute of the Department of Science and Technology (ASTI DOST) rain gauge located at Barangay Tina in the Municipality of San Miguel (Figure 1); and hypothetical rainfall events by using the Rainfall Intensity Duration Frequensy (RIDF) data from the Philippine Atmospheric, Geophysical and Astronomical Services Administration (PAGASA). RIDF curves provide information on the likelihood of rainfall events of various amounts and durations. For this study, we used RIDF of the Hi- natuan PAGASA Weather Station which is nearest to the basin. These extreme rainfall events are expressed as “return period”. For every rain return period, a 24-hour duration rainfall scenario was constructed in HEC HMS wherein the rain was set to peak at the sixth hour from the start of the simulation (see Figure 3 and Table 1). Prior to its use in simulating flow hydrographs due to extreme rainfall events, the parameters of the model were calibrated by relating the simulated flow hydrographs to the actual measured flow in the river. The station utilized during model calibration was Cabtik Bridge. Hydrological data necessary for calibration was gathered from this station last 12/16/2014 to 12/23/2014 with the use of water level and velocity data logging sensors together with the river cross-section data. In evaluating the model perfor- mance before and after calibration, three measures of accuracy were used. These are the Nash-Sutcliffe Coefficient of Model Efficiency (NSE), percentage bias (PBIAS), and the RMSE - ob- servations standard deviation ratio (RSR). These measures were computed by comparing the observed and the simulated hydro- graphs in accordance with existing evaluation guidelines for sys- tematic quantification of accuracy in hydrological simulations (Moriasi et al., 2007). 2.3.2 Hydraulic Model Development: The 2D hydraulic model of Tago River Basin was based on the Hydrologic En- gineering Center River Analysis System (HEC RAS) version 5.0, which is designed to perform one-dimensional (1D), two- dimensional (2D), or combined 1D and 2D hydraulic calculations for a full network of natural and constructed channels (USACE, 2016). For Tago River Basin, 2D modeling was performed with no 1D element present. The 2D HEC RAS model was developed by creating a 2D flow area (i.e., the 2D model domain) repre- senting the entire floodplain of the river basin. The 2D flow area mesh of Tago has an approximate area of 565.31 km2 and was computed using a 60-m by 60-m cell size. This cell size was cho- sen since Tago River Basin has a very large 2D area and setting it with a much smaller cell size would make run times of the simu- lations much longer. With the aid of break lines representing the roads, dikes, levees and river banks, the 2D flow area was finally computed to consist a total of 162,565 cells. The 1-m spatial res- olution LiDAR-derived DTM and the Manning’s roughness co- efficients extracted from the land-cover map were used as inputs in setting the model’s geometric data. The model consisted of 10 boundary conditions in which 8 are inflows from upstream rivers, 1 as the tidal boundary condition at the sea, and 1 boundary con- dition for the precipitation that falls to the 2D area 2.3.3 Flood Depth and Hazard Mapping: The flow hydro- graphs generated by the calibrated HEC HMS model were used as inputs into the HEC RAS 2D hydraulic model to predict or es- timate flood depths and extents. Each hydrograph represents the flow of water entering the 2D model domain, i.e., at the 8 inflow boundary condition locations. These flow hydrographs together with the time series of rainfall and tidal data were utilized by the unsteady flow analysis module of HEC RAS to dynamically simulate depth and extent of flooding. For each extreme rainfall event flood simulation, a spatially-distributed grid of maximum flood depths was generated. This depth grid was then exported as a raster file in the GIS software ArcGIS and converted into flood hazards by categorizing depths to its corresponding hazard levels (low: < 0.50 m depth, medium: 0.50 m - 1.50 m depth, and high: > 1.50 m depth). Before using the combined HEC HMS-HEC RAS 2D in generat- ing flood hazard maps, its accuracy was first determined. Using the 2 models, a flooding in the area that happened last January 2014 caused by tropical storm Agaton was reconstructed. The combined models utilized actual rainfall data recorded from the ASTI-DOST rainfall station at barangay Tina, San Miguel. The resulting flood map from this flooding reconstruction was then compared to the actual flooding information gathered in the field. Flood map validation surveys were conducted to gather this in- formation last February 2015. Pre-determined random locations within the floodplain of Tago River Basin were visited to deter- mine whether they were flooded or not during Agaton. The accu- racy computation includes the use of confusion matrix approach which was done by comparing the total number of correctly pre- dicted points over the total number of points collected; and the measure of fit known as F Measure which answers the question of whether the flood extent reflected in the map is the same on the ground (Aronica, et al., 2002; Horritt, 2006). The computa- tion was done using the formula: F = A A + B + C (1) where F = the measure of fit; A = the number of points cor- rectly predicted as “flooded’; B = the number of over-predicted points (“not flooded” in reality but predicted as “flooded”); and C = the number of under-predicted points (“flooded” in reality but predicted as “not flooded”). F = 1 means that the observed and predicted flooding extents coincide exactly, while F = 0 means that no overlap exists between predicted and observed flooding extents. Flooding extents generated by the model can be assessed either as Good Fit (F is greater than or equal to 0.7), Intermedi- ate Fit (F is from 0.5 to less than 0.7), or Bad Fit (F less than 0.5) (Breilh, et al., 2013). Duration Return Period (Years) 2 5 10 25 50 100 5 min 12.1 15.9 18.5 21.7 24.1 26.4 15 min 27.2 35.9 41.7 49.0 54.4 59.8 1 hr 61.8 82.8 96.6 114.2 127.2 140.1 2 hrs 85.8 116.9 137.5 163.5 182.8 202.0 3 hrs 103.8 141.9 167.2 199.1 222.8 246.3 6 hrs 132.7 190.6 228.9 277.3 313.2 348.8 12 hrs 164.3 230.6 274.4 329.8 370.9 411.7 24 hrs 201.0 276.5 326.5 389.7 436.6 483.1 Table 1: The extreme values (in mm) of precipitation of the 6 hypothetical rainfall events based on RIDF data of Hinatuan PA- GASA Weather Station. 2.4 Flood Impact Assessment The impacts of flooding were assessed through spatial overlay- ing of the exposure datasets (building, roads, bridges and land-
  • 5. Figure 3: 24-hour rainfall scenario for the 6 hypothetical extreme rainfall events. cover) with the generated flood hazard maps for the different rain- fall events using ArcGIS software. The flooding impact to land- cover classes was determined by computing the inundated areas for each class for all events. For buildings and roads, flooding impacts were assessed by categorizing every building and road according to hazard level (low, medium, high, or not flooded) depending on what hazard level they are intersected with. The impacts of flooding to bridges were assessed by comparing their elevation to the maximum elevation of flood water where there are located; this will determine whether a certain bridge will al- ready be un-passable if a flooding due to a particular extreme rainfall event will occur. 3. RESULTS AND DISCUSSION 3.1 Exposure Datasets 3.1.1 Buildings, Roads and Bridges: The digitized expo- sure datasets derived using the 1-m spatial resolution LiDAR- derived DSM of Tago River Basin floodplain areas totaled to 12,830 buildings, 228 roads and 69 bridges. These features were checked and validated using the high-resolution satellite images from Google Earth. 3.1.2 Land-cover: The land-cover map of Tago River Basin derived from the analysis of the Landsat satellite images is shown in Figure 4 with its statistics listed in Table 2. This land-cover map has an over-all classification accuracy of 92%, with the Pro- ducer’s and User’s Accuracies for all land-cover classes greater than 85%. It can be found that next to forest, cropland is the ma- jor land-cover in the river basin, occupying 11.65% of the basin‘s total land area. 3.2 Accuracy of the Hydrologic Model Figure 5 shows the results after the calibration of the Tago HEC HMS model. Based on Moriasi et al. (2007)’s evaluation guide- lines, the overall performance of the model was found to be very good, with an NSE = 0.98, PBIAS = -0.76, and RSR = 0.15. This means that the HEC HMS can be confidently used in simulating flow hydrographs for extreme rainfall event scenarios. Figure 4: The year 2014 land-cover map of Tago River Basin derived from Landsat images. Class Name Area, in km2 Barren Areas 51.14 Built-ups and Roads 4.39 Cropland 168.35 Forest 999.12 Grasses and Shrubs 146.43 Palm (Coconut and Banana) 55.30 Water Bodies 19.75 Total 1,444.49 Table 2: Area per land-cover class in Tago river basin Figure 5: Result of calibrating the Tago HEC HMS model using the measured flow data at Cabtik Bridge. 3.3 Flood Hazard Maps Generated using Combined HMS and RAS Models and Its Accuracy Example flow hydrographs simulated by the calibrated HEC HMS model at Cabtik Bridge station for the different extreme rainfall events are shown in Figure 6. It can be seen that as the rainfall return period increases (i.e., as rainfall becomes extreme), the peak flow rate in Cabtik Bridge also increases from approxi- mately 2,500 m3 /s for a 2-year return period to more than 8,000 m3 /s for a 100-year return period rainfall event. The generated flood hazard maps of Tago River Basin for the 6 extreme rainfall events are shown in Figure 7. It can be found that as the rainfall return period increases, the extent of flooding also increases. The accuracy of these flood hazard maps can be approximated using the results of the validation of the Agaton flood map gen-
  • 6. Figure 7: The generated flood hazard maps of Tago River Basin for the 6 rainfall return periods. Figure 6: 24-hour outflow hydrographs generated at Cabtik Bridge station for the 6 rain return periods. erated by the same models (Figure 8). Utilizing the flood in- formation gathered within Tago River Basin floodplain areas the reconstructed flooding extent during tropical storm Agaton was analyzed. The F Measure was calculated as 0.81, indicating that the flood map generated by the combined HEC HMS-HEC RAS 2D models is a good fit. The accuracy of the model, based on the result of the confusion matrix analysis (Table 3), is 83.33%, which leads us to an assumption that any flooding event the mod- els generates is approximately 83.33% accurate. Figure 8: Map showing the validation points in Tago River Basin overlaid in the generated Agaton flood hazard map. 3.4 Flood Impact Assessment The results of assessing the impacts of flooding to the buildings, roads, bridges and land-cover in Tago River Basin floodplain ar- eas are shown in Figure 9, Figure 10 Figure 11 and Figure 12, respectively. It was found that the area of inundated land-cover and the number of affected buildings, roads and bridges increase as the rainfall event return period increases. Among the land-cover classes, the
  • 7. Actual Flooding Scenario User’s Accuracy Flooded Not Flooded Total Flood Model Simulated Flooding Flooded 74 11 85 87.06% Not Flooded 6 11 17 64.71% Total 80 22 102 Producer’s Accuracy 92.50% 50.00% Sum of Diagonal Values 85 Overall Accuracy 83.33% (85/102) Table 3: Result of the flood map accuracy analysis in Tago River Basin for the Agaton event. cropland areas are the most affected with 66.27% and 90.70% in- undated for a 2-year and 100-year rainfall return periods, respec- tively. For the flooding impact assessment on the buildings expo- sure datasets, it can be noted that several structures are flooded even for just a 2-year rainfall return. A total of 6,662 out of 12,830 buildings or 51.93% will be flooded for a 2-year rain re- turn event that is having a 50% probability of occurrence every year. For the worst case scenario, a 100-year rain return event is expected to inundate 10,674 or 83.20% buildings, 204 or 89.47% roads, and 33 or 47.83% bridges. All of these results are assumed to be 83.33% accurate based on the result of the flood map vali- dation. Figure 9: Number of affected buildings for each of the 6 extreme rainfall events. Figure 10: Number of affected roads for each of the 6 extreme rainfall events. Figure 11: Number of flooded bridges for each of the 6 extreme rainfall events. Figure 12: Percentage of flooded land-cover class for each of the 6 extreme rainfall events. 4. CONCLUSION A detailed assessment of flooding was presented with the use of the combined geospatial and numerical modeling approach. This approach was found to be very useful in assessing flooding im- pacts of extreme rainfall events to the features at risk within the floodplains of Tago river basin. With the utilization of high spatial resolution digital elevation models, Landsat satellite images and flood models, detailed information on the possible affected build- ings, roads, bridges and land-cover was determined. The results of the assessments ashowed an increase in the number of build- ings and roads, and increase in areas of inundated land-cover as rainfall events become more extreme (i.e., increase in return peri- ods). The results of these assessments can be considered more re- liable than the assessment conducted earlier (Makinano-Santillan et al., 2015) due to higher accuracy of the flood maps generated in the present study. The wealth of information generated from the flood impact as- sessment using the approach can be very useful to the local gov- ernment units (LGUs) and the concerned communities within Tago River Basin as an aid in determining in an advance man- ner all those infrastructures (buildings, roads and bridges) and land-cover that can be affected by different extreme rainfall event flood scenarios. These assessments are very timely especially that rains brought by storms have become fiercer in recent years, and will continue to be so due to the effect of climate change. With the knowledge learned from the numerical model simula- tions and flood hazard mapping, LGUs and the communities in Tago River Basin can be informed and empowered in finding ways to mitigate the negative impacts of flooding, as well as in
  • 8. evaluating adaptation strategies if more intense events will occur in the near future. These adaptation strategies may include (i.) localized land-use planning integrating flood hazard information, (ii.) relocating communities to safe grounds, (iii.) identification and improvement of evacuation routes, and (iv.) building flood defences (specifically in areas where river overflowing occurs), among many others. ACKNOWLEDGEMENTS This work is an output of the Caraga State University (CSU) Phil- LiDAR 1 project under the Phil-LiDAR 1. Hazard Mapping of the Philippines using LiDAR program funded by the Department of Science and Technology (DOST). The SAR DEM and the Li- DAR DTM and DSM including the river bathymetric data used in this work were provided by the University of the Philippines Disaster Risk and Exposure for Mitigation (UP DREAM)/Phil- LIDAR 1 Program. We thank all CSU-Phil-LIDAR 1 technical staff and assistants, as well as the Local Government Units in the Tago River Basin for their assistance during the conduct of hy- drological measurements and flood map validation surveys. REFERENCES Alfieri, L., Feyen, L., Dottori F., Bianchi A., 2015. Ensemble flood risk assessment in Europe under high end climate scenarios. Global Environmental Change, 35, pp. 199-212. Aronica, G., Bates, P. D., and Horritt, M. S., 2002. Assessing the uncertainty in distributed model predictions using observed bi- nary pattern information within GLUE. Hydrological Processes, 16(10), pp. 2001-2016. Breilh, J. F., Chaumillon, E., Bertin, X., Gravelle, M., 2013. As- sessment of static flood modeling techniques: application to con- trasting marshes flooded during Xynthia (western France). Natu- ral Hazards and Earth System Science, 13(6), 1595-1612. Congalton, R.G., Green, K., 2009. Assessing the Accuracy of Remotely Sensed Data: Principles and Practices Second Edition, CRC Press/Taylor and Francis, Boca Raton, Florida, USA. Costabile P., Macchione F., 2015. Enhancing river model set-up for 2-D dynamic flood modelling. Environmental Modelling and Software, 67, pp. 89-107. Dimitriadis P., Tegos A., Oikonomou A., Pagana V., Koukouvi- nos A., Mamassis N., Koutsoyiannis D., Efstratiadis A., 2016. Comparative evaluation of 1D and quasi-2D hydraulic models based on benchmark and real-world applications for uncertainty assessment in flood mapping. Journal of Hydrology, 534, pp.478- 492. Few R., 2003. Flooding, vulnerability and coping strategies: lo- cal response to a global threat. Progress in Development Studies, 3(1), pp. 43-58. Gilbuena Jr. R., Kawamura A., Medina, R., Nakagawa, N., Amaguchi H., 2013. Environmental impact assessment using a utility-based recursive evidential reasoning approach for struc- tural flood mitigation measures in Metro Manila, Philippines. Journal of Environmental Management, 131, pp. 92-102. Haldar, R., Khosa R., 2015. Flood level mitigation study using 1-D hydrodynamic modeling. Aquatic Procedia, 4, pp. 925-932. Haq M., Akhtar M., Muhammed S., Paras S., Rahmatullah J., 2012. Techniques of remote sensing and GIS for flood moni- toring and damage assessment: A case study of Sindh province, Pakistan. The Egyptian Journal of Remote Sensing and Space Science, 15(2) , pp. 135-141. Horritt, M. S., 2006. A methodology for the validation of uncer- tain flood inundation models. Journal of Hydrology, 326, 153- 165. Hunter, N.M., Bates, P.D., Horrit, M.S., Wilson, M.D., 2007. Simple spatially-distributed models for predicting flood inunda- tion: A review. Geomorphology, 90, pp. 208-225. Makinano-Santillan, M., Santillan, J.R, Amora, A.M., Marqueso, J.T., Cutamota L.C., Serviano J.L., Oconer P.C.R., Makinano R.M., 2015. Assessing the impacts of flooding in Tago River Basin, Mindanao, Philippines through integration of high reso- lution elevation datasets, Landsat image analysis, and numerical modelling. In: 36th Asian Conference on Remote Sensing 2015 (ACRS 2015): Fostering Resilient Growth in Asia, Quezon City, Metro Manila, Philippines, Vol. 3, pp. 1606-1617. Moriasi, D.N., Arnold, J.G., Van Liew, M.W., Bingner, R.L., Harmel, R.D., Veith, T.L., 2007. Model evaluation guidelines for systematic quantification of accuracy in watershed simulations. Transactions of the ASABE, 50, pp. 885-900. NDRRMC, 2014. NDRRMC Updates Sitrep No. 33 re: Effects of Tropical Depression Agaton. National Disaster Risk Reduc- tion and Management Council. http://www.ndrrmc.gov.ph/ (01 February 2014). NDRRMC, 2015. NDRRMC Updates Sitrep No. 22 re: Effects of Tropical Storm Seniang. National Disaster Risk Reduction and Management Council. http://www.ndrrmc.gov.ph/ (22 Jan- uary 2015). Ortiz R., Ortiz P., Martin J. M., Vazquez, M. A., 2016. A new approach to the assessment of flooding and dampness hazards in cultural heritage, applied to the historic centre of Seville (Spain). Science of the Total Environment, 551-552, pp. 546-555. Samuels, P.G., 1990. Cross-section location in 1-D models. In: White, W.R., Watts, J. (Eds.), 2nd International Conference on River Flood Hydraulics, Wiley, Chichester, pp. 339350. USACE, 2000. Hydrologic Modeling System HEC-HMS Tech- nical Reference Manual, United States Army Corps of Engineers, Hydrologic Engineering Center, Davis, California, USA. USACE, 2016. HEC-RAS River Analysis System Hydraulic Ref- erence Manual, Institute for Water Resources Hydrologic Engi- neering Center, Davis, California, USA. Van Westen, C. J., 2014. Remote sensing and GIS for natural haz- ards assessment and disaster risk management. Reference Module in Earth Systems and Environmental Sciences, pp. 259-298. Vidal J., Carrington, D., 2013. Is climate change to blame for Typhoom Haiyan?.Guardian News and Media. http://www.theguardian .com/world/2013/nov/12/typhoon-haiyan-climate-change- blame-philippines.html (14 Januaryl 2016). Watanachaturaporn, P., Arora, M.K., Varshney, P.K., 2008. Mul- tisource classification using support vector machines: an empiri- cal comparison with decision tree and neural network classifiers. Photogrammetric Engineering and Remote Sensing, 74, pp. 239- 246.