
Recommended
More Related Content
Similar to Financial Forecasting: Pro Forma Marketing Budget & Income Statement for a Live Venue
Similar to Financial Forecasting: Pro Forma Marketing Budget & Income Statement for a Live Venue (20)
Recently uploaded
Recently uploaded (20)
Financial Forecasting: Pro Forma Marketing Budget & Income Statement for a Live Venue
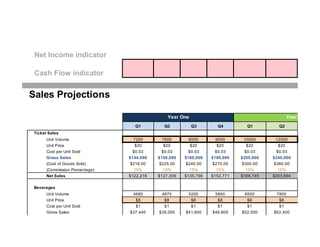
- 1. Net Income indicator Cash Flow indicator Q1 Q2 Q3 Q4 Q1 Q2 Unit Volume 7200 7500 8000 9000 10000 12000 Unit Price $20 $20 $20 $20 $20 $20 Cost per Unit Sold $0.03 $0.03 $0.03 $0.03 $0.03 $0.03 Gross Sales $144,000 $150,000 $160,000 $180,000 $200,000 $240,000 (Cost of Goods Sold) $216.00 $225.00 $240.00 $270.00 $300.00 $360.00 (Commission Percentage) 15% 15% 15% 15% 15% 15% Net Sales $122,216 $127,309 $135,796 $152,771 $169,745 $203,694 Unit Volume 4680 4875 5200 5850 6500 7800 Unit Price $8 $8 $8 $8 $8 $8 Cost per Unit Sold $1 $1 $1 $1 $1 $1 Gross Sales $37,440 $39,000 $41,600 $46,800 $52,000 $62,400 Year Two Sales Projections Year One Ticket Sales Beverages
- 2. (Cost of Goods Sold) $4,680 $4,875 $5,200 $5,850 $6,500 $7,800 (Commission Percentage) 0% 0% 0% 0% 0% 0% Net Sales $32,760 $34,125 $36,400 $40,950 $45,500 $54,600 Unit Volume 2160 2250 2400 2700 3000 3600 Unit Price $35 $35 $35 $35 $35 $35 Cost per Unit Sold $3.25 $3.25 $3.25 $3.25 $3.25 $3.25 Gross Sales $75,600 $78,750 $84,000 $94,500 $105,000 $126,000 (Cost of Goods Sold) $7,020 $7,313 $7,800 $8,775 $9,750 $11,700 (Commission Percentage) 50% 50% 50% 50% 50% 50% Net Sales $34,290 $35,719 $38,100 $42,863 $47,625 $57,150 Total Unit Volume 14,040 14,625 15,600 17,550 19,500 23,400 Total Gross Sales $257,040 $267,750 $285,600 $321,300 $357,000 $428,400 (Total Cost of Goods Sold) $11,916 $12,413 $13,240 $14,895 $16,550 $19,860 (Total Commissions Paid) $55,858 $58,185 $62,064 $69,822 $77,580 $93,096 Total Net Sales $189,266 $197,153 $210,296 $236,583 $262,870 $315,444 Assumptions: Merchanside (locked) 30% of ticket buyers buy merchandise Beverages (changeable) 65% of ticket buyers buy an average of 1 beverages Beverage Industry Average for U.S. Bar & Nightclub (estimate) 65% order drinks most to all the time with males ordering more frequently than females. Surprisingly, Millenni http://www.nciaa.com/content.aspx?page_id=22&club_id=160641&module_id=29898 Total: All Products/Services Merchandise
- 3. The average consumer order 2.3 drinks per occasion with males ordering more than females and Millennials ordering m
- 4. 45,274 Year One Year Two 2-Year Total Q3 Q4 Total Total 1 2 13000 14400 31,700 49,400 81,100 $668 $7,500 $20 $20 - - Q2 vs. Q1 $0.03 $0.03 - - 4% $260,000 $288,000 $634,000 $988,000 $1,622,000 $390.00 $432.00 Sales growing over time? 15% 15% - - 100% $220,669 $244,433 $538,092 $838,540 $1,376,632 points for this dynamic (allocatio your growth points 8450 9360 20,605 32,110 52,715 Perfectly Exponential $8 $8 - Perfectly Linear $1 $1 - This Forecast $67,600 $74,880 $164,840 $256,880 $421,720 As a proportion out of 100% Year OneYear Two FORECAST SUMMARY
- 5. $8,450 $9,360 points for this dynamic (allocatio 0% 0% - - - your growth points $59,150 $65,520 $144,235 $224,770 $369,005 YOUR TOTAL POINTS % Total Points Possible 3900 4320 9,510 14,820 24,330 Your Total Points $35 $35 - - - $3.25 $3.25 - - - $136,500 $151,200 $332,850 $518,700 $851,550 $12,675 $14,040 50% 50% - - - $61,913 $68,580 $150,971 $235,268 $386,239 25,350 28,080 61,815 96,330 158,145 $464,100 $514,080 $1,131,690 $1,763,580 $2,895,270 $21,515 $23,832 $52,464 $81,757 $134,221 $100,854 $111,715 $245,929 $383,245 $629,174 $341,731 $378,533 $833,298 $1,298,578 $2,131,876 rprisingly, Millennials order less frequently than older consumers
- 6. llennials ordering more than the older consumers.
- 7. 3 4 5 6 7 8 slope $8,000 $9,000 $10,000 $12,000 $13,000 $14,400 13732 7 1,961.71 Q3 vs. Q2 Q4 vs. Q3 Q1 vs. Q4 Q2 vs. Q1 Q3 vs. Q2 Q4 vs. Q3 7% 13% 11% 20% 8% 11% LINEST SLOPE L/S Sales growing over time? 1 1626.476 1,962 1 overall rate oints for this dynamic (allocation) 25% our growth points 25% Perfectly Exponential L/S = 2 Perfectly Linear L/S = 1 his Forecast L/S = 0.83 As a proportion out of 100% 41% Year One Year Two
- 8. oints for this dynamic (allocation) 75% our growth points 31% YOUR TOTAL POINTS % 56% otal Points Possible 20 Your Total Points 11