
Recommended
More Related Content
Similar to Financial forecast diazcales-2
Similar to Financial forecast diazcales-2 (20)
More from GerardoDiaz90
Recently uploaded
Recently uploaded (20)
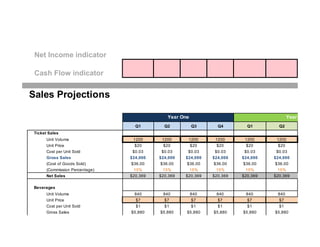
Financial forecast diazcales-2
- 1. Net Income indicator Cash Flow indicator Q1 Q2 Q3 Q4 Q1 Q2 Unit Volume 1200 1200 1200 1200 1200 1200 Unit Price $20 $20 $20 $20 $20 $20 Cost per Unit Sold $0.03 $0.03 $0.03 $0.03 $0.03 $0.03 Gross Sales $24,000 $24,000 $24,000 $24,000 $24,000 $24,000 (Cost of Goods Sold) $36.00 $36.00 $36.00 $36.00 $36.00 $36.00 (Commission Percentage) 15% 15% 15% 15% 15% 15% Net Sales $20,369 $20,369 $20,369 $20,369 $20,369 $20,369 Unit Volume 840 840 840 840 840 840 Unit Price $7 $7 $7 $7 $7 $7 Cost per Unit Sold $1 $1 $1 $1 $1 $1 Gross Sales $5,880 $5,880 $5,880 $5,880 $5,880 $5,880 Year Two Sales Projections Year One Ticket Sales Beverages
- 2. (Cost of Goods Sold) $840 $840 $840 $840 $840 $840 (Commission Percentage) 0% 0% 0% 0% 0% 0% Net Sales $5,040 $5,040 $5,040 $5,040 $5,040 $5,040 Unit Volume 360 360 360 360 360 360 Unit Price $16 $16 $16 $16 $16 $16 Cost per Unit Sold $3.25 $3.25 $3.25 $3.25 $3.25 $3.25 Gross Sales $5,760 $5,760 $5,760 $5,760 $5,760 $5,760 (Cost of Goods Sold) $1,170 $1,170 $1,170 $1,170 $1,170 $1,170 (Commission Percentage) 50% 50% 50% 50% 50% 50% Net Sales $2,295 $2,295 $2,295 $2,295 $2,295 $2,295 Total Unit Volume 2,400 2,400 2,400 2,400 2,400 2,400 Total Gross Sales $35,640 $35,640 $35,640 $35,640 $35,640 $35,640 (Total Cost of Goods Sold) $2,046 $2,046 $2,046 $2,046 $2,046 $2,046 (Total Commissions Paid) $5,890 $5,890 $5,890 $5,890 $5,890 $5,890 Total Net Sales $27,704 $27,704 $27,704 $27,704 $27,704 $27,704 Assumptions: Merchanside (locked) 30% of ticket buyers buy merchandise Beverages (changeable) 70% of ticket buyers buy an average of 1 beverages Beverage Industry Average for U.S. Bar & Nightclub (estimate) 65% order drinks most to all the time with males ordering more frequently than females. Surprisingly, Millenni http://www.nciaa.com/content.aspx?page_id=22&club_id=160641&module_id=29898 Total: All Products/Services Merchandise
- 3. The average consumer order 2.3 drinks per occasion with males ordering more than females and Millennials ordering m
- 4. (1,790,847) Year One Year Two 2-Year Total Q3 Q4 Total Total 1 2 1200 1200 4,800 4,800 9,600 $668 $1,200 $20 $20 - - Q2 vs. Q1 $0.03 $0.03 - - 0% $24,000 $24,000 $96,000 $96,000 $192,000 $36.00 $36.00 Sales growing over time? 15% 15% - - 0% $20,369 $20,369 $81,478 $81,478 $162,955 points for this dynamic (allocatio your growth points 840 840 3,360 3,360 6,720 Perfectly Exponential $7 $7 - Perfectly Linear $1 $1 - This Forecast $5,880 $5,880 $23,520 $23,520 $47,040 As a proportion out of 100% Year OneYear Two FORECAST SUMMARY
- 5. $840 $840 points for this dynamic (allocatio 0% 0% - - - your growth points $5,040 $5,040 $20,160 $20,160 $40,320 YOUR TOTAL POINTS % Total Points Possible 360 360 1,440 1,440 2,880 Your Total Points $16 $16 - - - $3.25 $3.25 - - - $5,760 $5,760 $23,040 $23,040 $46,080 $1,170 $1,170 50% 50% - - - $2,295 $2,295 $9,180 $9,180 $18,360 2,400 2,400 9,600 9,600 19,200 $35,640 $35,640 $142,560 $142,560 $285,120 $2,046 $2,046 $8,184 $8,184 $16,368 $5,890 $5,890 $23,558 $23,558 $47,117 $27,704 $27,704 $110,818 $110,818 $221,635 rprisingly, Millennials order less frequently than older consumers
- 6. llennials ordering more than the older consumers.
- 7. 3 4 5 6 7 8 slope $1,200 $1,200 $1,200 $1,200 $1,200 $1,200 532 7 76.00 Q3 vs. Q2 Q4 vs. Q3 Q1 vs. Q4 Q2 vs. Q1 Q3 vs. Q2 Q4 vs. Q3 0% 0% 0% 0% 0% 0% LINEST SLOPE L/S Sales growing over time? 0 44.33333 76 1 overall rate oints for this dynamic (allocation) 25% our growth points 0% Perfectly Exponential L/S = 2 Perfectly Linear L/S = 1 his Forecast L/S = 0.58 As a proportion out of 100% 29% Year One Year Two
- 8. oints for this dynamic (allocation) 75% our growth points 22% YOUR TOTAL POINTS % 22% otal Points Possible 20 Your Total Points 4