SlideShare a Scribd company logo
1 of 49
Jane Muchembi
1
RESEARCH METHODS
Research: Is a process of enquiry and investigation that is systematic, methodical and ethical
(www.brad.ac.uk/intrduction-to-research)
According to Orodho and Kombo (2002) research is a process of arriving at dependable solutions
to problems through planned systematic collection, analysis and interpretation of data.
Researchproposal: Is plan, suggestion or request to conduct research which comprises of
introduction, literature review and research methodology (Kombo and Tromp 2006). It consists
of three chapters:-
Chapter one: Introduction
Chapter two: Literature review
Chapter three: Research methodology
Researchproject or thesis: Is a written scientific report that deals with the concerns related to
the problem or series of problems in one’s area of research (Kombo and Tromp 2006). It
comprises of five chapters:-
Chapter one: Introduction
Chapter two: Literature review
Chapter three: Research methodology
Chapter four: Research findings
Chapter five: Summary, Conclusions, Recommendations
VARIABLES
 You won't be able to do very much in research unless you know what variables are. A variable
is any entity that can take on different values. The term variable is derived from variations. It
refers to differences, attributes, qualities of the cases that we measure or record (Kombo and
Tromp 2006).
 A variable is anything that takes differing or varying values e.g. Age, height, price, income,
level of education, motivation, performance, etc.
 Anything that can vary can be considered a variable. For instance, age can be considered a
variable because age can take different values for different people or for the same person at
different times. Similarly, country can be considered a variable because a person's country can
be assigned a value.
TYPES OF VARIABLES
1. Independent variables (also known as predictor variable)
 An independent variable is what the researcher (or nature) manipulates, a treatment or
program or cause.
 It is the intervention or a condition implemented by the researcher to see if it will create
change on the dependent variable. This could be a program, method, system, or other action.
 Independent variables are predictors or explanatory variables, those that cause changes to
the dependent variables. They influence the dependent variables positively or negatively.
e.g. The relationship of availability Computer Aided Design (CAD) software (independent
variable) on the number of defective product i.e. rejects (dependent variable) in fashion
Jane Muchembi
2
manufacturing firm may be affected by the designers ability to use the CAD technology
(moderating variable).
 Whenever there is independent variable there is also a dependent variable.
 An increase or decrease in units of independent variable will lead to increase or decrease in
dependent variable i.e. variance in dependent variable is accounted for by variance in
independent variables.
2. Dependent variables (also known as criterion variable)
 Dependent variable: A dependent variable is what may change as a result of the independent
variable or intervention.
 The dependent variable is what is affected by the independent variable – the researchers’
effects or outcomes. For example, if the researcher is studying the effects of a new
educational program on student achievement, the program is the independent variable and
your measures of achievement are the dependent ones.
 A dependent variable could be a behavior, outcome, or other condition. Introduction of
modern cutting and stitching machines (independent variable) in a garment making firm, for
example, may increase the output or production (dependent variable).
 It is the outcome that the researcher is attempting to predict e.g. performance of a designer. It
is the variable that the researcher is primarily interested in. The researcher’s goal is to
understand, describe it, to find out what influences its behavior or to predict it.
 Dependent variable is the variable of primary interest to the researcher. The researcher’s goal
is to understand and describe the dependent variable or to explain its variability or to predict
it.
 Understanding the dependent variable and the other variables that influence it will help the
researcher to recommend solutions to problems e.g. understanding factors (independent
variables) that hinder many Kenyan fashion designers from starting their own fashion design
businesses (dependent variable) will help the researcher recommend possible ways of
removing those hindrances.
3. MODERATING VARIABLE
 Moderating variable is one that has a strong contingent effect on the independent variable-
dependent variable relationship.
 Its presences modifies the relationship between the independent and dependent variables e.g. The
designers ability or skills in using CAD technology will interfere with the relationship between
availability of CAD software and number of defective products (rejects).
Relationshipbetween independentanddependentvariable
Computer aided design Number of defective products / rejects
Independent variable Dependent variable
Jane Muchembi
3
4. INTERVENING VARIABLE
 Intervening variable is one that surfaces between the time independent variable starts operating
to the time their impact is felt on it. There is therefore a temporal quality or time dimension to
the intervening variable.
 It surfaces as a function of the independent variable(s) operating in any situation and helps to
conceptualize and explain the influence of independent variable(s) on the dependent variable.
e.g. in a study where the independent variable is workforce diversity which influences the
dependent variable is organizational effectiveness, creative synergy (collaboration, cooperation,
interaction) may surface as the intervening variable. Creative synergy may surface due to
multiracial, multiethnic and multifaceted expertise in problem solving.
 NB: creative synergy in the above example surfaces at time t2 as a function of workforce
diversity which was in place at time t1 to bring about organizational effectiveness at time t3.
 The intervening variable of creative synergy helps us to understand how workforce diversity
brings about organizational effectiveness.
Number of defective products / rejects
Relationshipbetweenindependent, dependentvariablesmodulatedbymoderatingvariable
Computer aided design
Dependent variableIndependent variable
Moderating variable
Designer’s CAD skills
Creative synergy Organizational effectivenessWorkforce diversity
Relationship between independent, intervening and dependent variables
Independent variable Dependent variableIntervening variable
t3t2t1Time
:me
Jane Muchembi
4
NB: Inclusion of a moderating variable will affect the relationship between the other variables
e.g. creative synergy may not occur if the management is not able to harness the different
problem solving skills in the diverse workforce.
Abstract: is a summary of the whole research project including the objectives, methodology
used, findings and recommendations. It should not exceed 500 words.
THE PURPOSE CONDUCTING RESEARCH is to:-
i. Review or synthesize existing knowledge
ii. Investigate existing situations or problems
iii. Provide solutions to problems
iv. Explore and analyze more general issues
v. Construct or create new procedures, or systems or technologies
vi. Explain a new phenomenon
vii. Generate new knowledge
viii. Combination of any of the above
(Collis & Hussey, 2003). (www.brad.ac.uk/intrduction-to-research)
RESEARCH TOPIC: Refers to the subject, issue or area under discussion or investigation e.g.
fashion marketing, African dress, interior design.
A researcher should choose a topic which interests him/her as this will help sustain the
motivation to complete the research. This is because one will enjoy reading materials in the area,
collecting and analyzing data.
Independent variable Intervening variable
Managerial expertise
Relationship between independent, intervening, moderating and dependent variables
Creative synergy
t3t2Time
:me
t1
Organizational effectivenessWorkforce diversity
Dependent variable
Moderatingvariable
Jane Muchembi
5
RESEARCH TITLE: is the heading, label or tag. It describes what the research is about. It
should be formulated after selecting the topic.
QUALITIES OF A GOOD TITLE
i. It should be brief i.e. not more than 15 words
ii. It should be specific i.e. it should be easy to identify independent and dependent variable from
the title.
iii. It should be in line with the objectives i.e. it should portray the aims and objectives of the
research.
iv. It should be clear and not ambiguous i.e. it should not be subject to different interpretations. It
should reflect a relationship between independent and dependent variables.
v. It should portray an issue that is researchable i.e. the aspects in question should be
measurable.
REFERENCING OTHER PEOPLES’ WORK WHEN CONDUCTING RESEARCH
A researcher should acknowledge all the sources of information used when conducting the
research by citing the author’s surname and year of publication in the text and writing its full
details in the reference list at the back of the document.
REASONS FOR CITING OTHER PEOPLES WORK
i. The body of knowledge is not built on vacuum but on accumulated knowledge over
generations and so the researcher should try to fit his/her research within already existing
knowledge.
ii. It is courteous to acknowledge use of other peoples’ work.
iii. It provides evidence of thorough examination of literature and shows that the researcher has
read.
iv. It gives support to the points that the researcher has stated in the research.
v. Helps to identify gaps that should be met by the researcher.
FOUR IMPORTANT POINTS WHEN REFERENCING
i. Credit must be given when quoting or citing other peoples.
ii. Adequate information must be provided to enable a reader to locate each reference.
iii. References must be complete and consistent.
iv. References must be recorded in precise format as per the requirement of the University of
Study.
REFERENCING STYLES/SYSTEMS
There are several referencing styles to choose from e.g.
i. Vancouver which uses numbers in the text and footnotes. Each number in the text represents a
reference or publication whose details are given in the footnotes.
ii. Modern Language Association (MLA)
iii. Harvard system which is an author –date system
iv. The American Psychological Association (APA) system which is also a an author –date
system which is recommended for social sciences.
Jane Muchembi
6
CHOICE OF REFERENCING STYLE/SYSTEMS
The choice is influenced by the discipline of study and the university.
NB: A researcher should familiarize himself or herself with all the styles and thoroughly study
the style that he/she will adopt.
The American Psychological Association (APA) system
It is an author –date system which is recommended for social sciences.
It requires that the researcher identifies or acknowledges or writes the authors’ surname/names
and date (year) of publication at the point where they are cited in the text (proposal or project)
and full details of the publication in the reference list at the end of the publication.
Referencing in the text
This can be done at the beginning or end of the sentence.
When done at the end of the sentence the authors name and date are put into bracket and full stop
at the after the bracket e.g. teenage girls prefer wearing high heeled shoes (Kelly, 2014). If there
are two authors write both authors surnames names separated by & and then year e.g. (Kelly &
Allan, 2014).
When used at the beginning of the sentence only the date is in bracket e.g. According to Kelly
(2014) teenage girls prefer wearing high heeled shoes.
In case the author is not known cite a (short title, date)
If the date is not known cite (Author, n.d.).
Corporate authors like UN Cite in full first used and acronyms thereafter e.g. (United Nations
(UN), 2001) first time and (UN, 2001) thereafter.
Page numbers are only written in citations for direct quotations but not paraphrased ones.
Referencing in the reference list
This is placed immediately after chapter three for the proposal and chapter five for the project.
For text books, one starts with the authors surname/names initials (date). Then title of the book
(in Italics). The city of publication: publisher. E.g. Kelly, J. M. & Allan, B. S. (2014).
Introduction to Research Methods. Nairobi: Acts Publishers.
For journal articles, start with surname/s (date). Title of the article, Journal name (in Italics),
Volume No. Part no. Pages. E.g. Kelly, J.M. & Allan, B.S. (2014). University dressing Code,
Fashion and Design Journal, 43 (3), 72-90
For journal published in the internet < URL: http://www. remainder of full internet electronic
conference/bulletin board >
e.g. <URL:http://www.stingray.ivision.co.uk/groups/emu/frindex.htm>
For Journals article published in the internet start with the surname, Initials (date). ‘Title of the
article’, Journal Name (in Italics). Volume No. Part no. (online) (cited day, month, year)
Available from <URL: http://www. remainder of full internet address>e.g. Illingworth, N. (2001)
‘The internet matters’ Sociological Research Online 6:2, (online) (cited 20 March 2002)
Available from < URL: http://www.scoresonline.org.uk/6/2/illing th.html>
Jane Muchembi
7
NB:
i. All the authors cited in the text should be included in the reference list.
ii. Authors not cited in the text should not be in the reference list.
iii. Single space within a reference and double space between references.
iv. Use hanging indents in references
v. The publication in the reference list should be arranged in alphabetical order by the
authors’ names i.e. authors whose surnames start with letter “A” should be listed before
those whose surnames start with “B” and so on.
An example of reference list
Babbie, E. (2001). The practice of social Research: 9th Ed. CA: Wadworth Thomson.
Neville C. (2007). An introduction to research and research methods. Bradford University
school of Management.
Saunders, M, Lewis, P. & Thornhill, A. (2007) Research Methods for Business Students (4th
Edition.) Harlow: Prentice Hall.
NB: Referto the APA Manual for more details.
Jane Muchembi
8
CHAPTER ONE: INTRODUCTION
1.0 BACKGROUND TO THE STUDY
 Refers to the setting or position of the study. It is a brief overview of the problem the researcher
plans to investigate. It should tell the readers why the researcher feel that the research is worth the
effort. It should be a highlight of the key literature sources that the researcher plans to draw from.
 It provides background to the problem from international, national and local point of view based
on existing literature. It is similar to literature review in that it cites some literature but different in
that it is much more brief (not more than ½ pages). It is a mini literature.
ROLE OF BACKGROUND TO THE STUDY IN RESEARCH
i. It helps to clarify what brought about the need for the study.
ii. It points out the challenges faced due to the identified issue
iii. It indicates the opportunities for improvement
iv. It demonstrates the researcher’s view of the research problem.
v. It helps to convince the readers that a problem exists and need to be addressed.
QUALITIES OF A GOOD BACKGROUND TO THE STUDY
It should be:-
i. Brief and specific, although it is very similar to the literature review it is less detailed.
ii. Engages the interest of the reader. It should make the reader excited about the opportunity of
having the research problem addressed.
iii. It gives the reader a glimpse of the research problem
iv. It gives the reader an idea of how the proposal is structured
v. The language used is simple and straight forward
vi. Informative and persuasive since it attempts to enlighten the reader on the research problem and
the urgency of addressing it.
(Kombo and Tromp 2006)
1.2 RESEARCH PROBLEM
 A research problem is an issue or concern that puzzles the researcher because of its effects or
consistence despite the measures taken e.g. use of indecent dressing among fashion and design
students despite continued training on importance of dressing decently.
 It can also be defined as situation where gap exists between the actual and desired ideal situation or
state e.g. the desired ideal situation may be zero defects in production but the actual may be that
there are a few defects.
 It is the heart or core of the research project and if a researcher does not understand the problem
he/she will not succeed in the research.
QUALITIES OF A GOOD OR EFFECTIVE RESEARCH PROBLEM
i. It is concise and clearly stated. It makes the reader aware that there is a definite issue that need to
be addressed or problem that needs to solved. It should answer questions such as:-
a) What is the problem?
b) Why is it a problem?
c) Who is getting affected or will be affected if the situation is not addressed through research?
d) Where/ location does the problem exist?
Jane Muchembi
9
ii. The research problem has impact in the whole topic being investigated.
iii. It indicates clearly that there is urgent need of the research.
iv. It is researchable i.e. the problem can be investigated through collection and analysis of data.
v. Relevant literature is available i.e. the problem has supportive statements.
vi. Language used is simple and objective i.e. not emotional, comic or poetic.
(Kombo and Tromp 2006)
1.3 RESEARCH OBJECTIVES
These are the intentions or purposes of research stated in specific and measurable terms. They
provide opportunities for measuring end results e.g. to establish the effects of age on the height
of shoes used by women in Nairobi city?
QUALITIES OF GOOD OR EFFECTIVE RESEARCH OBJECTIVES
i. Specific: clearly state what the researcher will do in order to fulfil the purpose of the research.
ii. Measurable: the researcher should be able to measure or tell whether they have been
achieved.
iii. Focused: Should narrow the study to essentials. They should cover the different aspects of the
problem and its contributing factors in a coherent and logical sequence.
iv. Operational: they should be clearly stated in operational terms, specifying exactly what the
researcher will do.
v. Realistic: Not too ambitious and therefore achievable.
1.5 RESEARCH QUESTIONS
These are issues that the researcher plans to answer and are related to the research objectives e.g.
what is effect of age on the height of shoes used by women in Nairobi city?
1.6 RESEARCH HYPOTHESES
Hypothesis: is an educated guess or assumption. It is a tentative explanation for certain behavior
pattern, phenomenon, or events that have occurred or will occur.
Researchhypothesis is a statement about the expected relationship between observable or
measurable events.
An experimental research hypothesis states the expected relationship between independent and
dependent variables e.g. increase in consumers salaries will lead to increase in consumption of
fashion products.
FORMS OF STATING HYPOTHESIS
1. The null hypothesis: States that there is no difference between the variables studied. The aim
of testing it is to show that the hypothesis is false and accept the alternative hypothesis. It
symbolized as H0 e.g. H0 1: There is no significant difference in the performance of designers
who have gone through a diploma course in design and those who have gone through a degree
program.
Jane Muchembi
10
2. The alternative hypothesis: is the opposite of the null hypothesis and states that a value or
relationship in the null is not true. It symbolized as H1 e.g. H1 e.g. H1: there is a significant
difference in performance of designers who have gone through diploma and those who have
gone through a degree program.
1.7 SIGNIFICANCE/JUSTIFICATION OF THE STUDY
Outlines the importance of the issue under investigation. Explains who will benefit from the
research and how they will benefit from the findings of the research. This is important because
research is expensive in both money and time and therefore it is necessary to establish the need
or relevance of research.
1.8 LIMITATIONS OF THE STUDY
Refer to the challenges anticipated or faced by the researcher e.g. time, finances inaccessibility
of data non-cooperative respondents etc.
1.9 ASSUMPTIONS OF THE STUDY
What the researcher assumes to be true e.g. the information given by the respondents is true.
DEFINITION OF TERMS
Significant terms which are used whose meanings are not obvious are defined. Start this section
in a new page.
NB: Every chapter should be started in a new page.
CHAPTER TWO: LITERATURE REVIEW
The term literature refers to the analysis of publications such as books, journals, magazines,
manuscripts etc. Literature means the work/publications that the research has consulted or referred
to when conducting research to gain better understanding of the of the research problem. Literature
review is therefore an account or a critical look at what has been published on a topic by accredited
scholars.
REASONS FOR CRITICAL LITERATURE REVIEW WHE N CONDUCTING
RESEARCH
i. It sharpens theoretical foundation of the research. It enables the researcher to study different
theories related to the identified topic. By studying them the researcher gains clarity and better
understanding of the theoretical foundations related to the research.
ii. It gives the researcher insight into what has already been researched in the selected field,
pinpointing strengths and weaknesses. This information guides the researcher in theory
formulation and identifying the gaps.
iii. It enables the researcher to avoid duplication of research already done.
iv. Helps the researcher to develop a significant problem of the study which will provide further
knowledge in the field of study.
Jane Muchembi
11
v. It exposes the researcher to a variety of approaches or methods of conducting research. This
contributes to a well-designed methodology because the researcher can avoid methods that have
been reported in the literate to be weak or have failed.
vi. It helps in developing analytical framework or basis for analyzing and interpreting data. The
researcher will be able to compare and contrast their findings with the findings of the other
researchers.
vii. Helps to convince the reader that:-
a) The researcher is knowledgeable about the problem area and has done the preliminary home
work that is necessary to conduct research
b) Theoretical framework will be structured on work already done and will add to the solid
foundation of existing knowledge.
(Sekaran 2003)
QUALITIES OF GOOD LITERATURE REVIEW
i. It should be critical, organized and analytical in orientation.
-It is used to analyze issues such as whether the title is descriptive, well worded and reasonably
short.
-The researcher also analyzes whether the problem was well stated, objectives, questions and
hypotheses in the studies reviewed were logically formulated.
-The researcher also analyzes the methodology used was appropriate i.e. was the right design,
population, sample and sampling procedure, data collection methods and instruments and data
analysis techniques were used.
- The researcher also analyzes whether it provided the results are significant, applicable and
relevant to his/her research.
ii. It justifies the need for further study i.e.
- it identifies the gaps in the studies reviewed that should be filled with further research.
-It highlights controversies raised in the previous researches which need to be resolved by further
research.
-It points out how current research will positively contribute towards filling in the identified gaps.
iii. It highlights the relationship between the past and the current study i.e.
-It links the current study with the past studies
- It evaluates and shows the relationship between the work already done by other scholars and
the researcher’s work.
-This brings consistency and continuity in relation to identified topic.
iv. It puts the research into perspective
- Citing and analyzing various related studies helps to define the research problem.
- It also act as a guideline in assessment of the research questions.
THE STRUCTURE/COMPONENTS OF LITERATURE REVIEW
2.1 Introduction: It briefly (one paragraph) tells the reader what is discussed in the literature
review.
Jane Muchembi
12
2.2 The body: this may be structured into subtopics based on either the:- a) objectives or
b) Variables
2.3 Summary and identified gaps: summarizes the key and relevant findings from the reviewed
literature and brings out what the previous studies have not covered on the topic and needs to be
researched.
NB:
When writing the literature review, read the publication critically and analytically, understand and
then summarize the idea you find relevant in your own words. Then cite the author.
 If there is need to use direct quotation put them into quotes and cite the authors name, date and page
number. If the quotation is from 40 words and above indent and single space the whole block and
do not put them in quotes, cite the author, date and page number. Desist from using quotes after
quotes and copy pasting.
 Bring out some discussions on every idea you write about based on what different authors have
written i.e. explain where different authors agree or disagree, contradictions and gaps of what they
have not explained about the idea (missing gaps)
 Only include relevant literature. Not every material you will read is relevant to your study.
2.4 THEORETICAL FRAMEWORK AND CONCEPTUAL FRAMEWORK
2.4.1 THEORETICAL FRAMEWORK
According to Sekaran (2004), theoretical framework explains the relationship between variables that
are deemed to be integral to the dynamics of the situation being investigated. It is the foundation on
which the entire research is based. It is based on existing relevant theories.
2.4.2 CONCEPTUAL FRAMEWORK
Is a set of broad ideas and principles taken from relevant fields of inquiry and used to structure a
subsequent presentation (Reichel and Ramey (1986) as cited by Kombo and Tromp 2006)
DEFFERENCES BETWEEN CONCEPTUAL AND THEORETICAL FRAMEWORK.
Theoretical framework Conceptual framework
-It is based on existing relevant theories.
- Since is based on existing theory it is likely
to have been tested before
-May not be supported by schematic diagram
- It based on the way the researcher conceptualizes
certain ideas, actions and relationships
-it is a hypothesized mode of identifying concepts or
variables under study and showing their relationships
-Is better accompanied by schematic diagram
SIMILARITIES BETWEEN CONCEPTUAL AND THEORETICAL FRAMEWORK.
i. They both explain the relationship between dependent and independent variables.
ii. Both form the foundation on which the whole research is based.
iii. Help the researcher to hypothesize and test the relationship between dependent and independent
variables.
iv. Help to identify the existing networks of relationships among variables.p
Jane Muchembi
13
v. Both tend to focus the direction of research so that the researcher does not dwell on the trivial
matters that do not contribute to the body of knowledge or digress
vi. Help to provide a rational basis for explaining or interpreting results of the research.
vii. Enables the researcher to make predictions.
viii. Both may need to be tested or improved through research.
THE PURPOSE OF DEVELOPING A CONCEPTUAL FRAMEWORK WHEN
CONDUCTING RESEARCH
i. Provides a clear link from literature review, to the research problem, questions and objectives.
ii. Gives broad scope of the research and enables the researcher to conceptualize the research
problem from a broad perspective.
ii. It is conceptually aligned with the research methodology and objective and therefore provides an
overall view of the research.
By highlighting the independent and dependent variables, it enables the researcher to focus on the
research problem.
PLACEMENT OF CONCEPTUAL AND THEORETICAL FRAMEWORK
 According to Creswell (2004) placement of theory depends on whether one is conducting a
quantitative or qualitative study. In quantitative research it may be placed at the end of introduction
i.e. chapter one or at the beginning or end of chapter two i.e. literature.
 In qualitative research a researcher does not begin with theory but it emerges during data collection
and analysis and so it can be placed at the end of the research.
CHAPTER THREE: RESEARCH METHODOLOGY
RESEARCH APPROACHES
Quantitative research Qualitative research
- Quantitative research relies on the principle of
verifiability meaning that it seeks confirmation,
proof, corroboration or substantiation
- Emphasizes collecting and analyzing numerical
data.
- Qualitative research is research that involves
description, it seeks to describe the behavior of
the population under investigation
- Does not emphasize use of numerical data.
Basic research Applied research
- Aims at improving or adding knowledge without
any particular applied purpose in mind at the
onset.
- Is designed right from the start to apply its
findings to a particular situation or to solve a
specific problem.
Deductive research: testing theory Inductive research: building theory
- Moves from general ideas to specific, particular
situations.
- The particular is deduced from the general e.g.
broad theories
- Moves from particular situations to make or
infer broad general ideas or theories.
- E.g. if you wanted to know the meaning of the
word fashion to a range of people may be of
Jane Muchembi
14
- E.g. if you wanted to know the meaning of the
word fashion to a range of people may be of
different ages or gender, you could start by
checking the definitions given by professional
associations or sources and then test the definition
with the range of people.
- Then collate the data collected and the results
analyzed and presented.
different ages or gender, you could start by
checking the definitions with the range of
people and then compare with definition given
by professional associations or sources and
then test the definition
- Then collate the data collected and the results
analyzed and presented.
- This may lead to new definition or not
3.1. RESEARCH DESIGNS
Researchdesign: can be thought of as a structure of the research. It is the glue that holds all the
elements of research project together.
There are different types of research designs e.g.
I. Descriptive Survey:
i. Describes the state of affairs as it exists.
ii. May lead to formulation of important principles of knowledge and solutions to significant
problems.
iii. Involve collection, classification, analysis, comparison and interpretation of data.
iv. Can be used for collecting information about people’s attitudes, opinions, and habits.
II. Correlational design:
i. Enables the researcher to assess the degree of relationship that exists between two or more
variables e.g. age of the consumer and the height of the shoes used.
ii. Tries to establish how given independent variables affect or cause changes to the dependent
variables.
iii. Tend to compare similarities and differences between groups of population.
iv. The researcher is required to control all other variables to be able to establish a causal relationship.
III. Evaluative design:
i. Investigates the effects or impacts of a program or project.
ii. Involve collection and analysis of data to facilitate decision making.
iii. Assists in meeting accountability demands.
iv. Helps to determine the worth of a program or project or activity.
IV. Experimental design:
i. Involve manipulation or treatment of some variables and then measuring the outcomes.
ii. Two groups of respondents are used i.e. the experimental group and control group.
iii. The experimental group receives the treatment but the control group does not and their
performance or behavior is tested after the experiment.
iv. The researcher assumes that the two groups were the same before the experiment.
V. Case study
i. Seeks to study a unit in detail, in context and holistically.
Jane Muchembi
15
ii. Enables the researcher to deep information and understanding on the unit being studied
iii. The findings may not be easily generalized.
iv. The researcher should give clear justification for using this design.
VI. Naturalistic/ethnographical design
i. Studies a phenomenon in its ordinary or natural environment
ii. Attempt to study ordinary happenings
iii. Uses common language in reporting
iv. Is mostly qualitative in nature
VII. Historical /longitudinal design
i. Involves integration and description of the true record of past events and their developmental
trends.
ii. It is a longitudinal, genetic or developmental approach attempting to get the actual meaning of the
primary and secondary sources pertinent to the problem under investigation by subjecting the
evidence to external and internal criticism.
iii. Involves collection and analysis of primary sources such as manuscripts, memoirs, diaries,
autobiographies
iv. The major focus is construction of conceptual frameworks, collection, analysis and organization
and demonstration meaning of historical evidence
VIII. CROSS-SECTIONAL STUDIES
This is a study involving different organizations or groups of people to look at similarities or
differences between them at any one particular time, e.g. a survey of the IT skills of managers in
one or a number of organizations at any particular time. Cross-sectional studies are done when
time or resources for more extended research, e.g. longitudinal studies, are limited. It involves a
close analysis of a situation at one particular point in time to give a ‘snap-shot’ result.
3.2 THE LOCALE OR LOCATION OF THE STUDY
Describe the location where the research will be carried out giving justifications.
3.3 POPULATION/TARGET POPULATION
It is the group of people or objects or items with at least one thing in common from which the
sample will be taken for measurements and the results generalized to e.g. All the small scale
fashion traders in Nakuru county.
The major question that motivates sampling in the first place is: "Who do you want to generalize
to?" Or should it be: "To whom do you want to generalize?" In most social research we are
interested in more than just the people who directly participate in our study. We would like to be
able to talk in general terms and not be confined only to the people who are in our study.
There are times when we aren't very concerned about generalizing. Maybe we're just evaluating a
program in a local agency and we don't care whether the program would work with other people
in other places and at other times. In that case, sampling and generalizing might not be of
interest.
Jane Muchembi
16
In other cases, we would really like to be able to generalize almost universally. When
psychologists do research, they are often interested in developing theories that would hold for all
humans. But in most applied social research, we are interested in generalizing to specific groups.
The group you wish to generalize to is often called the population in your study. This is the
group you would like to sample from because this is the group you are interested in generalizing
to.
Let's imagine that you wish to generalize to urban homeless males between the ages of 30 and 50
in the Kenya. If that is the population of interest, you are likely to have a very hard time
developing a reasonable sampling plan. You are probably not going to find an accurate listing of
this population, and even if you did, you would almost certainly not be able to mount a national
sample across hundreds of urban areas. So we probably should make a distinction between the
population you would like to generalize to (theoretical population) and the population that will
be accessible to you (the accessible population). In this example, the accessible population
might be homeless males between the ages of 30 and 50 in six selected urban areas across the
Kenya
SAMPLING FRAME: is the list of all the members of the population under investigation. The
researcher can obtain one from the relevant bodies or develop one in case where such a list does
not exist.
Once you've identified the theoretical and accessible populations, you have to do one more thing
before you can actually draw a sample -- you have to get a list of the members of the accessible
population. (Or, you have to spell out in detail how you will contact them to assure
representativeness). The listing of the accessible population from which you'll draw your sample
is called the sampling frame.
3.4 SAMPLE POPULATION
Sample population: is a sub-set of population or a small part of the target population which is
thought to be a true representative of the whole population. It comprises of all the members
selected from the population from which data will be collected and then generalized to the whole
population.
You actually draw your sample (using one of the many sampling procedures). The sample is the
group of people who you select to be in your study. Notice that I didn't say that the sample was
the group of people who are actually in your study. You may not be able to contact or recruit all
of the people you actually sample, or some could drop out over the course of the study. The group
that actually completes your study is a subsample of the sample -- it doesn't include non-
respondents or dropouts. The problem of nonresponse and its effects on a study will be addressed
when discussing "mortality" threats to internal validity.
People often confuse what is meant by random selection with the idea of random assignment.
You should make sure that you understand the distinction between random selection and random
assignment.
Jane Muchembi
17
At this point, you should appreciate that sampling is a difficult multi-step process and that there
are lots of places you can go wrong. In fact, as we move from each step to the next in identifying
a sample, there is the possibility of introducing systematic error or bias. For instance, even if you
are able to identify perfectly the population of interest, you may not have access to all of them.
And even if you do, you may not have a complete and accurate enumeration or sampling frame
from which to select. And, even if you do, you may not draw the sample correctly or accurately.
And, even if you do, they may not all come and they may not all stay.
3.5 SAMPLING/ SAMPLING TECHNIQUES/PROCEDURES /METHODS
Sampling refers to the process of selecting the individuals or objects from which to gather the
information from the population. It is the process of selecting units (e.g., people, organizations)
from a population of interest so that by studying the sample we may fairly generalize our results
back to the population from which they were chosen.
SOME DEFINITIONS
Before I can explain the various probability methods we have to define some basic terms. These
are:
 N = the number of cases in the sampling frame
 n = the number of cases in the sample
 NCn = the number of combinations (subsets) of n from N
 f = n/N = the sampling fraction
That's it. With those terms defined we can begin to define the different probability sampling
methods.
SAMPLING FORMULAR
N
n =______________________
1 + Ne2
Where;
N- the population/Number of cases in the sampling frame
e- the margin of error
n- the sample size/number of cases in the sample
SAMPLING DESIGNS
Are categorized as:-
1. PROBABILITY SAMPLING
Probability sampling techniques: apply random selection where each member of population is
given equal chances of being in the sample. They don’t give all the members of the population
equal chances of being in the sample.
A probability sampling method is any method of sampling that utilizes some form of random
selection. In order to have a random selection method, you must set up some process or procedure
that assures that the different units in your population have equal probabilities of being chosen.
Jane Muchembi
18
Humans have long practiced various forms of random selection, such as picking a name out of a
hat, or choosing the short straw. These days, we tend to use computers as the mechanism for
generating random numbers as the basis for random selection.
2. NON-PROBABILITY SAMPLING
Non-probability sampling techniques: The researcher is interested in the representativeness of
the concepts in their varying forms maximizing the scope or range of variations of respondents in
the sample.
Probability sampling techniques Non-probability sampling techniques
i. Simple random sampling
ii. Systematic random sampling
iii. Stratified random sampling
iv. Cluster random sampling
v. Multistage random sampling
i. Quota sampling
ii. Convenience sampling
iii. Judgmental sampling
iv. Purposive sampling
v. Snowballing
vi. Volunteer/ self-selection
i. Simple random sampling
It has the least bias and produces most generalized results because it gives every member of
population a chance of being in the sample.
Procedure: Use a table of random numbers, a computer random number generator, or a mechanical
device to select the sample. One may use the following procedure.
1. First, we have to get the sampling frame organized. The researcher obtains or makes a list of all
the members of the population and assigns to each of them a number or letter i.e. if the whole
population comprises of 1,000 people make a list of 1,000.
2. Decide on the number of people you would like to have in the final sample depending on the size
of the population and the research design. For example, if you want to select 100 clients to survey
and that there are 1000 members of the population. Then, the sampling fraction is f = n/N =
100/1000 =10 or 10%.
3.Write those numbers in small papers (tickets) similar to those used in a raffle i.e. 1-1,000.
4. Fold each of them and mix them nicely in a container.
5. Pick the number of tickets equal to the sample size chosen e.g. if a sample of 10% is required
pick 100 tickets and individuals represented by the numbers in the 100 tickets picked will be the
ones to make up the sample.
But this mechanical procedure would be tedious and the quality of the sample would depend on
how thoroughly you mixed them up and how randomly you reached in.
With the development of inexpensive computers there is a much easier way. Here's a simple
procedure that's especially useful if you have the names of the clients already on the computer.
Many computer programs can generate a series of random numbers. Let's assume you can copy and
paste the list of client names into a column in an EXCEL spreadsheet. Then, in the column right
next to it paste the function =RAND() which is EXCEL's way of putting a random number between
Jane Muchembi
19
0 and 1 in the cells. Then, sort both columns -- the list of names and the random number -- by the
random numbers. This rearranges the list in random order from the lowest to the highest random
number. Then, all you have to do is take the first hundred names in this sorted list. Pretty simple.
You could probably accomplish the whole thing in under a minute.
Simple random sampling is simple to accomplish and is easy to explain to others. Because simple
random sampling is a fair way to select a sample, it is reasonable to generalize the results from the
sample back to the population. Simple random sampling is not the most statistically efficient
method of sampling and you may, just because of the luck of the draw, not get good representation
of subgroups in a population. To deal with these issues, we have to turn to other sampling methods.
ii. Systematic random sampling Systematic Random Sampling
Here are the steps you need to follow in order to achieve a systematic random sample:
 number the units in the population from 1 to N
 decide on the n (sample size) that you want or need
 k = N/n = the interval size
 randomly select an integer between 1 to k
 then take every kth unit
It involves drawing every nth elements in the population starting with a randomly selected element
between 1 and n.
e.g. if 10% sample is required from a population of 1,000 people (i.e. 100 people)
1. The researcher obtains or makes a list of all the members of the population and assigns to each
of them a number or letter i.e. if the whole population comprises of 1,000 people make a list of
1,000.
Pick the first element (number) at random
2. Pick every 10th (1000/100) number from the randomly selected number until you get the 100
required e.g. if 1 is the randomly selected number then the next number picked is, 10, then 20,
then 30, the 40 etc. until a sample of 100 is picked.
1, 2, 3, 4, 5, 6, 7, 8, 9, 10, 11, 12, 13, 14, 15, 16, 17, 18, 19, 20, 21, 22,23, 24, 25, 26,27,27,
29, 30, 31, 32, 33, 34, 35, 36, 37, 38, 39, 40, 41, 42, 43, 44, 45, 46, 47, 48, 49, 50, 51, 52, 53,
54, 55-----------1,000
iii. Stratified random sampling
Stratified Random Sampling, also sometimes called proportional or quota random sampling,
involves dividing your population into homogeneous subgroups and then taking a simple random
sample in each subgroup. In more formal terms:
The researcher first divides the population into groups based on relevant characteristics and then
randomly selects participants from those groups e.g. If the population comprises of both male and
female, make a list of all the male and all the female. Then randomly select the number of males
required and the number of females required.
The steps:-
1. Determine the strata that the population will be divided into e.g. according to sex (male and
female), or according to the age, or geographical location such as rural and urban etc.
Jane Muchembi
20
2. Determine the number of participants required from each stratum e.g. If a sample of 100 is
required from a population 1000 where there is 50% male (500) and 50% female (500), the
sample may also have 50% (50 ) male and 50% (50) female i.e. Proportionate random sampling.
3. Randomly select the participants from within the group/ strata.
NB: The sample can also be selected using a computer program.
Objective: Divide the population into non-overlapping groups (i.e., strata) N1, N2, N3, ... Ni,
such that N1 + N2 + N3 + ... + Ni = N. Then do a simple random sample of f = n/N in each strata.
There are several major reasons why you might prefer stratified sampling over simple random
sampling. First, it assures that you will be able to represent not only the overall population, but
also key subgroups of the population, especially small minority groups. If you want to be able to
talk about subgroups, this may be the only way to effectively assure you'll be able to. If the
subgroup is extremely small, you can use different sampling fractions (f) within the different
strata to randomly over-sample the small group (although you'll then have to weight the within-
group estimates using the sampling fraction whenever you want overall population estimates).
When we use the same sampling fraction within strata we are conducting proportionate stratified
random sampling. When we use different sampling fractions in the strata, we call this
disproportionate stratified random sampling. Second, stratified random sampling will generally
have more statistical precision than simple random sampling. This will only be true if the strata
or groups are homogeneous. If they are, we expect that the variability within-groups is lower
than the variability for the population as a whole. Stratified sampling capitalizes on that fact. For
example, let's say that the population of clients for our agency can be divided into three groups:
Caucasian, African-American and Hispanic-American. Furthermore, let's assume that both the
African-Americans and Hispanic-Americans are relatively small minorities of the clientele (10%
and 5% respectively).
If we just did a simple random sample of n=100 with a sampling fraction of 10%, we would
expect by chance alone that we would only get 10 and 5 persons from each of our two smaller
groups. And, by chance, we could get fewer than that! If we stratify, we can do better.
First, let's determine how many people we want to have in each group. Let's say we still want to
take a sample of 100 from the population of 1000 clients over the past year. But we think that in
order to say anything about subgroups we will need at least 25 cases in each group.
So, let's sample 50 Caucasians, 25 African-Americans, and 25 Hispanic-Americans. We know
that 10% of the population, or 100 clients, are African-American.
If we randomly sample 25 of these, we have a within-stratum sampling fraction of 25/100 =
25%. Similarly, we know that 5% or 50 clients are Hispanic-American. So our within-stratum
sampling fraction will be 25/50 = 50%. Finally, by subtraction we know that there are 850
Caucasian clients.
Jane Muchembi
21
Our within-stratum sampling fraction for them is 50/850 = about 5.88%. Because the groups are
more homogeneous within-group than across the population as a whole, we can expect greater
statistical precision (less variance). And, because we stratified, we know we will have enough
cases from each group to make meaningful subgroup inferences.
iv. Cluster/Area random sampling
The problem with random sampling methods when we have to sample a population that's
disbursed across a wide geographic region is that you will have to cover a lot of ground
geographically in order to get to each of the units you sampled. Imagine taking a simple random
sample of all the residents of New York State in order to conduct personal interviews. By the
luck of the draw you will wind up with respondents who come from all over the state. Your
interviewers are going to have a lot of traveling to do. It is for precisely this problem that cluster
or area random sampling was invented.
In cluster sampling, we follow these steps:
 divide population into clusters (usually along geographic boundaries)
 randomly sample clusters
 measure all units within sampled clusters
For instance, in the figure we see a map of the counties in New York State. Let's say that we
have to do a survey of town governments that will require us going to the towns personally. If we
do a simple random sample state-wide we'll have to cover the entire state geographically.
May be used when the list of the population is impossible or impractical to make e.g. in a study
on the factors that influence the choice clothing by Christians in the churches in Kenya, it may be
impossible to make a list of all of them.
1. The researcher can create a list of churches in Kenya
2. Randomly select the churches to be in the sample
3. Obtain the list of members in those churches
4. Randomly select the members to put in the sample from that list.
v. Multistage random sampling
The four methods we've covered so far -- simple, stratified, systematic and cluster -- are the
simplest random sampling strategies. In most real applied social research, we would use
sampling methods that are considerably more complex than these simple variations. The most
important principle here is that we can combine the simple methods described earlier in a variety
of useful ways that help us address our sampling needs in the most efficient and effective manner
possible. When we combine sampling methods, we call this multi-stage sampling. The sample
is selected in multiple steps e.g. in a study on the factors that influence the choice of shoes by the
university students in Kenya, The researcher can follow the following steps:-
1. Cluster sampling of counties in which the universities are located as the first stage of the
process.
2. We could then have a two-stage sampling process with stratified samples within cluster
samples to select the counties.
3. Randomly select the universities in each sub-county in the sample
4. Randomly select the schools in each university sampled
5. Randomly select the faculties
Jane Muchembi
22
6. Randomly select the departments
7. Randomly select the classes
8. Randomly select the individuals to be n the sample in each class
Non-probability sampling techniques
i. Quota sampling
ii. A quota sample is one in which the units are selected on the basis of pre-specified
characteristics so that the total sample has the same distribution of characteristics assumed to
exist in the whole population being studied e.g. if from a university the population of the male
is known to be 60% and female is 40% the researcher ensures that the 60% of the sample is
male and 40% is female. However, the individuals in the sample are not selected randomly.
iii. Convenience sampling
Selecting the sample from the most accessible population e.g. shoppers from the nearest
shopping mall if one is collecting data on attitudes of women towards a certain product like
ladies cossets.
Advantages Disadvantages
 Easy access
 Requires less effort
 Save time to select
 Saves money
 Can be biased
 It may not be a true or accurate
representation of the population
iv. Judgmental sampling or Purposive sampling
The sample is selected based on the knowledge the population has on the research topic and the
purpose of the study e.g. a study on choice of residential space by university students in Kenya
only the students know or have information and so the researcher has to deliberately use them in
the sample.
v. Snowballing
Used when the population is difficult to locate or identify e.g. when studying a sensitive
population like prostitutes, gays or lesbians.
i. The researcher identifies a few individuals, gathers information from them and requests
them to help identify others in the same category or group.
ii. The researcher then collects information from the ones referred by the previous group
and then asks them to help identify others and the process continues until the sample is
enough.
vi. Volunteer/ self-selection: The research collect information from anybody willing to participate.
This may introduce bias since volunteers are usually different from non-volunteers.
VALIDITY: The validity is the extent to which the data accurately measures what they were
intended to measure.
Jane Muchembi
23
THE FOUR TYPES OF VALIDITY.
i. Internal Validity: It is the approximate truth about inferences regarding cause-effect or causal
relationships. Thus, internal validity is only relevant in studies that try to establish a causal
relationship. It's not relevant in most observational or descriptive studies, for instance. But for
studies that assess the effects of social programs or interventions, internal validity is perhaps the
primary consideration. In those contexts, you would like to be able to conclude that your program
or treatment made a difference -- it improved test scores or reduced symptomology. But there may
be lots of reasons, other than your program, why test scores may improve or symptoms may
reduce. The key question in internal validity is whether observed changes can be attributed to your
program or intervention (i.e., the cause) and not to other possible causes (sometimes described as
"alternative explanations" for the outcome)
ii. Construct Validity: Construct validity refers to the degree to which inferences can legitimately
be made from the operationalization in your study to the theoretical constructs on which those
operationalization were based.
Like external validity, construct validity is related to generalizing. But, where external validity
involves generalizing from your study context to other people, places or times, construct validity
involves generalizing from your program or measures to the concept of your program or measures.
You might think of construct validity as a "labeling" issue. When you implement a program that
you call a "Head Start" program, is your label an accurate one? When you measure what you term
"self esteem" is that what you were really measuring?
iii. Conclusion Validity: Conclusion validity is the degree to which conclusions we reach about
relationships in our data are reasonable. Conclusion validity is only concerned with whether there
is a relationship. For instance, in a program evaluation, we might conclude that there is a positive
relationship between our educational program and achievement test scores -- students in the
program get higher scores and students not in the program get lower ones. Conclusion validity is
essentially whether that relationship is a reasonable one or not, given the data. But it is possible
that we will conclude that, while there is a relationship between the program and outcome, the
program didn't cause the outcome. Perhaps some other factor, and not our program, was
responsible for the outcome in this study. For instance, the observed differences in the outcome
could be due to the fact that the program group was smarter than the comparison group to begin
with. Our observed posttest differences between these groups could be due to this initial difference
and not be the result of our program. This issue -- the possibility that some other factor than our
program caused the outcome -- is what internal validity is all about. So, it is possible that in a
study we can conclude that our program and outcome are related (conclusion validity) and also
conclude that the outcome was caused by some factor other than the program (i.e., we don't have
internal validity).
iv. External Validity: External validity is related to generalizing. That's the major thing you need
to keep in mind. Recall that validity refers to the approximate truth of propositions, inferences, or
conclusions. So, external validity refers to the approximate truth of conclusions the involve
Jane Muchembi
24
generalizations. Put in more pedestrian terms, external validity is the degree to which the
conclusions in your study would hold for other persons in other places and at other times.
THREATS TO EXTERNAL VALIDITY
A threat to external validity is an explanation of how you might be wrong in making a
generalization. For instance, you conclude that the results of your study (which was done in a
specific place, with certain types of people, and at a specific time) can be generalized to another
context (for instance, another place, with slightly different people, at a slightly later time). There
are three major threats to external validity because there are three ways you could be wrong --
people, places or times. Your critics could come along, for example, and argue that the results of
your study are due to the unusual type of people who were in the study. Or, they could argue that it
might only work because of the unusual place you did the study in (perhaps you did your
educational study in a college town with lots of high-achieving educationally-oriented kids). Or,
they might suggest that you did your study in a peculiar time. For instance, if you did your
smoking cessation study the week after the Surgeon General issues the well-publicized results of
the latest smoking and cancer studies, you might get different results than if you had done it the
week before.
IMPROVING EXTERNAL VALIDITY
How can we improve external validity? One way, based on the sampling model, suggests that you
do a good job of drawing a sample from a population. For instance, you should use random
selection, if possible, rather than a nonrandom procedure. And, once selected, you should try to
assure that the respondents participate in your study and that you keep your dropout rates low. A
second approach would be to use the theory of proximal similarity more effectively. How? Perhaps
you could do a better job of describing the ways your contexts and others differ, providing lots of
data about the degree of similarity between various groups of people, places, and even times. You
might even be able to map out the degree of proximal similarity among various contexts with a
methodology like concept mapping. Perhaps the best approach to criticisms of generalizations is
simply to show them that they're wrong -- do your study in a variety of places, with different
people and at different times. That is, your external validity (ability to generalize) will be stronger
the more you replicate your study.
RELIABILITY: Reliability is the extent to which the data collection method will yield consistent
findings if replicated by others.
NB: Validity and reliability of the data you collect depend on the design of the questionnaire and
the words that that are used by the researcher.
3.6. DATA COLLECTION
It refers to the gathering of specific information to serve or prove some facts e.g. data may be
required to prove the need for changing the current price of given products.
Jane Muchembi
25
THE PURPOSE OF DATA COLLECTION
They include to:-
i. Stimulate new ideas e.g. helping to identify areas related to the research that need improvement or
further evaluation.
ii. Highlight a situation and create awareness and recommend improvement e.g. on the effects of
increased imported second hand “Mutumba” clothes on the local clothing and textile industry and
the economy as a whole.
iii. Influence legislative policies e.g. Minimum wages, taxation, import, export, education etc.
iv. Provide justification for an existing program or need for a new program e.g. need for training
African craft producers on marketing.
v. Promote decision making e.g. decision to increase production level.
TYPES AND SOURCES OF DATA
1. PRIMARY DATA: Is gathered directly from primary sources or the respondents through
questionnaires, interviews, observation or Focus Group discussion. It involves creating new
data.
2. SECONDARY DATA: Is gathered from secondary sources such as books, journals, magazines
etc. it is often referred to as desk research.
DATA COLLECTION INSTRUMENTS AND METHODS OR TECHNIQUES
Data collection methods include Questionnaires, Interviews, Observations and Focus Group
Discussions.
1. QUESTIONNAIRE
A questionnaire is a data collection method that uses an instrument or tool called a
questionnaire.
 This instrument comprises of a list of written down questions based on the research problem,
objectives and questions which if answered will help the researcher to answer the research
questions and meet the research objectives.
 The researcher gives the questionnaire to the respondents to fill on their own either in print form
or online and then analysis the data to make conclusions.
 To ensure effectiveness of the instrument a pre-test or pilot test should be carried out on a small
representative sample to enable the researcher find out if the questions are measuring what they
are supposed to measure and if the wording is clear i.e. All questionnaires should be piloted, if
possible, with a small group before the main research to assess their value, validity and
reliability.
The questions used may be:-
a) Closed questions: where a limited number of alternative responses to the set question are
provided. These can be in list, category, ranking, scale/rating, grid or other quantitative form.
They can be pre- coded on a questionnaire to facilitate analysis. e.g. Please tick the right answer
from the boxes shown below i.e. (specific choices of answers to choose from are provided) or
Jane Muchembi
26
Advantages of closed questions Disadvantages of closed questions
I. Often easier for respondents (particularly
those who are busy) to answer
ii. Easier to collate than open questions
iii. The questionnaire can be easily
reproduced by other researchers who wanted
to test your findings
i. They limit the choices (of answers) to
respondents and gives them less control over
their responses
ii. It is harder to get below the
surface of an issue
b) Open ended questions i.e. a question is posed, but space is left for the respondent’s own
answer i.e. no suggested answers.
Advantages of open ended questions Disadvantages of open ended questions
I. Enable you to get below the surface,
explore and probe
ii. Encourages respondents to think and offer
considered answers
iii. Encourages respondents to give honest
opinions
I. The responses can be hard to collate
ii. The research may be difficult for others to
reproduce, so your findings may be open to
doubt or
There are five types of questionnaire approaches:
1. On-line (electronic)
2. Postal (printed)
3. Delivery & collection (printed)
4. Telephone (electronic)
5. Interview face to face/group (electronic or printed)
SOME GENERAL RULES FOR DESIGNING QUESTIONNAIRES
(Source: Collis & Hussey, 2003)
1. Explain the purpose of the questionnaire to all participants
2. Keep your questions as simple as possible
3. Do not use jargon or specialist language (unless the recipients really prefer and understand it)
4. Phrase each question so that only one meaning is possible
5. Avoid vague, descriptive words, such as ‘large’ and ‘small’
6. Avoid asking negative questions as these are easy to misinterpret
7. Only ask one question at a time
8. Include relevant questions only
9. Include, if possible, questions which serve as cross-checks on the answers to other questions
10. Avoid questions which require participants to perform calculations
11. Avoid leading or value-laden questions which imply what the required answer might be
12. Avoid offensive questions or insensitive questions which could cause embarrassment
13. Avoid asking ‘difficult’ questions, e.g. where the respondent may struggle to answer (people
hate to look stupid by not knowing the ‘answer’).
14. Keep your questionnaire as short as possible, but include all the questions you need to cover
your purposes
Jane Muchembi
27
INCREASING RESPONSE RATES
 As a general rule, a response rate of 30 per cent or greater for a postal/externally sent
questionnaire is generally regarded as reasonable.
 However, a goal of 50 per cent or more responses should be attempted in any questionnaire that
involved face-to-face interviews.
 There are techniques that can help improve response rates to postal or electronic questionnaires:
i. Follow-up calls (especially telephone reminders and special delivery letters)
ii. Pre-contact with respondents(telling them about the questionnaire)
iii. Type of postage (special delivery is superior to ordinary mail; there is also some evidence that
hand-written white envelopes are more likely to be opened than brown/typed!)
iv. Rewards: prizes, or better still, cash incentives.
v. Personalizing the questionnaire: writing to the person by name, e.g. ‘Dear John’ etc.
vi. Emphasizing Confidentiality: ensuring that all views to be published remain anonymous, if
appropriate
vii. Appeals to the respondent: based on the social, personal or other benefits that might flow from
the participation of a respondent.
viii. Postal questionnaires should always include a stamped return envelope and have a covering
letter explaining the purpose of the questionnaire and the use intended for the findings in the
future.
ix. The researcher should include full contact details and the offer to discuss the questionnaire with
any respondent who has doubts or queries about it.
x. The researcher should always offer to share the research findings with any participant, if
requested, and this offer is best made in the covering letter.
QUALITIES OF A GOOD QUESTIONNAIRE
- It should be easy to understand. The language used is clear and straight forward. This helps to
reduce misconception.
- Instructions are clearly given. There are few words of explanation in each new section.
- The questions are focused and limited to a single idea. Sentences are short and precise.
- Each question included has a specific purpose, and contributes to the study.
- There are no leading questions.
- There is a balance of questions per topic.
BASIC PRINCIPLES TO BE OBSERVED WHEN PREPARING A QUESTIONNAIRE
i. Begin by giving a short rationale explaining the objectives of the study.
ii. Explain the potential benefits to the target population in terms they can easily understand.
iii. Make it as brief and simple to fill as possible and avoid irrelevant questions.
iv. Begin with straightforward non-threatening questions which the respondents will find easy to
answer. Personal questions should be left until the end.
v. Make the questionnaire attractive and spacious as a crowded questionnaire will discourage
responses.
Jane Muchembi
28
Advantages of using questionnaire Disadvantages of using questionnaire
i. Can be used to collect a lot of
information cheaply.
ii. No bias on the side of the
researcher
iii. Data analysis is easy because of use
of closed-ended questions
iv. Confidentiality can be achieved
i. No direct contact with the respondents and therefore
difficult to clarify misconceptions and
misunderstandings
ii. Responses can be low because of lack of direct contact
iii. No opportunity for probing or asking for further
information
iv. If some questions are not answered there is no chance
of asking why
2. INTERVIEW
An interview is a method of collecting data in which questions are asked orally and answers
recorded by the researcher or research assistant. This gives the interviewer an opportunity to
probe or ask for further clarification to get deeper understanding of the topic. The interviewer
can also clarify questions that may be misunderstood or misinterpreted.
FORMS OF INTERVIEWS
a) UNSTRUCTURED INTERVIEW
It is a method of collecting data in which:-
 The researcher has some idea and may be a list of the topics to be covered but no specific
questions to be asked to the respondents.
 They are informal and conversational with aim of encouraging the respondents to feel free to
open up and give information freely.
 It is suitable when studying sensitive topics such as sexuality, some cultural issues etc.
 Since no possible answers are suggested respondents give a wide variety of answers and
therefore data analysis can be difficult.
Advantages of unstructured interview Disadvantages of unstructured interview
i. They are flexible because there are no
predetermined questions
ii. Respondents freely give information
iii.Information given is spontaneous and so
reliable
iv. A lot of information can be gathered
v. The interviewer is able to respond to
individual differences and situational
characteristics.
i. They are time consuming because the
respondents may dwell too much on one on one
issue
ii. They are not systematic
iii. The respondents may get become emotional ,
personal and get out of control
iv. Responses may be irrelevant
v. It may be difficult to analyze data
b) SEMI STRUCTURED INTERVIEW
It is a method of collecting data in which:-
 The interviewer is guided by an interview guide or schedule. This a list of topics and questions to
be asked to the respondents.
Jane Muchembi
29
Advantages of semi-structured interview Disadvantages of semi-structured interview
i.They are flexible because they consist of both
open and closed questions
ii.In-depth Information given
iii.A lot of information can be gathered through
closed-ended questions
i. They are time consuming because the of open
ended questions
ii. It may be difficult to analyze data
iii. The respondents may be cautious of the
answers given in closed-ended questions
c) STRUCTURED INTERVIEW
It is a method of collecting data in which:-
 The interviewer is guided by an instrument called interview guide or schedule.
 All the respondents are subjected to the same questions.
Advantages of structured interview Disadvantages of structured interview
i. High reliability of information gathered
because all the subjects are subjected to the
same questions.
ii. It gives in-depth information about particular
cases of interest to the researcher. This is
because the researcher seeks information on
specific issues.
iii. It is systematic. Researchers intensively
investigate a particular issue before moving to
the next.
iv. It is time saving since the respondents simply
answer what has been asked by researcher.
v. The researcher gets a complete and detailed
understanding of the issue from the
respondents.
vi. It is comprehensive and systematic since
questions are formulated before the interview.
vii. The data collected is quantifiable.
i. The rigidity displayed by the researcher can
affect the responses given. The respondents
may feel as if he/she is under investigation and
being probed. This may affect the responses as
some may become hostile.
ii. It is too formal. Since the researcher does the
questioning and the respondents simply
answers, the respondent may be too cautious of
the answers given. The respondents may give
answers he/she thinks are acceptable or will
impress the researcher.
iii. The researcher may miss out on some
important points that are not included in the
questions formulated.
STEPS IN CONDUCT OF THE INTERVIEW
The opening stages of an interview are particularly important.
Saunders, Lewis and Thornhill (2003) make the following suggestions on conducting a semi-
structured interview:
i. The interviewee is thanked for agreeing to the meeting
ii. The purpose of the research, its funding (if relevant) and progress to date are briefly outlined
iii. The interviewee is given an assurance regarding confidentiality
iv. The interviewee’s right not to answer questions is emphasized and the interview could be
terminated at any time by the interviewee
v. The interviewee is told about the use intended to be made of the data collected during and after
the project
Jane Muchembi
30
vi. The offer of any written documentation to the interviewee promised in advance of the meeting
should be emphasized
vii. The interviewer describes the process of the interview, e.g. approximate number and range of
questions to be asked and the time it is likely to take.
viii. The researcher would want to intervene in the following situations:
a) If one group member was dominating the discussion
b) If the group strayed from discussing the topic in question
c) To encourage quieter members of the group to contribute to the discussion
d) To resolve any conflicts that arose between group members
PROBLEM AREAS ASSOCIATED WITH INTERVIEWS
There are a number of potential problem areas associated with interviews:
1. Bias
2. Demeanour (character, appearance, behaviour) of interviewer
3. Suspicion of the interviewer
4. Conduct of interview
5. Confidentiality
BIAS
 Bias is one of the most significant issues in interviewing, as it can affect the responses of the
interviewee to the interviewer, and vice versa.
 Interviews are human encounters and a range of issues can influence and colour the perceptions of
the people we encounter – including interviewers.
 We like or dislike someone, often without quite knowing why, and this can affect our responses to
them.
 A range of factors can come into play: gender, race, age, speech, appearance and attitude.
 Sexual bias is a particular significant factor. Rosenthal (1966) has suggested that there is the
possibility of sexual bias in interviewers and that both male and female researchers behave more
warmly towards female subjects than they do towards male subjects.
DEMEANOUR OF INTERVIEWER
 Generally speaking, we often like people who appear to like us!
 The interviewer should then, appear to be interested in the interviewee, but in a neutral and
detached way: ‘neutrally interested’ is perhaps the best way of describing the best interviewer-
interviewee relationship.
 The tone of voice of the interviewer is important, as it should project an impression of quiet
confidence and quiet enthusiasm in the topic under discussion.
 Torrington (1991) suggests that an open posture is best, where the interviewer sits slightly
forward toward the interviewee, keeps regular eye contact, and avoids folded arms.
 The interviewer must avoid appearing shocked, disbelieving or astonished by comments made by
interviewees.
 The interviewer wear clothes similar to those of the interviewees: too scruffy, or too over-dressed
can affect the credibility of the interviewer.
Jane Muchembi
31
SUSPICION OF THE INTERVIEWER
 People are increasingly suspicious of interviewers and their motives.
 Most people have experience of being stopped in the street by an interviewer who appears to
be asking questions in a neutral way but is really seeking to make a marketing contact for a
commercial organization.
 The true purpose of the interview should be carefully explained to the interviewee and how the
data collected will be used.
 Wherever possible, the student researcher should have a letter from a University tutor
explaining the research initiative, e.g. it is part of a legitimate first or post-graduate course.
 Wherever possible, the interviewer should send details of the interview process and agenda to
interviewees in advance, for example explaining the estimated length of time it will take, the
aim and purpose of the questions to be asked and the range of questions likely to be asked.
CONFIDENTIALITY
 Part of the suspicion shown to ward interviewers concerns the issue of confidentiality, and
interviewees may be worried about disclosing sensitive information in case it has negative
repercussions in some way against them.
 Interviewees may also be concerned that their personal details would be passed on to commercial
organisations and that they would be subsequently pestered to buy things.
 Interviewees must be given a complete reassurance about confidentiality and told who will see
the data obtained – and don’t forget this is likely to include at least two university tutors and
possibly one external examiner
 The interviewee should be assured that his or her views will be generalized in the final report or
that any direct quotes used would remain anonymous unless the interviewee wishes otherwise.
 The interviewer needs subsequently to take pains to avoid revealing the identity of respondents
by using false names and not giving any clues to the identity of any interviewee.
3. OBSERVATION
It a method or technique of collecting data that uses tool or instrument called observation schedule
or guide. It provides information about the actual behavior of the respondents.
FORMS OF OBSERVATION
a) Participant observation: is a qualitative data collection method in which the researcher
becomes an active functioning member of the population being investigated e.g. a designer
wishing to study university students dressing behavior enrolls as a student. Its emphasis is on
discovering meanings that people attach to their actions (Saunders, Lewis and Adrian 2004 and
Kombo and Tromp 2006).
b) Structured observation: I quantitative and more concerned with frequency of those actions.
The observer/researcher is an onlooker (Saunders, Lewis and Adrian 2004).
c) Unstructured observation: The observer/researcher takes the position of an onlooker. Data
collected is in descriptive accounts (Kombo and Tromp 2006).
Jane Muchembi
32
ADVANTAGES OF
PARTICIPANT
OBSERVATION
DISADVANTAGES OF PARTICIPANT OBSERVATION
It allows the researcher to
observe at first hand and get
below the surface of a particular
situation
Access to an organization for overt participation may be very
difficult
It heightens the awareness of a
researcher to social processes
that can influence behaviour
There may be role-conflict. Researchers may lose their objectivity
if they become too close emotionally to the people they are
observing.
It allows the researcher to
observe
the relationship of different
variables
The researcher may encounter suspicion and even hostility from
people, who suspect the motives for the research and may be
worried about their livelihoods.
It can enable a researcher to gain
insights into a situation that
otherwise would not have been
recognized or observed
The presence of a researcher (overt participation) can have an
impact on the behaviour of the people being observed: the
‘observer
effect’. They may change the way they behave if they are aware
they
are being observed.
It can allow, in the case of overt
participation, the researcher to
gain the trust of the people being
observed
It is very time-consuming and can generate a large amount of
data/commentary that will need to be collated
Recording and collating data from observations can be difficult
and the researcher may need to adopt structured observation,
where
tasks/responses etc. are identified and broken down into elements
and the frequency of actions or responses noted and later collated.
Taking notes in any covert situation presents real problems, as the
researcher may not be a position to openly record observations. In
this situation, the researcher must record his or her observations
as
soon as possible afterwards.
4. FOCUS GROUP DISCUSSIONS
It a method or technique of collecting data in which data is collected through focus group
discussions.
According to Sekaran (2003) Focus Group Discussions:-
 Comprise of 8-10 members with homogeneous characteristics relevant to the study, a moderator
and recorder. The moderator leads the discussions on a specific and given topic for about two
hours and recorder records all the proceedings.
 Members are chosen on the basis of their expertise on the topic being discussed.
 The unstructured and spontaneous responses are expected to reflect genuine opinions ideas and
feelings of the members about the topic being discussed
Jane Muchembi
33
STEPS TO FOLLOW WHEN COLLECTING DATA
i. Acquire an introduction letter from the body or institution commissioning him/her to go and do
research. This letter introduces the researcher to the people from whom assistance may be
needed.
ii. ii. Acquire a permit (permission to collect the data in the given area e.g. from the local
authorities to avoid conflicts with them.
iii. Arrange with the respondents when to meet (book appointment) i.e. do not ambush them as this
could make them fail to cooperate.
iv. Administer the instruments e.g. questionnaires
v. Follow up non-respondents to increase responses e.g. by visiting them or making phone calls.
ETHICAL ISSUES IN DATA COLLECTION
They include:-
i. The researcher must justify the research through balance of costs and benefits. Benefits should
outweigh the costs.
ii. The researcher must maintain confidentiality at all times. Only those who must know the
respondents should know them. Unless it is inevitable to avoid knowing the identity of the
respondents the research should avoid knowing them.
iii. The researchers should be responsible of their own work and their contribution to the whole
study. Accept individual responsibility and bear the consequences of the research.
iv. The researcher must obtain informed consent from the subjects used in the study and must
ensure that all the subjects participate voluntarily.
v. The researcher must be open and honest in dealing with other researchers and research
subjects i.e. must not exploit them by changing the agreements made with them.
vi. The researcher must take all reasonable measures to protect the respondents physically and
psychologically.
vii. The researcher must fully explain the research in advance and debrief the subjects afterwards.
Saunders, Lewis and Thornhill (2003, p. 131) summarise the main issues
to consider, although the ethical issues surrounding these items are not
always clear-cut:
i. The rights of privacy of individuals
ii. Voluntary nature of participation – and the rights of individuals to withdraw partially or
completely from the process
iii. Consent and possible deception of participants
iv. Maintenance of the confidentiality of data provided by individuals or identifiable
participants and their anonymity
v. Reactions of participants to the ways in which researchers seek to collect data
vi. Effects on participants of the way in which data is analyzed and reported
vii. Behaviour and objectivity of the researcher
3.7 DATA ANALYSIS AND PRESENTATION
Raw data means nothing to the researcher without it being analyzed and interpreted using proper
tools. Data analysis refer to examining the data that has been collected and making deductions or
Jane Muchembi
34
inferences or judgments or conclusions. It involves uncovering underlying structures, extracting
important variables, detecting any anomalies and testing any underlying assumptions. It involves
scrutinizing the acquired information and making inferences.
Data analysis involves examining data in ways that reveal the relationships, patterns, trends, etc. that
can be found within it. That may mean subjecting it to statistical operations that can tell you not only
what kinds of relationships seem to exist among variables, but also to what level you can trust the
answers you’re getting. It may mean comparing your information to that from other groups (a
control or comparison group, statewide figures, etc.), to help draw some conclusions from the
data. The point, in terms of your evaluation, is to get an accurate assessment in order to better
understand your work and its effects on those you’re concerned with, or in order to better understand
the overall situation.
There are two kinds of data the researcher may be working with, although not all evaluations will
necessarily include both:-
i. Quantitative data
This refers to the information that is collected as, or can be translated into, numbers, which can then
be displayed and analyzed mathematically. Some examples include:
 The frequency (rate, duration) of specific behaviors or conditions
 Test scores (e.g., scores/levels of knowledge, skill, etc.)
 Survey results (e.g., reported behavior, or outcomes to environmental conditions; ratings of
satisfaction, stress, etc.)
 Numbers or percentages of people with certain characteristics in a population (e.g. have design
skills, have carpeted offices, wear high heeled shoes, buy second hand clothes etc.)
Data can also be collected in forms other than numbers, and turned into quantitative data for
analysis. Researchers can count the number of times an event is documented in interviews or
records, for instance, or assign numbers to the levels of intensity of an observed event or
behavior. For instance, community initiatives often want to document the amount and intensity of
environmental changes they bring about – the new programs and policies that result from their
efforts. Whether or not this kind of translation is necessary or useful depends on the nature of what
you’re observing and on the kinds of questions your evaluation is meant to answer.
Quantitative data is usually subjected to statistical procedures such as calculating the mean or
average number of times an event or behavior occurs (per day, month, year). These operations,
because numbers are “hard” data and not interpretation, can give definitive, or nearly definitive,
answers to different questions. Various kinds of quantitative analysis can indicate changes in a
dependent variable related to – frequency, duration, timing (when particular things happen),
intensity, level, etc. They can allow you to compare those changes to one another, to changes in
another variable, or to changes in another population. They might be able to tell you, at a particular
degree of reliability, whether those changes are likely to have been caused by your intervention or
program, or by another factor, known or unknown. And they can identify relationships among
different variables, which may or may not mean that one causes another.
ii. Qualitative data
Jane Muchembi
35
These are data collected as descriptions, anecdotes, opinions, quotes, interpretations, etc., and are
generally either not able to be reduced to numbers, or are considered more valuable or informative
if left as narratives. As you might expect, quantitative and qualitative information needs to be
analyzed differently.
Unlike numbers or “hard data,” qualitative information tends to be “soft,” meaning it can’t always
be reduced to something definite. That is in some ways a weakness, but it’s also a strength. A
number may tell you how well a student did on a test; the look on her face after seeing her grade,
however, may tell you even more about the effect of that result on her. That look can’t be translated
to a number, nor can a teacher’s knowledge of that student’s history, progress, and experience, all
of which go into the teacher’s interpretation of that look. And that interpretation may be far more
valuable in helping that student succeed than knowing her grade or numerical score on the test.
Qualitative data can sometimes be changed into numbers, usually by counting the number of times
specific things occur in the course of observations or interviews, or by assigning numbers or ratings
to dimensions (e.g., importance, satisfaction, ease of use). The challenges of translating qualitative
into quantitative data have to do with the human factor. Even if most people agree on what 1
(lowest) or 5 (highest) means in regard to rating “satisfaction” with a program, ratings of 2, 3, and 4
may be very different for different people. Furthermore, the numbers say nothing about why people
reported the way they did. One may dislike the program because of the content, the facilitator, the
time of day, etc. The same may be true when you’re counting instances of the mention of an event,
such as the onset of a new policy or program in a community based on interviews or archival
records. Where one person might see a change in program he considers important another may
omit it due to perceived unimportance.
Qualitative data can sometimes tell you things that quantitative data can’t. It may reveal why
certain methods are working or not working, whether part of what you’re doing conflicts with
participants’ culture, what participants see as important, etc. It may also show you patterns – in
behavior, physical or social environment, or other factors – that the numbers in your quantitative
data don’t, and occasionally even identify variables that researchers weren’t aware of.
NB: It is often helpful to collect both quantitative and qualitative information.
Quantitative analysis is considered to be objective – without any human bias attached to it –
because it depends on the comparison of numbers according to mathematical computations.
Analysis of qualitative data is generally accomplished by methods more subjective – dependent
on people’s opinions, knowledge, assumptions, and inferences (and therefore biases) – than that of
quantitative data. The identification of patterns, the interpretation of people’s statements or other
communication, the spotting of trends – all of these can be influenced by the way the researcher
sees the world. Be aware, however, that quantitative analysis is influenced by a number of
subjective factors as well. What the researcher chooses to measure, the accuracy of the
observations, and the way the research is structured to ask only particular questions can all
influence the results, as can the researcher’s understanding and interpretation of the subsequent
analyses.
Jane Muchembi
36
STEPS OF DATA ANALYSIS
These days there are several user-friendly and interactive software programs that are used to
analyze data such as Excel, SPSS, SAS, STATPAK, SYSTAT etc. They have an ability to interface
with different databases and generate graphs and charts.
In most social research the data analysis involves three major steps, done in roughly this order:
i. Cleaning and organizing the data for analysis (Data Preparation)
ii. Describing the data (Descriptive Statistics)
iii. Testing Hypotheses and Models (Inferential Statistics)
i. Cleaning and organizing the data for analysis/Preparing Data
 Data Preparation involves checking or logging the data in; checking the data for accuracy;
entering the data into the computer; transforming the data; and developing and documenting a
database structure that integrates the various measures.
 Once all of the participants have completed the study measures and all of the data has been
collected, the researcher must prepare the data to be analyzed.
 It involves:-
i. Editing data: This involve checking data for accuracy and consistency.
As soon as data is received you should screen it for accuracy. In some circumstances doing this
right away will allow you to go back to the sample to clarify any problems or errors. There are
several questions you should ask as part of this initial data screening:
 Are the responses legible/readable?
 Are all important questions answered? Sometimes a respondent may fail to answer a
question like do you have any children? But answers the following related question “If
yes how many? By writing five children. The researcher has to get back to the respondent
to find out why the first question was left out or assume that the answer is yes.
 Are the responses complete?
 Is all relevant contextual information included (e.g., data, time, place, researcher)?
In most social research, quality of measurement is a major issue. Assuring that the data
collection process does not contribute inaccuracies will help assure the overall quality of
subsequent analyses.
ii. Handling blank responses: If many questions e.g. 25% of the questions are not answered you
may decide to discard the questionnaire and not include it in data set for analysis and report or
account for them in your report. If there are only a few blank responses then decide how to
handle them.
iii. Coding data: involves allocating codes to possible answers e.g. in a question where possible
answers are yes or no, you may assign number one (1) to “yes” and (2) to “No”. Where there are
five possible answers you can have codes 1-5.
iv. Categorizing data: This involve grouping questions addressing the same variable together.
v. Creating data file/ entering the Data into the Computer
Key in or enter the data in the computer using a program of your choice e.g. spreadsheet, SPSS
Jane Muchembi
37
There are a wide variety of ways to enter the data into the computer for analysis. Probably the
easiest is to just type the data in directly. In order to assure a high level of data accuracy, the
analyst should use a procedure called double entry. In this procedure you enter the data once.
Then, you use a special program that allows you to enter the data a second time and checks each
second entry against the first. If there is a discrepancy, the program notifies the user and allows
the user to determine the correct entry. This double entry procedure significantly reduces entry
errors. However, these double entry programs are not widely available and require some training.
An alternative is to enter the data once and set up a procedure for checking the data for accuracy.
For instance, you might spot check records on a random basis. Once the data have been entered,
you will use various programs to summarize the data that allow you to check that all the data are
within acceptable limits and boundaries. For instance, such summaries will enable you to easily
spot whether there are persons whose age is 601 or who have a 7 entered where you expect a 1-
to-5 response
vi. Programming :
NB:
 Organizing the data correctly can save a lot of time and prevent mistakes.
 Most researchers choose to use a database or statistical analysis program (Microsoft Excel, SPSS)
that they can format to fit their needs in order to organize their data effectively.
 A good researcher enters all of the data in the same format and in the same database, as doing
otherwise might lead to confusion and difficulty with the statistical analysis later on.
 Once the data has been entered, it is crucial that the researcher check the data for accuracy.
 This can be accomplished by spot-checking a random assortment of participant data groups, but
this method is not as effective as re-entering the data a second time and searching for
discrepancies.
 This method is particularly easy to do when using numerical data because the researcher can
simply use the database program to sum the columns of the spreadsheet and then look for
differences in the totals.
 Perhaps the best method of accuracy checking is to use a specialized computer program that cross-
checks double-entered data for discrepancies (as this method is free from error), though these
programs can be hard to come by and may require extra training to use correctly.
Developing a Database Structure
The database structure is the manner in which you intend to store the data for the study so that it
can be accessed in subsequent data analyses. You might use the same structure you used for
logging in the data or, in large complex studies, you might have one structure for logging data
and another for storing it. As mentioned above, there are generally two options for storing data
on computer:-
i. Database programs
ii. Statistical programs.
Usually database programs are the more complex of the two to learn and operate, but they allow
the analyst greater flexibility in manipulating the data.
Jane Muchembi
38
In every research project, you should generate a printed codebook that describes the data and
indicates where and how it can be accessed. Minimally the codebook should include the
following items for each variable:
 variable name
 variable description
 variable format (number, data, text)
 instrument/method of collection
 date collected
 respondent or group
 variable location (in database)
 notes
The codebook is an indispensable tool for the analysis team. Together with the database, it
should provide comprehensive documentation that enables other researchers who might
subsequently want to analyze the data to do so without any additional information.
Data Transformations
Once the data have been entered it is almost always necessary to transform the raw data into
variables that are usable in the analyses. There are a wide variety of transformations that you
might perform. Some of the more common are:
 missing values
Many analysis programs automatically treat blank values as missing. In others, you need to
designate specific values to represent missing values. For instance, you might use a value of -99
to indicate that the item is missing. You need to check the specific program you are using to
determine how to handle missing values.
 item reversals
On scales and surveys, we sometimes use reversal items to help reduce the possibility of a
response set. When you analyze the data, you want all scores for scale items to be in the same
direction where high scores mean the same thing and low scores mean the same thing. In these
cases, you have to reverse the ratings for some of the scale items. For instance, let's say you had
a five point response scale for a self-esteem measure where 1 meant strongly disagree and 5
meant strongly agree. One item is "I generally feel good about myself." If the respondent
strongly agrees with this item they will put a 5 and this value would be indicative of higher self
esteem. Alternatively, consider an item like "Sometimes I feel like I'm not worth much as a
person." Here, if a respondent strongly agrees by rating this a 5 it would indicate low self esteem.
To compare these two items, we would reverse the scores of one of them (probably we'd reverse
the latter item so that high values will always indicate higher self esteem). We want a
transformation where if the original value was 1 it's changed to 5, 2 is changed to 4, 3 remains
the same, 4 is changed to 2 and 5 is changed to 1. While you could program these changes as
separate statements in most program, it's easier to do this with a simple formula like:
New Value = (High Value + 1) - Original Value
In our example, the High Value for the scale is 5, so to get the new (transformed) scale value, we
simply subtract each Original Value from 6 (i.e., 5 + 1).
 scale totals
Eco 300
Eco 300
Eco 300
Eco 300
Eco 300
Eco 300
Eco 300
Eco 300
Eco 300
Eco 300
Eco 300

More Related Content

What's hot

Chapter-13-14.pdf
Chapter-13-14.pdfChapter-13-14.pdf
Chapter-13-14.pdfayushi1306
 
Data analysis
Data analysisData analysis
Data analysisneha147
 
Chp5 - Research Methods for Business By Authors Uma Sekaran and Roger Bougie
Chp5  - Research Methods for Business By Authors Uma Sekaran and Roger BougieChp5  - Research Methods for Business By Authors Uma Sekaran and Roger Bougie
Chp5 - Research Methods for Business By Authors Uma Sekaran and Roger BougieHassan Usman
 
Lesson 1 charcteristics of quant r
Lesson 1 charcteristics of quant rLesson 1 charcteristics of quant r
Lesson 1 charcteristics of quant rmjlobetos
 

What's hot (6)

Chapter-13-14.pdf
Chapter-13-14.pdfChapter-13-14.pdf
Chapter-13-14.pdf
 
Data analysis
Data analysisData analysis
Data analysis
 
Chp5 - Research Methods for Business By Authors Uma Sekaran and Roger Bougie
Chp5  - Research Methods for Business By Authors Uma Sekaran and Roger BougieChp5  - Research Methods for Business By Authors Uma Sekaran and Roger Bougie
Chp5 - Research Methods for Business By Authors Uma Sekaran and Roger Bougie
 
Lesson 1 charcteristics of quant r
Lesson 1 charcteristics of quant rLesson 1 charcteristics of quant r
Lesson 1 charcteristics of quant r
 
Desres final
Desres finalDesres final
Desres final
 
COR-RELATIONAL DESIGN
COR-RELATIONAL DESIGNCOR-RELATIONAL DESIGN
COR-RELATIONAL DESIGN
 

Similar to Eco 300

MBA Project Step by Step Guide
MBA Project Step by Step Guide MBA Project Step by Step Guide
MBA Project Step by Step Guide Dr.Aravind TS
 
Research design dr. raj agrawal
Research design dr. raj agrawalResearch design dr. raj agrawal
Research design dr. raj agrawalRavindra Sharma
 
designing proposal for research projects budget and funding schemes
designing proposal for research projects budget and funding schemesdesigning proposal for research projects budget and funding schemes
designing proposal for research projects budget and funding schemesabhisrivastava11
 
Practical Research 2, MELCS - Slides ppt (CS_RS12-If-j-6).pptx
Practical Research 2, MELCS - Slides ppt (CS_RS12-If-j-6).pptxPractical Research 2, MELCS - Slides ppt (CS_RS12-If-j-6).pptx
Practical Research 2, MELCS - Slides ppt (CS_RS12-If-j-6).pptxTristanBabaylan1
 
Workshop on graduation attachment_085511.pptx
Workshop on graduation attachment_085511.pptxWorkshop on graduation attachment_085511.pptx
Workshop on graduation attachment_085511.pptxabdulrasheedafeez202
 
INQUIRIES INVESTIGATIONS & IMMERSIONS.pptx
INQUIRIES INVESTIGATIONS & IMMERSIONS.pptxINQUIRIES INVESTIGATIONS & IMMERSIONS.pptx
INQUIRIES INVESTIGATIONS & IMMERSIONS.pptxZesaZasm
 
Designs a Research Used in Daily Life.pptx
Designs a Research Used in Daily Life.pptxDesigns a Research Used in Daily Life.pptx
Designs a Research Used in Daily Life.pptxMaryJoySalas1
 
Framework for Program Development and EvaluationReference.docx
Framework for Program Development and EvaluationReference.docxFramework for Program Development and EvaluationReference.docx
Framework for Program Development and EvaluationReference.docxhanneloremccaffery
 
Chapter 13 An evaluation framework
Chapter 13 An evaluation frameworkChapter 13 An evaluation framework
Chapter 13 An evaluation frameworkvuongdq93
 
How to create Chapter One of Your Thesis 1.ppt
How to create Chapter One of Your Thesis 1.pptHow to create Chapter One of Your Thesis 1.ppt
How to create Chapter One of Your Thesis 1.pptJessaBejer1
 
Research design
Research design Research design
Research design Anees Khan
 

Similar to Eco 300 (20)

MBA Project Step by Step Guide
MBA Project Step by Step Guide MBA Project Step by Step Guide
MBA Project Step by Step Guide
 
Prac Res 2_Q1M3.pdf
Prac Res 2_Q1M3.pdfPrac Res 2_Q1M3.pdf
Prac Res 2_Q1M3.pdf
 
Research design dr. raj agrawal
Research design dr. raj agrawalResearch design dr. raj agrawal
Research design dr. raj agrawal
 
Chapter-6.pdf
Chapter-6.pdfChapter-6.pdf
Chapter-6.pdf
 
Research
ResearchResearch
Research
 
designing proposal for research projects budget and funding schemes
designing proposal for research projects budget and funding schemesdesigning proposal for research projects budget and funding schemes
designing proposal for research projects budget and funding schemes
 
Practical Research 2, MELCS - Slides ppt (CS_RS12-If-j-6).pptx
Practical Research 2, MELCS - Slides ppt (CS_RS12-If-j-6).pptxPractical Research 2, MELCS - Slides ppt (CS_RS12-If-j-6).pptx
Practical Research 2, MELCS - Slides ppt (CS_RS12-If-j-6).pptx
 
Workshop on graduation attachment_085511.pptx
Workshop on graduation attachment_085511.pptxWorkshop on graduation attachment_085511.pptx
Workshop on graduation attachment_085511.pptx
 
Research Design _komal-1.docx
Research Design _komal-1.docxResearch Design _komal-1.docx
Research Design _komal-1.docx
 
INQUIRIES INVESTIGATIONS & IMMERSIONS.pptx
INQUIRIES INVESTIGATIONS & IMMERSIONS.pptxINQUIRIES INVESTIGATIONS & IMMERSIONS.pptx
INQUIRIES INVESTIGATIONS & IMMERSIONS.pptx
 
Designs a Research Used in Daily Life.pptx
Designs a Research Used in Daily Life.pptxDesigns a Research Used in Daily Life.pptx
Designs a Research Used in Daily Life.pptx
 
Framework for Program Development and EvaluationReference.docx
Framework for Program Development and EvaluationReference.docxFramework for Program Development and EvaluationReference.docx
Framework for Program Development and EvaluationReference.docx
 
good proposal ppt2.pptx
good proposal ppt2.pptxgood proposal ppt2.pptx
good proposal ppt2.pptx
 
Chapter 13 An evaluation framework
Chapter 13 An evaluation frameworkChapter 13 An evaluation framework
Chapter 13 An evaluation framework
 
Business Research Metods B.Com
Business Research Metods  B.ComBusiness Research Metods  B.Com
Business Research Metods B.Com
 
B0740410
B0740410B0740410
B0740410
 
Marketing Research
Marketing ResearchMarketing Research
Marketing Research
 
Research Design new.ppt
Research Design new.pptResearch Design new.ppt
Research Design new.ppt
 
How to create Chapter One of Your Thesis 1.ppt
How to create Chapter One of Your Thesis 1.pptHow to create Chapter One of Your Thesis 1.ppt
How to create Chapter One of Your Thesis 1.ppt
 
Research design
Research design Research design
Research design
 

More from AgwonaMAllan

More from AgwonaMAllan (8)

Ees 300
Ees 300Ees 300
Ees 300
 
Eae 305
Eae 305Eae 305
Eae 305
 
Eae 408
Eae 408Eae 408
Eae 408
 
Eae 405 development planning (geof)
Eae 405 development planning (geof)Eae 405 development planning (geof)
Eae 405 development planning (geof)
 
Eae 304
Eae 304Eae 304
Eae 304
 
Eae 303 managerial economics notes-2
Eae 303 managerial economics   notes-2Eae 303 managerial economics   notes-2
Eae 303 managerial economics notes-2
 
BAC 100
BAC 100BAC 100
BAC 100
 
Eae 100
Eae 100Eae 100
Eae 100
 

Recently uploaded

Disha NEET Physics Guide for classes 11 and 12.pdf
Disha NEET Physics Guide for classes 11 and 12.pdfDisha NEET Physics Guide for classes 11 and 12.pdf
Disha NEET Physics Guide for classes 11 and 12.pdfchloefrazer622
 
The basics of sentences session 2pptx copy.pptx
The basics of sentences session 2pptx copy.pptxThe basics of sentences session 2pptx copy.pptx
The basics of sentences session 2pptx copy.pptxheathfieldcps1
 
Unit-IV- Pharma. Marketing Channels.pptx
Unit-IV- Pharma. Marketing Channels.pptxUnit-IV- Pharma. Marketing Channels.pptx
Unit-IV- Pharma. Marketing Channels.pptxVishalSingh1417
 
1029 - Danh muc Sach Giao Khoa 10 . pdf
1029 -  Danh muc Sach Giao Khoa 10 . pdf1029 -  Danh muc Sach Giao Khoa 10 . pdf
1029 - Danh muc Sach Giao Khoa 10 . pdfQucHHunhnh
 
Class 11th Physics NEET formula sheet pdf
Class 11th Physics NEET formula sheet pdfClass 11th Physics NEET formula sheet pdf
Class 11th Physics NEET formula sheet pdfAyushMahapatra5
 
Ecosystem Interactions Class Discussion Presentation in Blue Green Lined Styl...
Ecosystem Interactions Class Discussion Presentation in Blue Green Lined Styl...Ecosystem Interactions Class Discussion Presentation in Blue Green Lined Styl...
Ecosystem Interactions Class Discussion Presentation in Blue Green Lined Styl...fonyou31
 
Beyond the EU: DORA and NIS 2 Directive's Global Impact
Beyond the EU: DORA and NIS 2 Directive's Global ImpactBeyond the EU: DORA and NIS 2 Directive's Global Impact
Beyond the EU: DORA and NIS 2 Directive's Global ImpactPECB
 
Russian Escort Service in Delhi 11k Hotel Foreigner Russian Call Girls in Delhi
Russian Escort Service in Delhi 11k Hotel Foreigner Russian Call Girls in DelhiRussian Escort Service in Delhi 11k Hotel Foreigner Russian Call Girls in Delhi
Russian Escort Service in Delhi 11k Hotel Foreigner Russian Call Girls in Delhikauryashika82
 
IGNOU MSCCFT and PGDCFT Exam Question Pattern: MCFT003 Counselling and Family...
IGNOU MSCCFT and PGDCFT Exam Question Pattern: MCFT003 Counselling and Family...IGNOU MSCCFT and PGDCFT Exam Question Pattern: MCFT003 Counselling and Family...
IGNOU MSCCFT and PGDCFT Exam Question Pattern: MCFT003 Counselling and Family...PsychoTech Services
 
microwave assisted reaction. General introduction
microwave assisted reaction. General introductionmicrowave assisted reaction. General introduction
microwave assisted reaction. General introductionMaksud Ahmed
 
The Most Excellent Way | 1 Corinthians 13
The Most Excellent Way | 1 Corinthians 13The Most Excellent Way | 1 Corinthians 13
The Most Excellent Way | 1 Corinthians 13Steve Thomason
 
APM Welcome, APM North West Network Conference, Synergies Across Sectors
APM Welcome, APM North West Network Conference, Synergies Across SectorsAPM Welcome, APM North West Network Conference, Synergies Across Sectors
APM Welcome, APM North West Network Conference, Synergies Across SectorsAssociation for Project Management
 
Accessible design: Minimum effort, maximum impact
Accessible design: Minimum effort, maximum impactAccessible design: Minimum effort, maximum impact
Accessible design: Minimum effort, maximum impactdawncurless
 
Introduction to Nonprofit Accounting: The Basics
Introduction to Nonprofit Accounting: The BasicsIntroduction to Nonprofit Accounting: The Basics
Introduction to Nonprofit Accounting: The BasicsTechSoup
 
Q4-W6-Restating Informational Text Grade 3
Q4-W6-Restating Informational Text Grade 3Q4-W6-Restating Informational Text Grade 3
Q4-W6-Restating Informational Text Grade 3JemimahLaneBuaron
 
Key note speaker Neum_Admir Softic_ENG.pdf
Key note speaker Neum_Admir Softic_ENG.pdfKey note speaker Neum_Admir Softic_ENG.pdf
Key note speaker Neum_Admir Softic_ENG.pdfAdmir Softic
 
BAG TECHNIQUE Bag technique-a tool making use of public health bag through wh...
BAG TECHNIQUE Bag technique-a tool making use of public health bag through wh...BAG TECHNIQUE Bag technique-a tool making use of public health bag through wh...
BAG TECHNIQUE Bag technique-a tool making use of public health bag through wh...Sapna Thakur
 
Activity 01 - Artificial Culture (1).pdf
Activity 01 - Artificial Culture (1).pdfActivity 01 - Artificial Culture (1).pdf
Activity 01 - Artificial Culture (1).pdfciinovamais
 

Recently uploaded (20)

Disha NEET Physics Guide for classes 11 and 12.pdf
Disha NEET Physics Guide for classes 11 and 12.pdfDisha NEET Physics Guide for classes 11 and 12.pdf
Disha NEET Physics Guide for classes 11 and 12.pdf
 
The basics of sentences session 2pptx copy.pptx
The basics of sentences session 2pptx copy.pptxThe basics of sentences session 2pptx copy.pptx
The basics of sentences session 2pptx copy.pptx
 
Unit-IV- Pharma. Marketing Channels.pptx
Unit-IV- Pharma. Marketing Channels.pptxUnit-IV- Pharma. Marketing Channels.pptx
Unit-IV- Pharma. Marketing Channels.pptx
 
Advance Mobile Application Development class 07
Advance Mobile Application Development class 07Advance Mobile Application Development class 07
Advance Mobile Application Development class 07
 
1029 - Danh muc Sach Giao Khoa 10 . pdf
1029 -  Danh muc Sach Giao Khoa 10 . pdf1029 -  Danh muc Sach Giao Khoa 10 . pdf
1029 - Danh muc Sach Giao Khoa 10 . pdf
 
Class 11th Physics NEET formula sheet pdf
Class 11th Physics NEET formula sheet pdfClass 11th Physics NEET formula sheet pdf
Class 11th Physics NEET formula sheet pdf
 
Ecosystem Interactions Class Discussion Presentation in Blue Green Lined Styl...
Ecosystem Interactions Class Discussion Presentation in Blue Green Lined Styl...Ecosystem Interactions Class Discussion Presentation in Blue Green Lined Styl...
Ecosystem Interactions Class Discussion Presentation in Blue Green Lined Styl...
 
Beyond the EU: DORA and NIS 2 Directive's Global Impact
Beyond the EU: DORA and NIS 2 Directive's Global ImpactBeyond the EU: DORA and NIS 2 Directive's Global Impact
Beyond the EU: DORA and NIS 2 Directive's Global Impact
 
INDIA QUIZ 2024 RLAC DELHI UNIVERSITY.pptx
INDIA QUIZ 2024 RLAC DELHI UNIVERSITY.pptxINDIA QUIZ 2024 RLAC DELHI UNIVERSITY.pptx
INDIA QUIZ 2024 RLAC DELHI UNIVERSITY.pptx
 
Russian Escort Service in Delhi 11k Hotel Foreigner Russian Call Girls in Delhi
Russian Escort Service in Delhi 11k Hotel Foreigner Russian Call Girls in DelhiRussian Escort Service in Delhi 11k Hotel Foreigner Russian Call Girls in Delhi
Russian Escort Service in Delhi 11k Hotel Foreigner Russian Call Girls in Delhi
 
IGNOU MSCCFT and PGDCFT Exam Question Pattern: MCFT003 Counselling and Family...
IGNOU MSCCFT and PGDCFT Exam Question Pattern: MCFT003 Counselling and Family...IGNOU MSCCFT and PGDCFT Exam Question Pattern: MCFT003 Counselling and Family...
IGNOU MSCCFT and PGDCFT Exam Question Pattern: MCFT003 Counselling and Family...
 
microwave assisted reaction. General introduction
microwave assisted reaction. General introductionmicrowave assisted reaction. General introduction
microwave assisted reaction. General introduction
 
The Most Excellent Way | 1 Corinthians 13
The Most Excellent Way | 1 Corinthians 13The Most Excellent Way | 1 Corinthians 13
The Most Excellent Way | 1 Corinthians 13
 
APM Welcome, APM North West Network Conference, Synergies Across Sectors
APM Welcome, APM North West Network Conference, Synergies Across SectorsAPM Welcome, APM North West Network Conference, Synergies Across Sectors
APM Welcome, APM North West Network Conference, Synergies Across Sectors
 
Accessible design: Minimum effort, maximum impact
Accessible design: Minimum effort, maximum impactAccessible design: Minimum effort, maximum impact
Accessible design: Minimum effort, maximum impact
 
Introduction to Nonprofit Accounting: The Basics
Introduction to Nonprofit Accounting: The BasicsIntroduction to Nonprofit Accounting: The Basics
Introduction to Nonprofit Accounting: The Basics
 
Q4-W6-Restating Informational Text Grade 3
Q4-W6-Restating Informational Text Grade 3Q4-W6-Restating Informational Text Grade 3
Q4-W6-Restating Informational Text Grade 3
 
Key note speaker Neum_Admir Softic_ENG.pdf
Key note speaker Neum_Admir Softic_ENG.pdfKey note speaker Neum_Admir Softic_ENG.pdf
Key note speaker Neum_Admir Softic_ENG.pdf
 
BAG TECHNIQUE Bag technique-a tool making use of public health bag through wh...
BAG TECHNIQUE Bag technique-a tool making use of public health bag through wh...BAG TECHNIQUE Bag technique-a tool making use of public health bag through wh...
BAG TECHNIQUE Bag technique-a tool making use of public health bag through wh...
 
Activity 01 - Artificial Culture (1).pdf
Activity 01 - Artificial Culture (1).pdfActivity 01 - Artificial Culture (1).pdf
Activity 01 - Artificial Culture (1).pdf
 

Eco 300

  • 1. Jane Muchembi 1 RESEARCH METHODS Research: Is a process of enquiry and investigation that is systematic, methodical and ethical (www.brad.ac.uk/intrduction-to-research) According to Orodho and Kombo (2002) research is a process of arriving at dependable solutions to problems through planned systematic collection, analysis and interpretation of data. Researchproposal: Is plan, suggestion or request to conduct research which comprises of introduction, literature review and research methodology (Kombo and Tromp 2006). It consists of three chapters:- Chapter one: Introduction Chapter two: Literature review Chapter three: Research methodology Researchproject or thesis: Is a written scientific report that deals with the concerns related to the problem or series of problems in one’s area of research (Kombo and Tromp 2006). It comprises of five chapters:- Chapter one: Introduction Chapter two: Literature review Chapter three: Research methodology Chapter four: Research findings Chapter five: Summary, Conclusions, Recommendations VARIABLES  You won't be able to do very much in research unless you know what variables are. A variable is any entity that can take on different values. The term variable is derived from variations. It refers to differences, attributes, qualities of the cases that we measure or record (Kombo and Tromp 2006).  A variable is anything that takes differing or varying values e.g. Age, height, price, income, level of education, motivation, performance, etc.  Anything that can vary can be considered a variable. For instance, age can be considered a variable because age can take different values for different people or for the same person at different times. Similarly, country can be considered a variable because a person's country can be assigned a value. TYPES OF VARIABLES 1. Independent variables (also known as predictor variable)  An independent variable is what the researcher (or nature) manipulates, a treatment or program or cause.  It is the intervention or a condition implemented by the researcher to see if it will create change on the dependent variable. This could be a program, method, system, or other action.  Independent variables are predictors or explanatory variables, those that cause changes to the dependent variables. They influence the dependent variables positively or negatively. e.g. The relationship of availability Computer Aided Design (CAD) software (independent variable) on the number of defective product i.e. rejects (dependent variable) in fashion
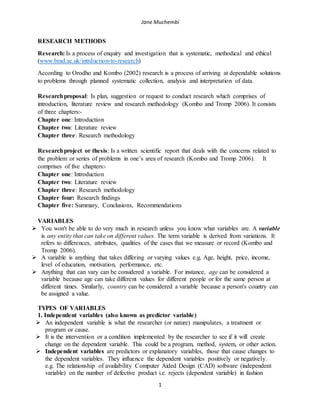
  • 2. Jane Muchembi 2 manufacturing firm may be affected by the designers ability to use the CAD technology (moderating variable).  Whenever there is independent variable there is also a dependent variable.  An increase or decrease in units of independent variable will lead to increase or decrease in dependent variable i.e. variance in dependent variable is accounted for by variance in independent variables. 2. Dependent variables (also known as criterion variable)  Dependent variable: A dependent variable is what may change as a result of the independent variable or intervention.  The dependent variable is what is affected by the independent variable – the researchers’ effects or outcomes. For example, if the researcher is studying the effects of a new educational program on student achievement, the program is the independent variable and your measures of achievement are the dependent ones.  A dependent variable could be a behavior, outcome, or other condition. Introduction of modern cutting and stitching machines (independent variable) in a garment making firm, for example, may increase the output or production (dependent variable).  It is the outcome that the researcher is attempting to predict e.g. performance of a designer. It is the variable that the researcher is primarily interested in. The researcher’s goal is to understand, describe it, to find out what influences its behavior or to predict it.  Dependent variable is the variable of primary interest to the researcher. The researcher’s goal is to understand and describe the dependent variable or to explain its variability or to predict it.  Understanding the dependent variable and the other variables that influence it will help the researcher to recommend solutions to problems e.g. understanding factors (independent variables) that hinder many Kenyan fashion designers from starting their own fashion design businesses (dependent variable) will help the researcher recommend possible ways of removing those hindrances. 3. MODERATING VARIABLE  Moderating variable is one that has a strong contingent effect on the independent variable- dependent variable relationship.  Its presences modifies the relationship between the independent and dependent variables e.g. The designers ability or skills in using CAD technology will interfere with the relationship between availability of CAD software and number of defective products (rejects). Relationshipbetween independentanddependentvariable Computer aided design Number of defective products / rejects Independent variable Dependent variable
  • 3. Jane Muchembi 3 4. INTERVENING VARIABLE  Intervening variable is one that surfaces between the time independent variable starts operating to the time their impact is felt on it. There is therefore a temporal quality or time dimension to the intervening variable.  It surfaces as a function of the independent variable(s) operating in any situation and helps to conceptualize and explain the influence of independent variable(s) on the dependent variable. e.g. in a study where the independent variable is workforce diversity which influences the dependent variable is organizational effectiveness, creative synergy (collaboration, cooperation, interaction) may surface as the intervening variable. Creative synergy may surface due to multiracial, multiethnic and multifaceted expertise in problem solving.  NB: creative synergy in the above example surfaces at time t2 as a function of workforce diversity which was in place at time t1 to bring about organizational effectiveness at time t3.  The intervening variable of creative synergy helps us to understand how workforce diversity brings about organizational effectiveness. Number of defective products / rejects Relationshipbetweenindependent, dependentvariablesmodulatedbymoderatingvariable Computer aided design Dependent variableIndependent variable Moderating variable Designer’s CAD skills Creative synergy Organizational effectivenessWorkforce diversity Relationship between independent, intervening and dependent variables Independent variable Dependent variableIntervening variable t3t2t1Time :me
  • 4. Jane Muchembi 4 NB: Inclusion of a moderating variable will affect the relationship between the other variables e.g. creative synergy may not occur if the management is not able to harness the different problem solving skills in the diverse workforce. Abstract: is a summary of the whole research project including the objectives, methodology used, findings and recommendations. It should not exceed 500 words. THE PURPOSE CONDUCTING RESEARCH is to:- i. Review or synthesize existing knowledge ii. Investigate existing situations or problems iii. Provide solutions to problems iv. Explore and analyze more general issues v. Construct or create new procedures, or systems or technologies vi. Explain a new phenomenon vii. Generate new knowledge viii. Combination of any of the above (Collis & Hussey, 2003). (www.brad.ac.uk/intrduction-to-research) RESEARCH TOPIC: Refers to the subject, issue or area under discussion or investigation e.g. fashion marketing, African dress, interior design. A researcher should choose a topic which interests him/her as this will help sustain the motivation to complete the research. This is because one will enjoy reading materials in the area, collecting and analyzing data. Independent variable Intervening variable Managerial expertise Relationship between independent, intervening, moderating and dependent variables Creative synergy t3t2Time :me t1 Organizational effectivenessWorkforce diversity Dependent variable Moderatingvariable
  • 5. Jane Muchembi 5 RESEARCH TITLE: is the heading, label or tag. It describes what the research is about. It should be formulated after selecting the topic. QUALITIES OF A GOOD TITLE i. It should be brief i.e. not more than 15 words ii. It should be specific i.e. it should be easy to identify independent and dependent variable from the title. iii. It should be in line with the objectives i.e. it should portray the aims and objectives of the research. iv. It should be clear and not ambiguous i.e. it should not be subject to different interpretations. It should reflect a relationship between independent and dependent variables. v. It should portray an issue that is researchable i.e. the aspects in question should be measurable. REFERENCING OTHER PEOPLES’ WORK WHEN CONDUCTING RESEARCH A researcher should acknowledge all the sources of information used when conducting the research by citing the author’s surname and year of publication in the text and writing its full details in the reference list at the back of the document. REASONS FOR CITING OTHER PEOPLES WORK i. The body of knowledge is not built on vacuum but on accumulated knowledge over generations and so the researcher should try to fit his/her research within already existing knowledge. ii. It is courteous to acknowledge use of other peoples’ work. iii. It provides evidence of thorough examination of literature and shows that the researcher has read. iv. It gives support to the points that the researcher has stated in the research. v. Helps to identify gaps that should be met by the researcher. FOUR IMPORTANT POINTS WHEN REFERENCING i. Credit must be given when quoting or citing other peoples. ii. Adequate information must be provided to enable a reader to locate each reference. iii. References must be complete and consistent. iv. References must be recorded in precise format as per the requirement of the University of Study. REFERENCING STYLES/SYSTEMS There are several referencing styles to choose from e.g. i. Vancouver which uses numbers in the text and footnotes. Each number in the text represents a reference or publication whose details are given in the footnotes. ii. Modern Language Association (MLA) iii. Harvard system which is an author –date system iv. The American Psychological Association (APA) system which is also a an author –date system which is recommended for social sciences.
  • 6. Jane Muchembi 6 CHOICE OF REFERENCING STYLE/SYSTEMS The choice is influenced by the discipline of study and the university. NB: A researcher should familiarize himself or herself with all the styles and thoroughly study the style that he/she will adopt. The American Psychological Association (APA) system It is an author –date system which is recommended for social sciences. It requires that the researcher identifies or acknowledges or writes the authors’ surname/names and date (year) of publication at the point where they are cited in the text (proposal or project) and full details of the publication in the reference list at the end of the publication. Referencing in the text This can be done at the beginning or end of the sentence. When done at the end of the sentence the authors name and date are put into bracket and full stop at the after the bracket e.g. teenage girls prefer wearing high heeled shoes (Kelly, 2014). If there are two authors write both authors surnames names separated by & and then year e.g. (Kelly & Allan, 2014). When used at the beginning of the sentence only the date is in bracket e.g. According to Kelly (2014) teenage girls prefer wearing high heeled shoes. In case the author is not known cite a (short title, date) If the date is not known cite (Author, n.d.). Corporate authors like UN Cite in full first used and acronyms thereafter e.g. (United Nations (UN), 2001) first time and (UN, 2001) thereafter. Page numbers are only written in citations for direct quotations but not paraphrased ones. Referencing in the reference list This is placed immediately after chapter three for the proposal and chapter five for the project. For text books, one starts with the authors surname/names initials (date). Then title of the book (in Italics). The city of publication: publisher. E.g. Kelly, J. M. & Allan, B. S. (2014). Introduction to Research Methods. Nairobi: Acts Publishers. For journal articles, start with surname/s (date). Title of the article, Journal name (in Italics), Volume No. Part no. Pages. E.g. Kelly, J.M. & Allan, B.S. (2014). University dressing Code, Fashion and Design Journal, 43 (3), 72-90 For journal published in the internet < URL: http://www. remainder of full internet electronic conference/bulletin board > e.g. <URL:http://www.stingray.ivision.co.uk/groups/emu/frindex.htm> For Journals article published in the internet start with the surname, Initials (date). ‘Title of the article’, Journal Name (in Italics). Volume No. Part no. (online) (cited day, month, year) Available from <URL: http://www. remainder of full internet address>e.g. Illingworth, N. (2001) ‘The internet matters’ Sociological Research Online 6:2, (online) (cited 20 March 2002) Available from < URL: http://www.scoresonline.org.uk/6/2/illing th.html>
  • 7. Jane Muchembi 7 NB: i. All the authors cited in the text should be included in the reference list. ii. Authors not cited in the text should not be in the reference list. iii. Single space within a reference and double space between references. iv. Use hanging indents in references v. The publication in the reference list should be arranged in alphabetical order by the authors’ names i.e. authors whose surnames start with letter “A” should be listed before those whose surnames start with “B” and so on. An example of reference list Babbie, E. (2001). The practice of social Research: 9th Ed. CA: Wadworth Thomson. Neville C. (2007). An introduction to research and research methods. Bradford University school of Management. Saunders, M, Lewis, P. & Thornhill, A. (2007) Research Methods for Business Students (4th Edition.) Harlow: Prentice Hall. NB: Referto the APA Manual for more details.
  • 8. Jane Muchembi 8 CHAPTER ONE: INTRODUCTION 1.0 BACKGROUND TO THE STUDY  Refers to the setting or position of the study. It is a brief overview of the problem the researcher plans to investigate. It should tell the readers why the researcher feel that the research is worth the effort. It should be a highlight of the key literature sources that the researcher plans to draw from.  It provides background to the problem from international, national and local point of view based on existing literature. It is similar to literature review in that it cites some literature but different in that it is much more brief (not more than ½ pages). It is a mini literature. ROLE OF BACKGROUND TO THE STUDY IN RESEARCH i. It helps to clarify what brought about the need for the study. ii. It points out the challenges faced due to the identified issue iii. It indicates the opportunities for improvement iv. It demonstrates the researcher’s view of the research problem. v. It helps to convince the readers that a problem exists and need to be addressed. QUALITIES OF A GOOD BACKGROUND TO THE STUDY It should be:- i. Brief and specific, although it is very similar to the literature review it is less detailed. ii. Engages the interest of the reader. It should make the reader excited about the opportunity of having the research problem addressed. iii. It gives the reader a glimpse of the research problem iv. It gives the reader an idea of how the proposal is structured v. The language used is simple and straight forward vi. Informative and persuasive since it attempts to enlighten the reader on the research problem and the urgency of addressing it. (Kombo and Tromp 2006) 1.2 RESEARCH PROBLEM  A research problem is an issue or concern that puzzles the researcher because of its effects or consistence despite the measures taken e.g. use of indecent dressing among fashion and design students despite continued training on importance of dressing decently.  It can also be defined as situation where gap exists between the actual and desired ideal situation or state e.g. the desired ideal situation may be zero defects in production but the actual may be that there are a few defects.  It is the heart or core of the research project and if a researcher does not understand the problem he/she will not succeed in the research. QUALITIES OF A GOOD OR EFFECTIVE RESEARCH PROBLEM i. It is concise and clearly stated. It makes the reader aware that there is a definite issue that need to be addressed or problem that needs to solved. It should answer questions such as:- a) What is the problem? b) Why is it a problem? c) Who is getting affected or will be affected if the situation is not addressed through research? d) Where/ location does the problem exist?
  • 9. Jane Muchembi 9 ii. The research problem has impact in the whole topic being investigated. iii. It indicates clearly that there is urgent need of the research. iv. It is researchable i.e. the problem can be investigated through collection and analysis of data. v. Relevant literature is available i.e. the problem has supportive statements. vi. Language used is simple and objective i.e. not emotional, comic or poetic. (Kombo and Tromp 2006) 1.3 RESEARCH OBJECTIVES These are the intentions or purposes of research stated in specific and measurable terms. They provide opportunities for measuring end results e.g. to establish the effects of age on the height of shoes used by women in Nairobi city? QUALITIES OF GOOD OR EFFECTIVE RESEARCH OBJECTIVES i. Specific: clearly state what the researcher will do in order to fulfil the purpose of the research. ii. Measurable: the researcher should be able to measure or tell whether they have been achieved. iii. Focused: Should narrow the study to essentials. They should cover the different aspects of the problem and its contributing factors in a coherent and logical sequence. iv. Operational: they should be clearly stated in operational terms, specifying exactly what the researcher will do. v. Realistic: Not too ambitious and therefore achievable. 1.5 RESEARCH QUESTIONS These are issues that the researcher plans to answer and are related to the research objectives e.g. what is effect of age on the height of shoes used by women in Nairobi city? 1.6 RESEARCH HYPOTHESES Hypothesis: is an educated guess or assumption. It is a tentative explanation for certain behavior pattern, phenomenon, or events that have occurred or will occur. Researchhypothesis is a statement about the expected relationship between observable or measurable events. An experimental research hypothesis states the expected relationship between independent and dependent variables e.g. increase in consumers salaries will lead to increase in consumption of fashion products. FORMS OF STATING HYPOTHESIS 1. The null hypothesis: States that there is no difference between the variables studied. The aim of testing it is to show that the hypothesis is false and accept the alternative hypothesis. It symbolized as H0 e.g. H0 1: There is no significant difference in the performance of designers who have gone through a diploma course in design and those who have gone through a degree program.
  • 10. Jane Muchembi 10 2. The alternative hypothesis: is the opposite of the null hypothesis and states that a value or relationship in the null is not true. It symbolized as H1 e.g. H1 e.g. H1: there is a significant difference in performance of designers who have gone through diploma and those who have gone through a degree program. 1.7 SIGNIFICANCE/JUSTIFICATION OF THE STUDY Outlines the importance of the issue under investigation. Explains who will benefit from the research and how they will benefit from the findings of the research. This is important because research is expensive in both money and time and therefore it is necessary to establish the need or relevance of research. 1.8 LIMITATIONS OF THE STUDY Refer to the challenges anticipated or faced by the researcher e.g. time, finances inaccessibility of data non-cooperative respondents etc. 1.9 ASSUMPTIONS OF THE STUDY What the researcher assumes to be true e.g. the information given by the respondents is true. DEFINITION OF TERMS Significant terms which are used whose meanings are not obvious are defined. Start this section in a new page. NB: Every chapter should be started in a new page. CHAPTER TWO: LITERATURE REVIEW The term literature refers to the analysis of publications such as books, journals, magazines, manuscripts etc. Literature means the work/publications that the research has consulted or referred to when conducting research to gain better understanding of the of the research problem. Literature review is therefore an account or a critical look at what has been published on a topic by accredited scholars. REASONS FOR CRITICAL LITERATURE REVIEW WHE N CONDUCTING RESEARCH i. It sharpens theoretical foundation of the research. It enables the researcher to study different theories related to the identified topic. By studying them the researcher gains clarity and better understanding of the theoretical foundations related to the research. ii. It gives the researcher insight into what has already been researched in the selected field, pinpointing strengths and weaknesses. This information guides the researcher in theory formulation and identifying the gaps. iii. It enables the researcher to avoid duplication of research already done. iv. Helps the researcher to develop a significant problem of the study which will provide further knowledge in the field of study.
  • 11. Jane Muchembi 11 v. It exposes the researcher to a variety of approaches or methods of conducting research. This contributes to a well-designed methodology because the researcher can avoid methods that have been reported in the literate to be weak or have failed. vi. It helps in developing analytical framework or basis for analyzing and interpreting data. The researcher will be able to compare and contrast their findings with the findings of the other researchers. vii. Helps to convince the reader that:- a) The researcher is knowledgeable about the problem area and has done the preliminary home work that is necessary to conduct research b) Theoretical framework will be structured on work already done and will add to the solid foundation of existing knowledge. (Sekaran 2003) QUALITIES OF GOOD LITERATURE REVIEW i. It should be critical, organized and analytical in orientation. -It is used to analyze issues such as whether the title is descriptive, well worded and reasonably short. -The researcher also analyzes whether the problem was well stated, objectives, questions and hypotheses in the studies reviewed were logically formulated. -The researcher also analyzes the methodology used was appropriate i.e. was the right design, population, sample and sampling procedure, data collection methods and instruments and data analysis techniques were used. - The researcher also analyzes whether it provided the results are significant, applicable and relevant to his/her research. ii. It justifies the need for further study i.e. - it identifies the gaps in the studies reviewed that should be filled with further research. -It highlights controversies raised in the previous researches which need to be resolved by further research. -It points out how current research will positively contribute towards filling in the identified gaps. iii. It highlights the relationship between the past and the current study i.e. -It links the current study with the past studies - It evaluates and shows the relationship between the work already done by other scholars and the researcher’s work. -This brings consistency and continuity in relation to identified topic. iv. It puts the research into perspective - Citing and analyzing various related studies helps to define the research problem. - It also act as a guideline in assessment of the research questions. THE STRUCTURE/COMPONENTS OF LITERATURE REVIEW 2.1 Introduction: It briefly (one paragraph) tells the reader what is discussed in the literature review.
  • 12. Jane Muchembi 12 2.2 The body: this may be structured into subtopics based on either the:- a) objectives or b) Variables 2.3 Summary and identified gaps: summarizes the key and relevant findings from the reviewed literature and brings out what the previous studies have not covered on the topic and needs to be researched. NB: When writing the literature review, read the publication critically and analytically, understand and then summarize the idea you find relevant in your own words. Then cite the author.  If there is need to use direct quotation put them into quotes and cite the authors name, date and page number. If the quotation is from 40 words and above indent and single space the whole block and do not put them in quotes, cite the author, date and page number. Desist from using quotes after quotes and copy pasting.  Bring out some discussions on every idea you write about based on what different authors have written i.e. explain where different authors agree or disagree, contradictions and gaps of what they have not explained about the idea (missing gaps)  Only include relevant literature. Not every material you will read is relevant to your study. 2.4 THEORETICAL FRAMEWORK AND CONCEPTUAL FRAMEWORK 2.4.1 THEORETICAL FRAMEWORK According to Sekaran (2004), theoretical framework explains the relationship between variables that are deemed to be integral to the dynamics of the situation being investigated. It is the foundation on which the entire research is based. It is based on existing relevant theories. 2.4.2 CONCEPTUAL FRAMEWORK Is a set of broad ideas and principles taken from relevant fields of inquiry and used to structure a subsequent presentation (Reichel and Ramey (1986) as cited by Kombo and Tromp 2006) DEFFERENCES BETWEEN CONCEPTUAL AND THEORETICAL FRAMEWORK. Theoretical framework Conceptual framework -It is based on existing relevant theories. - Since is based on existing theory it is likely to have been tested before -May not be supported by schematic diagram - It based on the way the researcher conceptualizes certain ideas, actions and relationships -it is a hypothesized mode of identifying concepts or variables under study and showing their relationships -Is better accompanied by schematic diagram SIMILARITIES BETWEEN CONCEPTUAL AND THEORETICAL FRAMEWORK. i. They both explain the relationship between dependent and independent variables. ii. Both form the foundation on which the whole research is based. iii. Help the researcher to hypothesize and test the relationship between dependent and independent variables. iv. Help to identify the existing networks of relationships among variables.p
  • 13. Jane Muchembi 13 v. Both tend to focus the direction of research so that the researcher does not dwell on the trivial matters that do not contribute to the body of knowledge or digress vi. Help to provide a rational basis for explaining or interpreting results of the research. vii. Enables the researcher to make predictions. viii. Both may need to be tested or improved through research. THE PURPOSE OF DEVELOPING A CONCEPTUAL FRAMEWORK WHEN CONDUCTING RESEARCH i. Provides a clear link from literature review, to the research problem, questions and objectives. ii. Gives broad scope of the research and enables the researcher to conceptualize the research problem from a broad perspective. ii. It is conceptually aligned with the research methodology and objective and therefore provides an overall view of the research. By highlighting the independent and dependent variables, it enables the researcher to focus on the research problem. PLACEMENT OF CONCEPTUAL AND THEORETICAL FRAMEWORK  According to Creswell (2004) placement of theory depends on whether one is conducting a quantitative or qualitative study. In quantitative research it may be placed at the end of introduction i.e. chapter one or at the beginning or end of chapter two i.e. literature.  In qualitative research a researcher does not begin with theory but it emerges during data collection and analysis and so it can be placed at the end of the research. CHAPTER THREE: RESEARCH METHODOLOGY RESEARCH APPROACHES Quantitative research Qualitative research - Quantitative research relies on the principle of verifiability meaning that it seeks confirmation, proof, corroboration or substantiation - Emphasizes collecting and analyzing numerical data. - Qualitative research is research that involves description, it seeks to describe the behavior of the population under investigation - Does not emphasize use of numerical data. Basic research Applied research - Aims at improving or adding knowledge without any particular applied purpose in mind at the onset. - Is designed right from the start to apply its findings to a particular situation or to solve a specific problem. Deductive research: testing theory Inductive research: building theory - Moves from general ideas to specific, particular situations. - The particular is deduced from the general e.g. broad theories - Moves from particular situations to make or infer broad general ideas or theories. - E.g. if you wanted to know the meaning of the word fashion to a range of people may be of
  • 14. Jane Muchembi 14 - E.g. if you wanted to know the meaning of the word fashion to a range of people may be of different ages or gender, you could start by checking the definitions given by professional associations or sources and then test the definition with the range of people. - Then collate the data collected and the results analyzed and presented. different ages or gender, you could start by checking the definitions with the range of people and then compare with definition given by professional associations or sources and then test the definition - Then collate the data collected and the results analyzed and presented. - This may lead to new definition or not 3.1. RESEARCH DESIGNS Researchdesign: can be thought of as a structure of the research. It is the glue that holds all the elements of research project together. There are different types of research designs e.g. I. Descriptive Survey: i. Describes the state of affairs as it exists. ii. May lead to formulation of important principles of knowledge and solutions to significant problems. iii. Involve collection, classification, analysis, comparison and interpretation of data. iv. Can be used for collecting information about people’s attitudes, opinions, and habits. II. Correlational design: i. Enables the researcher to assess the degree of relationship that exists between two or more variables e.g. age of the consumer and the height of the shoes used. ii. Tries to establish how given independent variables affect or cause changes to the dependent variables. iii. Tend to compare similarities and differences between groups of population. iv. The researcher is required to control all other variables to be able to establish a causal relationship. III. Evaluative design: i. Investigates the effects or impacts of a program or project. ii. Involve collection and analysis of data to facilitate decision making. iii. Assists in meeting accountability demands. iv. Helps to determine the worth of a program or project or activity. IV. Experimental design: i. Involve manipulation or treatment of some variables and then measuring the outcomes. ii. Two groups of respondents are used i.e. the experimental group and control group. iii. The experimental group receives the treatment but the control group does not and their performance or behavior is tested after the experiment. iv. The researcher assumes that the two groups were the same before the experiment. V. Case study i. Seeks to study a unit in detail, in context and holistically.
  • 15. Jane Muchembi 15 ii. Enables the researcher to deep information and understanding on the unit being studied iii. The findings may not be easily generalized. iv. The researcher should give clear justification for using this design. VI. Naturalistic/ethnographical design i. Studies a phenomenon in its ordinary or natural environment ii. Attempt to study ordinary happenings iii. Uses common language in reporting iv. Is mostly qualitative in nature VII. Historical /longitudinal design i. Involves integration and description of the true record of past events and their developmental trends. ii. It is a longitudinal, genetic or developmental approach attempting to get the actual meaning of the primary and secondary sources pertinent to the problem under investigation by subjecting the evidence to external and internal criticism. iii. Involves collection and analysis of primary sources such as manuscripts, memoirs, diaries, autobiographies iv. The major focus is construction of conceptual frameworks, collection, analysis and organization and demonstration meaning of historical evidence VIII. CROSS-SECTIONAL STUDIES This is a study involving different organizations or groups of people to look at similarities or differences between them at any one particular time, e.g. a survey of the IT skills of managers in one or a number of organizations at any particular time. Cross-sectional studies are done when time or resources for more extended research, e.g. longitudinal studies, are limited. It involves a close analysis of a situation at one particular point in time to give a ‘snap-shot’ result. 3.2 THE LOCALE OR LOCATION OF THE STUDY Describe the location where the research will be carried out giving justifications. 3.3 POPULATION/TARGET POPULATION It is the group of people or objects or items with at least one thing in common from which the sample will be taken for measurements and the results generalized to e.g. All the small scale fashion traders in Nakuru county. The major question that motivates sampling in the first place is: "Who do you want to generalize to?" Or should it be: "To whom do you want to generalize?" In most social research we are interested in more than just the people who directly participate in our study. We would like to be able to talk in general terms and not be confined only to the people who are in our study. There are times when we aren't very concerned about generalizing. Maybe we're just evaluating a program in a local agency and we don't care whether the program would work with other people in other places and at other times. In that case, sampling and generalizing might not be of interest.
  • 16. Jane Muchembi 16 In other cases, we would really like to be able to generalize almost universally. When psychologists do research, they are often interested in developing theories that would hold for all humans. But in most applied social research, we are interested in generalizing to specific groups. The group you wish to generalize to is often called the population in your study. This is the group you would like to sample from because this is the group you are interested in generalizing to. Let's imagine that you wish to generalize to urban homeless males between the ages of 30 and 50 in the Kenya. If that is the population of interest, you are likely to have a very hard time developing a reasonable sampling plan. You are probably not going to find an accurate listing of this population, and even if you did, you would almost certainly not be able to mount a national sample across hundreds of urban areas. So we probably should make a distinction between the population you would like to generalize to (theoretical population) and the population that will be accessible to you (the accessible population). In this example, the accessible population might be homeless males between the ages of 30 and 50 in six selected urban areas across the Kenya SAMPLING FRAME: is the list of all the members of the population under investigation. The researcher can obtain one from the relevant bodies or develop one in case where such a list does not exist. Once you've identified the theoretical and accessible populations, you have to do one more thing before you can actually draw a sample -- you have to get a list of the members of the accessible population. (Or, you have to spell out in detail how you will contact them to assure representativeness). The listing of the accessible population from which you'll draw your sample is called the sampling frame. 3.4 SAMPLE POPULATION Sample population: is a sub-set of population or a small part of the target population which is thought to be a true representative of the whole population. It comprises of all the members selected from the population from which data will be collected and then generalized to the whole population. You actually draw your sample (using one of the many sampling procedures). The sample is the group of people who you select to be in your study. Notice that I didn't say that the sample was the group of people who are actually in your study. You may not be able to contact or recruit all of the people you actually sample, or some could drop out over the course of the study. The group that actually completes your study is a subsample of the sample -- it doesn't include non- respondents or dropouts. The problem of nonresponse and its effects on a study will be addressed when discussing "mortality" threats to internal validity. People often confuse what is meant by random selection with the idea of random assignment. You should make sure that you understand the distinction between random selection and random assignment.
  • 17. Jane Muchembi 17 At this point, you should appreciate that sampling is a difficult multi-step process and that there are lots of places you can go wrong. In fact, as we move from each step to the next in identifying a sample, there is the possibility of introducing systematic error or bias. For instance, even if you are able to identify perfectly the population of interest, you may not have access to all of them. And even if you do, you may not have a complete and accurate enumeration or sampling frame from which to select. And, even if you do, you may not draw the sample correctly or accurately. And, even if you do, they may not all come and they may not all stay. 3.5 SAMPLING/ SAMPLING TECHNIQUES/PROCEDURES /METHODS Sampling refers to the process of selecting the individuals or objects from which to gather the information from the population. It is the process of selecting units (e.g., people, organizations) from a population of interest so that by studying the sample we may fairly generalize our results back to the population from which they were chosen. SOME DEFINITIONS Before I can explain the various probability methods we have to define some basic terms. These are:  N = the number of cases in the sampling frame  n = the number of cases in the sample  NCn = the number of combinations (subsets) of n from N  f = n/N = the sampling fraction That's it. With those terms defined we can begin to define the different probability sampling methods. SAMPLING FORMULAR N n =______________________ 1 + Ne2 Where; N- the population/Number of cases in the sampling frame e- the margin of error n- the sample size/number of cases in the sample SAMPLING DESIGNS Are categorized as:- 1. PROBABILITY SAMPLING Probability sampling techniques: apply random selection where each member of population is given equal chances of being in the sample. They don’t give all the members of the population equal chances of being in the sample. A probability sampling method is any method of sampling that utilizes some form of random selection. In order to have a random selection method, you must set up some process or procedure that assures that the different units in your population have equal probabilities of being chosen.
  • 18. Jane Muchembi 18 Humans have long practiced various forms of random selection, such as picking a name out of a hat, or choosing the short straw. These days, we tend to use computers as the mechanism for generating random numbers as the basis for random selection. 2. NON-PROBABILITY SAMPLING Non-probability sampling techniques: The researcher is interested in the representativeness of the concepts in their varying forms maximizing the scope or range of variations of respondents in the sample. Probability sampling techniques Non-probability sampling techniques i. Simple random sampling ii. Systematic random sampling iii. Stratified random sampling iv. Cluster random sampling v. Multistage random sampling i. Quota sampling ii. Convenience sampling iii. Judgmental sampling iv. Purposive sampling v. Snowballing vi. Volunteer/ self-selection i. Simple random sampling It has the least bias and produces most generalized results because it gives every member of population a chance of being in the sample. Procedure: Use a table of random numbers, a computer random number generator, or a mechanical device to select the sample. One may use the following procedure. 1. First, we have to get the sampling frame organized. The researcher obtains or makes a list of all the members of the population and assigns to each of them a number or letter i.e. if the whole population comprises of 1,000 people make a list of 1,000. 2. Decide on the number of people you would like to have in the final sample depending on the size of the population and the research design. For example, if you want to select 100 clients to survey and that there are 1000 members of the population. Then, the sampling fraction is f = n/N = 100/1000 =10 or 10%. 3.Write those numbers in small papers (tickets) similar to those used in a raffle i.e. 1-1,000. 4. Fold each of them and mix them nicely in a container. 5. Pick the number of tickets equal to the sample size chosen e.g. if a sample of 10% is required pick 100 tickets and individuals represented by the numbers in the 100 tickets picked will be the ones to make up the sample. But this mechanical procedure would be tedious and the quality of the sample would depend on how thoroughly you mixed them up and how randomly you reached in. With the development of inexpensive computers there is a much easier way. Here's a simple procedure that's especially useful if you have the names of the clients already on the computer. Many computer programs can generate a series of random numbers. Let's assume you can copy and paste the list of client names into a column in an EXCEL spreadsheet. Then, in the column right next to it paste the function =RAND() which is EXCEL's way of putting a random number between
  • 19. Jane Muchembi 19 0 and 1 in the cells. Then, sort both columns -- the list of names and the random number -- by the random numbers. This rearranges the list in random order from the lowest to the highest random number. Then, all you have to do is take the first hundred names in this sorted list. Pretty simple. You could probably accomplish the whole thing in under a minute. Simple random sampling is simple to accomplish and is easy to explain to others. Because simple random sampling is a fair way to select a sample, it is reasonable to generalize the results from the sample back to the population. Simple random sampling is not the most statistically efficient method of sampling and you may, just because of the luck of the draw, not get good representation of subgroups in a population. To deal with these issues, we have to turn to other sampling methods. ii. Systematic random sampling Systematic Random Sampling Here are the steps you need to follow in order to achieve a systematic random sample:  number the units in the population from 1 to N  decide on the n (sample size) that you want or need  k = N/n = the interval size  randomly select an integer between 1 to k  then take every kth unit It involves drawing every nth elements in the population starting with a randomly selected element between 1 and n. e.g. if 10% sample is required from a population of 1,000 people (i.e. 100 people) 1. The researcher obtains or makes a list of all the members of the population and assigns to each of them a number or letter i.e. if the whole population comprises of 1,000 people make a list of 1,000. Pick the first element (number) at random 2. Pick every 10th (1000/100) number from the randomly selected number until you get the 100 required e.g. if 1 is the randomly selected number then the next number picked is, 10, then 20, then 30, the 40 etc. until a sample of 100 is picked. 1, 2, 3, 4, 5, 6, 7, 8, 9, 10, 11, 12, 13, 14, 15, 16, 17, 18, 19, 20, 21, 22,23, 24, 25, 26,27,27, 29, 30, 31, 32, 33, 34, 35, 36, 37, 38, 39, 40, 41, 42, 43, 44, 45, 46, 47, 48, 49, 50, 51, 52, 53, 54, 55-----------1,000 iii. Stratified random sampling Stratified Random Sampling, also sometimes called proportional or quota random sampling, involves dividing your population into homogeneous subgroups and then taking a simple random sample in each subgroup. In more formal terms: The researcher first divides the population into groups based on relevant characteristics and then randomly selects participants from those groups e.g. If the population comprises of both male and female, make a list of all the male and all the female. Then randomly select the number of males required and the number of females required. The steps:- 1. Determine the strata that the population will be divided into e.g. according to sex (male and female), or according to the age, or geographical location such as rural and urban etc.
  • 20. Jane Muchembi 20 2. Determine the number of participants required from each stratum e.g. If a sample of 100 is required from a population 1000 where there is 50% male (500) and 50% female (500), the sample may also have 50% (50 ) male and 50% (50) female i.e. Proportionate random sampling. 3. Randomly select the participants from within the group/ strata. NB: The sample can also be selected using a computer program. Objective: Divide the population into non-overlapping groups (i.e., strata) N1, N2, N3, ... Ni, such that N1 + N2 + N3 + ... + Ni = N. Then do a simple random sample of f = n/N in each strata. There are several major reasons why you might prefer stratified sampling over simple random sampling. First, it assures that you will be able to represent not only the overall population, but also key subgroups of the population, especially small minority groups. If you want to be able to talk about subgroups, this may be the only way to effectively assure you'll be able to. If the subgroup is extremely small, you can use different sampling fractions (f) within the different strata to randomly over-sample the small group (although you'll then have to weight the within- group estimates using the sampling fraction whenever you want overall population estimates). When we use the same sampling fraction within strata we are conducting proportionate stratified random sampling. When we use different sampling fractions in the strata, we call this disproportionate stratified random sampling. Second, stratified random sampling will generally have more statistical precision than simple random sampling. This will only be true if the strata or groups are homogeneous. If they are, we expect that the variability within-groups is lower than the variability for the population as a whole. Stratified sampling capitalizes on that fact. For example, let's say that the population of clients for our agency can be divided into three groups: Caucasian, African-American and Hispanic-American. Furthermore, let's assume that both the African-Americans and Hispanic-Americans are relatively small minorities of the clientele (10% and 5% respectively). If we just did a simple random sample of n=100 with a sampling fraction of 10%, we would expect by chance alone that we would only get 10 and 5 persons from each of our two smaller groups. And, by chance, we could get fewer than that! If we stratify, we can do better. First, let's determine how many people we want to have in each group. Let's say we still want to take a sample of 100 from the population of 1000 clients over the past year. But we think that in order to say anything about subgroups we will need at least 25 cases in each group. So, let's sample 50 Caucasians, 25 African-Americans, and 25 Hispanic-Americans. We know that 10% of the population, or 100 clients, are African-American. If we randomly sample 25 of these, we have a within-stratum sampling fraction of 25/100 = 25%. Similarly, we know that 5% or 50 clients are Hispanic-American. So our within-stratum sampling fraction will be 25/50 = 50%. Finally, by subtraction we know that there are 850 Caucasian clients.
  • 21. Jane Muchembi 21 Our within-stratum sampling fraction for them is 50/850 = about 5.88%. Because the groups are more homogeneous within-group than across the population as a whole, we can expect greater statistical precision (less variance). And, because we stratified, we know we will have enough cases from each group to make meaningful subgroup inferences. iv. Cluster/Area random sampling The problem with random sampling methods when we have to sample a population that's disbursed across a wide geographic region is that you will have to cover a lot of ground geographically in order to get to each of the units you sampled. Imagine taking a simple random sample of all the residents of New York State in order to conduct personal interviews. By the luck of the draw you will wind up with respondents who come from all over the state. Your interviewers are going to have a lot of traveling to do. It is for precisely this problem that cluster or area random sampling was invented. In cluster sampling, we follow these steps:  divide population into clusters (usually along geographic boundaries)  randomly sample clusters  measure all units within sampled clusters For instance, in the figure we see a map of the counties in New York State. Let's say that we have to do a survey of town governments that will require us going to the towns personally. If we do a simple random sample state-wide we'll have to cover the entire state geographically. May be used when the list of the population is impossible or impractical to make e.g. in a study on the factors that influence the choice clothing by Christians in the churches in Kenya, it may be impossible to make a list of all of them. 1. The researcher can create a list of churches in Kenya 2. Randomly select the churches to be in the sample 3. Obtain the list of members in those churches 4. Randomly select the members to put in the sample from that list. v. Multistage random sampling The four methods we've covered so far -- simple, stratified, systematic and cluster -- are the simplest random sampling strategies. In most real applied social research, we would use sampling methods that are considerably more complex than these simple variations. The most important principle here is that we can combine the simple methods described earlier in a variety of useful ways that help us address our sampling needs in the most efficient and effective manner possible. When we combine sampling methods, we call this multi-stage sampling. The sample is selected in multiple steps e.g. in a study on the factors that influence the choice of shoes by the university students in Kenya, The researcher can follow the following steps:- 1. Cluster sampling of counties in which the universities are located as the first stage of the process. 2. We could then have a two-stage sampling process with stratified samples within cluster samples to select the counties. 3. Randomly select the universities in each sub-county in the sample 4. Randomly select the schools in each university sampled 5. Randomly select the faculties
  • 22. Jane Muchembi 22 6. Randomly select the departments 7. Randomly select the classes 8. Randomly select the individuals to be n the sample in each class Non-probability sampling techniques i. Quota sampling ii. A quota sample is one in which the units are selected on the basis of pre-specified characteristics so that the total sample has the same distribution of characteristics assumed to exist in the whole population being studied e.g. if from a university the population of the male is known to be 60% and female is 40% the researcher ensures that the 60% of the sample is male and 40% is female. However, the individuals in the sample are not selected randomly. iii. Convenience sampling Selecting the sample from the most accessible population e.g. shoppers from the nearest shopping mall if one is collecting data on attitudes of women towards a certain product like ladies cossets. Advantages Disadvantages  Easy access  Requires less effort  Save time to select  Saves money  Can be biased  It may not be a true or accurate representation of the population iv. Judgmental sampling or Purposive sampling The sample is selected based on the knowledge the population has on the research topic and the purpose of the study e.g. a study on choice of residential space by university students in Kenya only the students know or have information and so the researcher has to deliberately use them in the sample. v. Snowballing Used when the population is difficult to locate or identify e.g. when studying a sensitive population like prostitutes, gays or lesbians. i. The researcher identifies a few individuals, gathers information from them and requests them to help identify others in the same category or group. ii. The researcher then collects information from the ones referred by the previous group and then asks them to help identify others and the process continues until the sample is enough. vi. Volunteer/ self-selection: The research collect information from anybody willing to participate. This may introduce bias since volunteers are usually different from non-volunteers. VALIDITY: The validity is the extent to which the data accurately measures what they were intended to measure.
  • 23. Jane Muchembi 23 THE FOUR TYPES OF VALIDITY. i. Internal Validity: It is the approximate truth about inferences regarding cause-effect or causal relationships. Thus, internal validity is only relevant in studies that try to establish a causal relationship. It's not relevant in most observational or descriptive studies, for instance. But for studies that assess the effects of social programs or interventions, internal validity is perhaps the primary consideration. In those contexts, you would like to be able to conclude that your program or treatment made a difference -- it improved test scores or reduced symptomology. But there may be lots of reasons, other than your program, why test scores may improve or symptoms may reduce. The key question in internal validity is whether observed changes can be attributed to your program or intervention (i.e., the cause) and not to other possible causes (sometimes described as "alternative explanations" for the outcome) ii. Construct Validity: Construct validity refers to the degree to which inferences can legitimately be made from the operationalization in your study to the theoretical constructs on which those operationalization were based. Like external validity, construct validity is related to generalizing. But, where external validity involves generalizing from your study context to other people, places or times, construct validity involves generalizing from your program or measures to the concept of your program or measures. You might think of construct validity as a "labeling" issue. When you implement a program that you call a "Head Start" program, is your label an accurate one? When you measure what you term "self esteem" is that what you were really measuring? iii. Conclusion Validity: Conclusion validity is the degree to which conclusions we reach about relationships in our data are reasonable. Conclusion validity is only concerned with whether there is a relationship. For instance, in a program evaluation, we might conclude that there is a positive relationship between our educational program and achievement test scores -- students in the program get higher scores and students not in the program get lower ones. Conclusion validity is essentially whether that relationship is a reasonable one or not, given the data. But it is possible that we will conclude that, while there is a relationship between the program and outcome, the program didn't cause the outcome. Perhaps some other factor, and not our program, was responsible for the outcome in this study. For instance, the observed differences in the outcome could be due to the fact that the program group was smarter than the comparison group to begin with. Our observed posttest differences between these groups could be due to this initial difference and not be the result of our program. This issue -- the possibility that some other factor than our program caused the outcome -- is what internal validity is all about. So, it is possible that in a study we can conclude that our program and outcome are related (conclusion validity) and also conclude that the outcome was caused by some factor other than the program (i.e., we don't have internal validity). iv. External Validity: External validity is related to generalizing. That's the major thing you need to keep in mind. Recall that validity refers to the approximate truth of propositions, inferences, or conclusions. So, external validity refers to the approximate truth of conclusions the involve
  • 24. Jane Muchembi 24 generalizations. Put in more pedestrian terms, external validity is the degree to which the conclusions in your study would hold for other persons in other places and at other times. THREATS TO EXTERNAL VALIDITY A threat to external validity is an explanation of how you might be wrong in making a generalization. For instance, you conclude that the results of your study (which was done in a specific place, with certain types of people, and at a specific time) can be generalized to another context (for instance, another place, with slightly different people, at a slightly later time). There are three major threats to external validity because there are three ways you could be wrong -- people, places or times. Your critics could come along, for example, and argue that the results of your study are due to the unusual type of people who were in the study. Or, they could argue that it might only work because of the unusual place you did the study in (perhaps you did your educational study in a college town with lots of high-achieving educationally-oriented kids). Or, they might suggest that you did your study in a peculiar time. For instance, if you did your smoking cessation study the week after the Surgeon General issues the well-publicized results of the latest smoking and cancer studies, you might get different results than if you had done it the week before. IMPROVING EXTERNAL VALIDITY How can we improve external validity? One way, based on the sampling model, suggests that you do a good job of drawing a sample from a population. For instance, you should use random selection, if possible, rather than a nonrandom procedure. And, once selected, you should try to assure that the respondents participate in your study and that you keep your dropout rates low. A second approach would be to use the theory of proximal similarity more effectively. How? Perhaps you could do a better job of describing the ways your contexts and others differ, providing lots of data about the degree of similarity between various groups of people, places, and even times. You might even be able to map out the degree of proximal similarity among various contexts with a methodology like concept mapping. Perhaps the best approach to criticisms of generalizations is simply to show them that they're wrong -- do your study in a variety of places, with different people and at different times. That is, your external validity (ability to generalize) will be stronger the more you replicate your study. RELIABILITY: Reliability is the extent to which the data collection method will yield consistent findings if replicated by others. NB: Validity and reliability of the data you collect depend on the design of the questionnaire and the words that that are used by the researcher. 3.6. DATA COLLECTION It refers to the gathering of specific information to serve or prove some facts e.g. data may be required to prove the need for changing the current price of given products.
  • 25. Jane Muchembi 25 THE PURPOSE OF DATA COLLECTION They include to:- i. Stimulate new ideas e.g. helping to identify areas related to the research that need improvement or further evaluation. ii. Highlight a situation and create awareness and recommend improvement e.g. on the effects of increased imported second hand “Mutumba” clothes on the local clothing and textile industry and the economy as a whole. iii. Influence legislative policies e.g. Minimum wages, taxation, import, export, education etc. iv. Provide justification for an existing program or need for a new program e.g. need for training African craft producers on marketing. v. Promote decision making e.g. decision to increase production level. TYPES AND SOURCES OF DATA 1. PRIMARY DATA: Is gathered directly from primary sources or the respondents through questionnaires, interviews, observation or Focus Group discussion. It involves creating new data. 2. SECONDARY DATA: Is gathered from secondary sources such as books, journals, magazines etc. it is often referred to as desk research. DATA COLLECTION INSTRUMENTS AND METHODS OR TECHNIQUES Data collection methods include Questionnaires, Interviews, Observations and Focus Group Discussions. 1. QUESTIONNAIRE A questionnaire is a data collection method that uses an instrument or tool called a questionnaire.  This instrument comprises of a list of written down questions based on the research problem, objectives and questions which if answered will help the researcher to answer the research questions and meet the research objectives.  The researcher gives the questionnaire to the respondents to fill on their own either in print form or online and then analysis the data to make conclusions.  To ensure effectiveness of the instrument a pre-test or pilot test should be carried out on a small representative sample to enable the researcher find out if the questions are measuring what they are supposed to measure and if the wording is clear i.e. All questionnaires should be piloted, if possible, with a small group before the main research to assess their value, validity and reliability. The questions used may be:- a) Closed questions: where a limited number of alternative responses to the set question are provided. These can be in list, category, ranking, scale/rating, grid or other quantitative form. They can be pre- coded on a questionnaire to facilitate analysis. e.g. Please tick the right answer from the boxes shown below i.e. (specific choices of answers to choose from are provided) or
  • 26. Jane Muchembi 26 Advantages of closed questions Disadvantages of closed questions I. Often easier for respondents (particularly those who are busy) to answer ii. Easier to collate than open questions iii. The questionnaire can be easily reproduced by other researchers who wanted to test your findings i. They limit the choices (of answers) to respondents and gives them less control over their responses ii. It is harder to get below the surface of an issue b) Open ended questions i.e. a question is posed, but space is left for the respondent’s own answer i.e. no suggested answers. Advantages of open ended questions Disadvantages of open ended questions I. Enable you to get below the surface, explore and probe ii. Encourages respondents to think and offer considered answers iii. Encourages respondents to give honest opinions I. The responses can be hard to collate ii. The research may be difficult for others to reproduce, so your findings may be open to doubt or There are five types of questionnaire approaches: 1. On-line (electronic) 2. Postal (printed) 3. Delivery & collection (printed) 4. Telephone (electronic) 5. Interview face to face/group (electronic or printed) SOME GENERAL RULES FOR DESIGNING QUESTIONNAIRES (Source: Collis & Hussey, 2003) 1. Explain the purpose of the questionnaire to all participants 2. Keep your questions as simple as possible 3. Do not use jargon or specialist language (unless the recipients really prefer and understand it) 4. Phrase each question so that only one meaning is possible 5. Avoid vague, descriptive words, such as ‘large’ and ‘small’ 6. Avoid asking negative questions as these are easy to misinterpret 7. Only ask one question at a time 8. Include relevant questions only 9. Include, if possible, questions which serve as cross-checks on the answers to other questions 10. Avoid questions which require participants to perform calculations 11. Avoid leading or value-laden questions which imply what the required answer might be 12. Avoid offensive questions or insensitive questions which could cause embarrassment 13. Avoid asking ‘difficult’ questions, e.g. where the respondent may struggle to answer (people hate to look stupid by not knowing the ‘answer’). 14. Keep your questionnaire as short as possible, but include all the questions you need to cover your purposes
  • 27. Jane Muchembi 27 INCREASING RESPONSE RATES  As a general rule, a response rate of 30 per cent or greater for a postal/externally sent questionnaire is generally regarded as reasonable.  However, a goal of 50 per cent or more responses should be attempted in any questionnaire that involved face-to-face interviews.  There are techniques that can help improve response rates to postal or electronic questionnaires: i. Follow-up calls (especially telephone reminders and special delivery letters) ii. Pre-contact with respondents(telling them about the questionnaire) iii. Type of postage (special delivery is superior to ordinary mail; there is also some evidence that hand-written white envelopes are more likely to be opened than brown/typed!) iv. Rewards: prizes, or better still, cash incentives. v. Personalizing the questionnaire: writing to the person by name, e.g. ‘Dear John’ etc. vi. Emphasizing Confidentiality: ensuring that all views to be published remain anonymous, if appropriate vii. Appeals to the respondent: based on the social, personal or other benefits that might flow from the participation of a respondent. viii. Postal questionnaires should always include a stamped return envelope and have a covering letter explaining the purpose of the questionnaire and the use intended for the findings in the future. ix. The researcher should include full contact details and the offer to discuss the questionnaire with any respondent who has doubts or queries about it. x. The researcher should always offer to share the research findings with any participant, if requested, and this offer is best made in the covering letter. QUALITIES OF A GOOD QUESTIONNAIRE - It should be easy to understand. The language used is clear and straight forward. This helps to reduce misconception. - Instructions are clearly given. There are few words of explanation in each new section. - The questions are focused and limited to a single idea. Sentences are short and precise. - Each question included has a specific purpose, and contributes to the study. - There are no leading questions. - There is a balance of questions per topic. BASIC PRINCIPLES TO BE OBSERVED WHEN PREPARING A QUESTIONNAIRE i. Begin by giving a short rationale explaining the objectives of the study. ii. Explain the potential benefits to the target population in terms they can easily understand. iii. Make it as brief and simple to fill as possible and avoid irrelevant questions. iv. Begin with straightforward non-threatening questions which the respondents will find easy to answer. Personal questions should be left until the end. v. Make the questionnaire attractive and spacious as a crowded questionnaire will discourage responses.
  • 28. Jane Muchembi 28 Advantages of using questionnaire Disadvantages of using questionnaire i. Can be used to collect a lot of information cheaply. ii. No bias on the side of the researcher iii. Data analysis is easy because of use of closed-ended questions iv. Confidentiality can be achieved i. No direct contact with the respondents and therefore difficult to clarify misconceptions and misunderstandings ii. Responses can be low because of lack of direct contact iii. No opportunity for probing or asking for further information iv. If some questions are not answered there is no chance of asking why 2. INTERVIEW An interview is a method of collecting data in which questions are asked orally and answers recorded by the researcher or research assistant. This gives the interviewer an opportunity to probe or ask for further clarification to get deeper understanding of the topic. The interviewer can also clarify questions that may be misunderstood or misinterpreted. FORMS OF INTERVIEWS a) UNSTRUCTURED INTERVIEW It is a method of collecting data in which:-  The researcher has some idea and may be a list of the topics to be covered but no specific questions to be asked to the respondents.  They are informal and conversational with aim of encouraging the respondents to feel free to open up and give information freely.  It is suitable when studying sensitive topics such as sexuality, some cultural issues etc.  Since no possible answers are suggested respondents give a wide variety of answers and therefore data analysis can be difficult. Advantages of unstructured interview Disadvantages of unstructured interview i. They are flexible because there are no predetermined questions ii. Respondents freely give information iii.Information given is spontaneous and so reliable iv. A lot of information can be gathered v. The interviewer is able to respond to individual differences and situational characteristics. i. They are time consuming because the respondents may dwell too much on one on one issue ii. They are not systematic iii. The respondents may get become emotional , personal and get out of control iv. Responses may be irrelevant v. It may be difficult to analyze data b) SEMI STRUCTURED INTERVIEW It is a method of collecting data in which:-  The interviewer is guided by an interview guide or schedule. This a list of topics and questions to be asked to the respondents.
  • 29. Jane Muchembi 29 Advantages of semi-structured interview Disadvantages of semi-structured interview i.They are flexible because they consist of both open and closed questions ii.In-depth Information given iii.A lot of information can be gathered through closed-ended questions i. They are time consuming because the of open ended questions ii. It may be difficult to analyze data iii. The respondents may be cautious of the answers given in closed-ended questions c) STRUCTURED INTERVIEW It is a method of collecting data in which:-  The interviewer is guided by an instrument called interview guide or schedule.  All the respondents are subjected to the same questions. Advantages of structured interview Disadvantages of structured interview i. High reliability of information gathered because all the subjects are subjected to the same questions. ii. It gives in-depth information about particular cases of interest to the researcher. This is because the researcher seeks information on specific issues. iii. It is systematic. Researchers intensively investigate a particular issue before moving to the next. iv. It is time saving since the respondents simply answer what has been asked by researcher. v. The researcher gets a complete and detailed understanding of the issue from the respondents. vi. It is comprehensive and systematic since questions are formulated before the interview. vii. The data collected is quantifiable. i. The rigidity displayed by the researcher can affect the responses given. The respondents may feel as if he/she is under investigation and being probed. This may affect the responses as some may become hostile. ii. It is too formal. Since the researcher does the questioning and the respondents simply answers, the respondent may be too cautious of the answers given. The respondents may give answers he/she thinks are acceptable or will impress the researcher. iii. The researcher may miss out on some important points that are not included in the questions formulated. STEPS IN CONDUCT OF THE INTERVIEW The opening stages of an interview are particularly important. Saunders, Lewis and Thornhill (2003) make the following suggestions on conducting a semi- structured interview: i. The interviewee is thanked for agreeing to the meeting ii. The purpose of the research, its funding (if relevant) and progress to date are briefly outlined iii. The interviewee is given an assurance regarding confidentiality iv. The interviewee’s right not to answer questions is emphasized and the interview could be terminated at any time by the interviewee v. The interviewee is told about the use intended to be made of the data collected during and after the project
  • 30. Jane Muchembi 30 vi. The offer of any written documentation to the interviewee promised in advance of the meeting should be emphasized vii. The interviewer describes the process of the interview, e.g. approximate number and range of questions to be asked and the time it is likely to take. viii. The researcher would want to intervene in the following situations: a) If one group member was dominating the discussion b) If the group strayed from discussing the topic in question c) To encourage quieter members of the group to contribute to the discussion d) To resolve any conflicts that arose between group members PROBLEM AREAS ASSOCIATED WITH INTERVIEWS There are a number of potential problem areas associated with interviews: 1. Bias 2. Demeanour (character, appearance, behaviour) of interviewer 3. Suspicion of the interviewer 4. Conduct of interview 5. Confidentiality BIAS  Bias is one of the most significant issues in interviewing, as it can affect the responses of the interviewee to the interviewer, and vice versa.  Interviews are human encounters and a range of issues can influence and colour the perceptions of the people we encounter – including interviewers.  We like or dislike someone, often without quite knowing why, and this can affect our responses to them.  A range of factors can come into play: gender, race, age, speech, appearance and attitude.  Sexual bias is a particular significant factor. Rosenthal (1966) has suggested that there is the possibility of sexual bias in interviewers and that both male and female researchers behave more warmly towards female subjects than they do towards male subjects. DEMEANOUR OF INTERVIEWER  Generally speaking, we often like people who appear to like us!  The interviewer should then, appear to be interested in the interviewee, but in a neutral and detached way: ‘neutrally interested’ is perhaps the best way of describing the best interviewer- interviewee relationship.  The tone of voice of the interviewer is important, as it should project an impression of quiet confidence and quiet enthusiasm in the topic under discussion.  Torrington (1991) suggests that an open posture is best, where the interviewer sits slightly forward toward the interviewee, keeps regular eye contact, and avoids folded arms.  The interviewer must avoid appearing shocked, disbelieving or astonished by comments made by interviewees.  The interviewer wear clothes similar to those of the interviewees: too scruffy, or too over-dressed can affect the credibility of the interviewer.
  • 31. Jane Muchembi 31 SUSPICION OF THE INTERVIEWER  People are increasingly suspicious of interviewers and their motives.  Most people have experience of being stopped in the street by an interviewer who appears to be asking questions in a neutral way but is really seeking to make a marketing contact for a commercial organization.  The true purpose of the interview should be carefully explained to the interviewee and how the data collected will be used.  Wherever possible, the student researcher should have a letter from a University tutor explaining the research initiative, e.g. it is part of a legitimate first or post-graduate course.  Wherever possible, the interviewer should send details of the interview process and agenda to interviewees in advance, for example explaining the estimated length of time it will take, the aim and purpose of the questions to be asked and the range of questions likely to be asked. CONFIDENTIALITY  Part of the suspicion shown to ward interviewers concerns the issue of confidentiality, and interviewees may be worried about disclosing sensitive information in case it has negative repercussions in some way against them.  Interviewees may also be concerned that their personal details would be passed on to commercial organisations and that they would be subsequently pestered to buy things.  Interviewees must be given a complete reassurance about confidentiality and told who will see the data obtained – and don’t forget this is likely to include at least two university tutors and possibly one external examiner  The interviewee should be assured that his or her views will be generalized in the final report or that any direct quotes used would remain anonymous unless the interviewee wishes otherwise.  The interviewer needs subsequently to take pains to avoid revealing the identity of respondents by using false names and not giving any clues to the identity of any interviewee. 3. OBSERVATION It a method or technique of collecting data that uses tool or instrument called observation schedule or guide. It provides information about the actual behavior of the respondents. FORMS OF OBSERVATION a) Participant observation: is a qualitative data collection method in which the researcher becomes an active functioning member of the population being investigated e.g. a designer wishing to study university students dressing behavior enrolls as a student. Its emphasis is on discovering meanings that people attach to their actions (Saunders, Lewis and Adrian 2004 and Kombo and Tromp 2006). b) Structured observation: I quantitative and more concerned with frequency of those actions. The observer/researcher is an onlooker (Saunders, Lewis and Adrian 2004). c) Unstructured observation: The observer/researcher takes the position of an onlooker. Data collected is in descriptive accounts (Kombo and Tromp 2006).
  • 32. Jane Muchembi 32 ADVANTAGES OF PARTICIPANT OBSERVATION DISADVANTAGES OF PARTICIPANT OBSERVATION It allows the researcher to observe at first hand and get below the surface of a particular situation Access to an organization for overt participation may be very difficult It heightens the awareness of a researcher to social processes that can influence behaviour There may be role-conflict. Researchers may lose their objectivity if they become too close emotionally to the people they are observing. It allows the researcher to observe the relationship of different variables The researcher may encounter suspicion and even hostility from people, who suspect the motives for the research and may be worried about their livelihoods. It can enable a researcher to gain insights into a situation that otherwise would not have been recognized or observed The presence of a researcher (overt participation) can have an impact on the behaviour of the people being observed: the ‘observer effect’. They may change the way they behave if they are aware they are being observed. It can allow, in the case of overt participation, the researcher to gain the trust of the people being observed It is very time-consuming and can generate a large amount of data/commentary that will need to be collated Recording and collating data from observations can be difficult and the researcher may need to adopt structured observation, where tasks/responses etc. are identified and broken down into elements and the frequency of actions or responses noted and later collated. Taking notes in any covert situation presents real problems, as the researcher may not be a position to openly record observations. In this situation, the researcher must record his or her observations as soon as possible afterwards. 4. FOCUS GROUP DISCUSSIONS It a method or technique of collecting data in which data is collected through focus group discussions. According to Sekaran (2003) Focus Group Discussions:-  Comprise of 8-10 members with homogeneous characteristics relevant to the study, a moderator and recorder. The moderator leads the discussions on a specific and given topic for about two hours and recorder records all the proceedings.  Members are chosen on the basis of their expertise on the topic being discussed.  The unstructured and spontaneous responses are expected to reflect genuine opinions ideas and feelings of the members about the topic being discussed
  • 33. Jane Muchembi 33 STEPS TO FOLLOW WHEN COLLECTING DATA i. Acquire an introduction letter from the body or institution commissioning him/her to go and do research. This letter introduces the researcher to the people from whom assistance may be needed. ii. ii. Acquire a permit (permission to collect the data in the given area e.g. from the local authorities to avoid conflicts with them. iii. Arrange with the respondents when to meet (book appointment) i.e. do not ambush them as this could make them fail to cooperate. iv. Administer the instruments e.g. questionnaires v. Follow up non-respondents to increase responses e.g. by visiting them or making phone calls. ETHICAL ISSUES IN DATA COLLECTION They include:- i. The researcher must justify the research through balance of costs and benefits. Benefits should outweigh the costs. ii. The researcher must maintain confidentiality at all times. Only those who must know the respondents should know them. Unless it is inevitable to avoid knowing the identity of the respondents the research should avoid knowing them. iii. The researchers should be responsible of their own work and their contribution to the whole study. Accept individual responsibility and bear the consequences of the research. iv. The researcher must obtain informed consent from the subjects used in the study and must ensure that all the subjects participate voluntarily. v. The researcher must be open and honest in dealing with other researchers and research subjects i.e. must not exploit them by changing the agreements made with them. vi. The researcher must take all reasonable measures to protect the respondents physically and psychologically. vii. The researcher must fully explain the research in advance and debrief the subjects afterwards. Saunders, Lewis and Thornhill (2003, p. 131) summarise the main issues to consider, although the ethical issues surrounding these items are not always clear-cut: i. The rights of privacy of individuals ii. Voluntary nature of participation – and the rights of individuals to withdraw partially or completely from the process iii. Consent and possible deception of participants iv. Maintenance of the confidentiality of data provided by individuals or identifiable participants and their anonymity v. Reactions of participants to the ways in which researchers seek to collect data vi. Effects on participants of the way in which data is analyzed and reported vii. Behaviour and objectivity of the researcher 3.7 DATA ANALYSIS AND PRESENTATION Raw data means nothing to the researcher without it being analyzed and interpreted using proper tools. Data analysis refer to examining the data that has been collected and making deductions or
  • 34. Jane Muchembi 34 inferences or judgments or conclusions. It involves uncovering underlying structures, extracting important variables, detecting any anomalies and testing any underlying assumptions. It involves scrutinizing the acquired information and making inferences. Data analysis involves examining data in ways that reveal the relationships, patterns, trends, etc. that can be found within it. That may mean subjecting it to statistical operations that can tell you not only what kinds of relationships seem to exist among variables, but also to what level you can trust the answers you’re getting. It may mean comparing your information to that from other groups (a control or comparison group, statewide figures, etc.), to help draw some conclusions from the data. The point, in terms of your evaluation, is to get an accurate assessment in order to better understand your work and its effects on those you’re concerned with, or in order to better understand the overall situation. There are two kinds of data the researcher may be working with, although not all evaluations will necessarily include both:- i. Quantitative data This refers to the information that is collected as, or can be translated into, numbers, which can then be displayed and analyzed mathematically. Some examples include:  The frequency (rate, duration) of specific behaviors or conditions  Test scores (e.g., scores/levels of knowledge, skill, etc.)  Survey results (e.g., reported behavior, or outcomes to environmental conditions; ratings of satisfaction, stress, etc.)  Numbers or percentages of people with certain characteristics in a population (e.g. have design skills, have carpeted offices, wear high heeled shoes, buy second hand clothes etc.) Data can also be collected in forms other than numbers, and turned into quantitative data for analysis. Researchers can count the number of times an event is documented in interviews or records, for instance, or assign numbers to the levels of intensity of an observed event or behavior. For instance, community initiatives often want to document the amount and intensity of environmental changes they bring about – the new programs and policies that result from their efforts. Whether or not this kind of translation is necessary or useful depends on the nature of what you’re observing and on the kinds of questions your evaluation is meant to answer. Quantitative data is usually subjected to statistical procedures such as calculating the mean or average number of times an event or behavior occurs (per day, month, year). These operations, because numbers are “hard” data and not interpretation, can give definitive, or nearly definitive, answers to different questions. Various kinds of quantitative analysis can indicate changes in a dependent variable related to – frequency, duration, timing (when particular things happen), intensity, level, etc. They can allow you to compare those changes to one another, to changes in another variable, or to changes in another population. They might be able to tell you, at a particular degree of reliability, whether those changes are likely to have been caused by your intervention or program, or by another factor, known or unknown. And they can identify relationships among different variables, which may or may not mean that one causes another. ii. Qualitative data
  • 35. Jane Muchembi 35 These are data collected as descriptions, anecdotes, opinions, quotes, interpretations, etc., and are generally either not able to be reduced to numbers, or are considered more valuable or informative if left as narratives. As you might expect, quantitative and qualitative information needs to be analyzed differently. Unlike numbers or “hard data,” qualitative information tends to be “soft,” meaning it can’t always be reduced to something definite. That is in some ways a weakness, but it’s also a strength. A number may tell you how well a student did on a test; the look on her face after seeing her grade, however, may tell you even more about the effect of that result on her. That look can’t be translated to a number, nor can a teacher’s knowledge of that student’s history, progress, and experience, all of which go into the teacher’s interpretation of that look. And that interpretation may be far more valuable in helping that student succeed than knowing her grade or numerical score on the test. Qualitative data can sometimes be changed into numbers, usually by counting the number of times specific things occur in the course of observations or interviews, or by assigning numbers or ratings to dimensions (e.g., importance, satisfaction, ease of use). The challenges of translating qualitative into quantitative data have to do with the human factor. Even if most people agree on what 1 (lowest) or 5 (highest) means in regard to rating “satisfaction” with a program, ratings of 2, 3, and 4 may be very different for different people. Furthermore, the numbers say nothing about why people reported the way they did. One may dislike the program because of the content, the facilitator, the time of day, etc. The same may be true when you’re counting instances of the mention of an event, such as the onset of a new policy or program in a community based on interviews or archival records. Where one person might see a change in program he considers important another may omit it due to perceived unimportance. Qualitative data can sometimes tell you things that quantitative data can’t. It may reveal why certain methods are working or not working, whether part of what you’re doing conflicts with participants’ culture, what participants see as important, etc. It may also show you patterns – in behavior, physical or social environment, or other factors – that the numbers in your quantitative data don’t, and occasionally even identify variables that researchers weren’t aware of. NB: It is often helpful to collect both quantitative and qualitative information. Quantitative analysis is considered to be objective – without any human bias attached to it – because it depends on the comparison of numbers according to mathematical computations. Analysis of qualitative data is generally accomplished by methods more subjective – dependent on people’s opinions, knowledge, assumptions, and inferences (and therefore biases) – than that of quantitative data. The identification of patterns, the interpretation of people’s statements or other communication, the spotting of trends – all of these can be influenced by the way the researcher sees the world. Be aware, however, that quantitative analysis is influenced by a number of subjective factors as well. What the researcher chooses to measure, the accuracy of the observations, and the way the research is structured to ask only particular questions can all influence the results, as can the researcher’s understanding and interpretation of the subsequent analyses.
  • 36. Jane Muchembi 36 STEPS OF DATA ANALYSIS These days there are several user-friendly and interactive software programs that are used to analyze data such as Excel, SPSS, SAS, STATPAK, SYSTAT etc. They have an ability to interface with different databases and generate graphs and charts. In most social research the data analysis involves three major steps, done in roughly this order: i. Cleaning and organizing the data for analysis (Data Preparation) ii. Describing the data (Descriptive Statistics) iii. Testing Hypotheses and Models (Inferential Statistics) i. Cleaning and organizing the data for analysis/Preparing Data  Data Preparation involves checking or logging the data in; checking the data for accuracy; entering the data into the computer; transforming the data; and developing and documenting a database structure that integrates the various measures.  Once all of the participants have completed the study measures and all of the data has been collected, the researcher must prepare the data to be analyzed.  It involves:- i. Editing data: This involve checking data for accuracy and consistency. As soon as data is received you should screen it for accuracy. In some circumstances doing this right away will allow you to go back to the sample to clarify any problems or errors. There are several questions you should ask as part of this initial data screening:  Are the responses legible/readable?  Are all important questions answered? Sometimes a respondent may fail to answer a question like do you have any children? But answers the following related question “If yes how many? By writing five children. The researcher has to get back to the respondent to find out why the first question was left out or assume that the answer is yes.  Are the responses complete?  Is all relevant contextual information included (e.g., data, time, place, researcher)? In most social research, quality of measurement is a major issue. Assuring that the data collection process does not contribute inaccuracies will help assure the overall quality of subsequent analyses. ii. Handling blank responses: If many questions e.g. 25% of the questions are not answered you may decide to discard the questionnaire and not include it in data set for analysis and report or account for them in your report. If there are only a few blank responses then decide how to handle them. iii. Coding data: involves allocating codes to possible answers e.g. in a question where possible answers are yes or no, you may assign number one (1) to “yes” and (2) to “No”. Where there are five possible answers you can have codes 1-5. iv. Categorizing data: This involve grouping questions addressing the same variable together. v. Creating data file/ entering the Data into the Computer Key in or enter the data in the computer using a program of your choice e.g. spreadsheet, SPSS
  • 37. Jane Muchembi 37 There are a wide variety of ways to enter the data into the computer for analysis. Probably the easiest is to just type the data in directly. In order to assure a high level of data accuracy, the analyst should use a procedure called double entry. In this procedure you enter the data once. Then, you use a special program that allows you to enter the data a second time and checks each second entry against the first. If there is a discrepancy, the program notifies the user and allows the user to determine the correct entry. This double entry procedure significantly reduces entry errors. However, these double entry programs are not widely available and require some training. An alternative is to enter the data once and set up a procedure for checking the data for accuracy. For instance, you might spot check records on a random basis. Once the data have been entered, you will use various programs to summarize the data that allow you to check that all the data are within acceptable limits and boundaries. For instance, such summaries will enable you to easily spot whether there are persons whose age is 601 or who have a 7 entered where you expect a 1- to-5 response vi. Programming : NB:  Organizing the data correctly can save a lot of time and prevent mistakes.  Most researchers choose to use a database or statistical analysis program (Microsoft Excel, SPSS) that they can format to fit their needs in order to organize their data effectively.  A good researcher enters all of the data in the same format and in the same database, as doing otherwise might lead to confusion and difficulty with the statistical analysis later on.  Once the data has been entered, it is crucial that the researcher check the data for accuracy.  This can be accomplished by spot-checking a random assortment of participant data groups, but this method is not as effective as re-entering the data a second time and searching for discrepancies.  This method is particularly easy to do when using numerical data because the researcher can simply use the database program to sum the columns of the spreadsheet and then look for differences in the totals.  Perhaps the best method of accuracy checking is to use a specialized computer program that cross- checks double-entered data for discrepancies (as this method is free from error), though these programs can be hard to come by and may require extra training to use correctly. Developing a Database Structure The database structure is the manner in which you intend to store the data for the study so that it can be accessed in subsequent data analyses. You might use the same structure you used for logging in the data or, in large complex studies, you might have one structure for logging data and another for storing it. As mentioned above, there are generally two options for storing data on computer:- i. Database programs ii. Statistical programs. Usually database programs are the more complex of the two to learn and operate, but they allow the analyst greater flexibility in manipulating the data.
  • 38. Jane Muchembi 38 In every research project, you should generate a printed codebook that describes the data and indicates where and how it can be accessed. Minimally the codebook should include the following items for each variable:  variable name  variable description  variable format (number, data, text)  instrument/method of collection  date collected  respondent or group  variable location (in database)  notes The codebook is an indispensable tool for the analysis team. Together with the database, it should provide comprehensive documentation that enables other researchers who might subsequently want to analyze the data to do so without any additional information. Data Transformations Once the data have been entered it is almost always necessary to transform the raw data into variables that are usable in the analyses. There are a wide variety of transformations that you might perform. Some of the more common are:  missing values Many analysis programs automatically treat blank values as missing. In others, you need to designate specific values to represent missing values. For instance, you might use a value of -99 to indicate that the item is missing. You need to check the specific program you are using to determine how to handle missing values.  item reversals On scales and surveys, we sometimes use reversal items to help reduce the possibility of a response set. When you analyze the data, you want all scores for scale items to be in the same direction where high scores mean the same thing and low scores mean the same thing. In these cases, you have to reverse the ratings for some of the scale items. For instance, let's say you had a five point response scale for a self-esteem measure where 1 meant strongly disagree and 5 meant strongly agree. One item is "I generally feel good about myself." If the respondent strongly agrees with this item they will put a 5 and this value would be indicative of higher self esteem. Alternatively, consider an item like "Sometimes I feel like I'm not worth much as a person." Here, if a respondent strongly agrees by rating this a 5 it would indicate low self esteem. To compare these two items, we would reverse the scores of one of them (probably we'd reverse the latter item so that high values will always indicate higher self esteem). We want a transformation where if the original value was 1 it's changed to 5, 2 is changed to 4, 3 remains the same, 4 is changed to 2 and 5 is changed to 1. While you could program these changes as separate statements in most program, it's easier to do this with a simple formula like: New Value = (High Value + 1) - Original Value In our example, the High Value for the scale is 5, so to get the new (transformed) scale value, we simply subtract each Original Value from 6 (i.e., 5 + 1).  scale totals