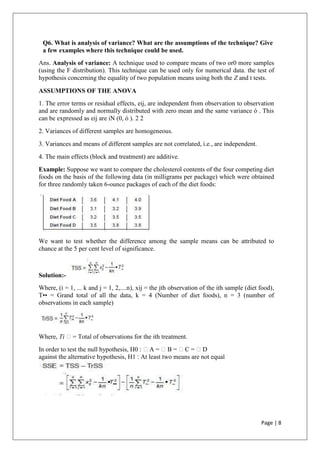
1. Page | 1
MB0050 – Research Methodology
Q1.Explain the process of problem identification with an example.
Ans. Problem Identification Process
The process of identifying the research problem involves the following steps:
1. Management decision problem
The entire process begins with the identification of the difficulty encountered by the
business manager/researcher. The manager might decide to conduct the study himself or
gives it to a researcher or a research agency. Thus this step requires that there must be
absolute clarity about what is the purpose of getting a study done.
2. Discussion with subject experts
The next step involves getting the problem in the right perspective through discussions
with industry and subject experts. These individuals are knowledge able about the
industry as well as the organization. They could be found both within and outside the
company.
3. Review of existing literature
A literature review is a comprehensive collection of the information obtained from
published and unpublished sources of data in the specific area of interest to the researcher.
This may include journals, newspapers, magazines, reports, government publications.
4. Organizational analysis
Another significant source for deriving the research problem is the industry and
organizational data. In case the researcher/investigator is the manager himself herself, the
data might be easily available.
5. Qualitative survey
Sometimes the expert interview, secondary data and organizational information might not
be enough to define the problem. In such a case, a small exploratory qualitative survey can
be done to understand the reason for some . For example, a soap like Dove may be very
good in terms of price and quality but very few people in the smaller towns buy it.
6. Management research problem
Once the audit process of secondary review and interviews and survey is over, the
researcher is ready to focus and define the issues of concern, that need to be investigated
further, in the form of an unambiguous and clearly defined research problem. Here, it is
important to remember that simply using the word ‘problem’ does not mean that there is
something wrong that has to be corrected, it simply indicates the gaps in information or
knowledge base available to the researcher.
7. Theoretical foundation and model building
2. Page | 2
Having identified and defined the variables under study, the next step is to try and form a
theoretical framework. It can be best understood as a schema or network of the probable
relationship between the identified variables. Another advantage of the model is that it
clearly shows the expected direction of the relationships between the concepts.
8. Statement of research objectives
Next, the research question(s) that were formulated need to be broken down as tasks or
objectives that need to be met in order to answer the research question.
Example
The Turnover Intention Model
The proposed model to predict turnover intention is specified as mentioned below:
TI = f (WE, OC, A, MS, TWE) ...(1)
Where, TI = Turnover intention
WE = Work exhaustion
OC = Organizational commitment
A = Age
MS = Marital status
TWE = Total work experience
The theoretical construct of work exhaustion is influenced by Perceived Workload (PWL),
Fairness of Reward (FOR), Job Autonomy (JA) and Work Family Conflict (WFC)
This can be mathematically written as:
WE = f (PWL, FOR, JA, WFC) ...(2)
Similarly, Organizational Commitment depends upon Job Autonomy, Work–Family
Conflict, Fairness of Reward and Work Exhaustion (WE) . Therefore, this can be stated
mathematically as
OC = f (JA, WFC, FOR, WE) ...(3)
3. Page | 3
Q2. Interview method involves a dialogue between the Interviewee and the
Interviewer. Explain the interview method of data collection. What are the uses of
this technique? What are the different types of interviews?
Ans. Personal methods: These are the traditional one-to-one methods that have been used
actively in all branches of social sciences. However, they are distinguished in terms of the
place of conduction.
• At-home interviews: This face-to-face interaction takes place at the respondent’s
residence. Thus, the interviewer needs to initially contact the respondent to ascertain the
interview time.
• Mall-intercept interviews: As the name suggests, this method involves conducting
interviews with the respondents as they are shopping in malls. Sometimes, product testing
or product reactions can be carried out through structured methods and followed by 20–30
minute interviews to test the reactions.
• Computer-assisted personal interviewing (CAPI): This technique is carried out with the
help of the computer. In this form of interviewing, the respondent faces an assigned
computer terminal and answers a questionnaire on the computer screen by using the
keyboard or a mouse.
Telephone method: The telephone method replaces the face-to-face interaction between
the interviewer and interviewee, by calling up the subjects and asking hem a set of
questions. The advantage of the method is that geographic boundaries are not a constraint
and the interview can be conducted at the individual respondent’s location.
• Traditional telephone interviews: The process can be accomplished using the traditional
telephone for conducting the questioning.
• Computer-assisted telephone interviewing: In this process, the interviewer is replaced
by the computer and it involves conducting the telephonic interview using a computerized
interview format.
Uses of the interview method
The interview has varied applications in business research and can be used effectively in
various stages.
• Problem definition: The interview method can be used right in the beginning of the
study. Here, the researcher uses the method to get a better clarity about the topic under
study.
• Exploratory research: Here because the structure is loose this method can be actively
used.
• Primary data collection: There are situations when the method is used as a primary
method of data collection, this is generally the case when the area to be investigated is high
on emotional responses
Types of interviews:
4. Page | 4
Unstructured: There are no specifications in the wording of the questions or the order of the
questions. The interviewer forms questions as and when required. The structure of the
interview is flexible.
Structured: Is based on the structured interview-guide which is little different from the
questionnaire. It is a set of specific points and definite questions prepared by the
interviewer.
Standardized: In standardized interviews, answer to each question is standardized as it is
determined by a set of response categories given for this purpose. The respondents are
expected to choose one of the given options as the answer.
Unstandardized: Is one in which the responses are left open to the respondent. This is
used mainly in qualitative research.
Individual: Where the interviewer interviews only one respondent at a time.
Group interview: More than one respondent are interviewed simultaneously. The group
can be small, say, of two individual (e.g., husband and wife, or two co-workers in a
factory) or large, say, of 10 to 20 persons (say students in a class).
Self-administered: The respondent is supplied a list of questions along with instructions
for writing answers in the appropriate place on the interview form.
Other-administered: The interviewer himself writes answers to questions on the response
sheet.
Unique: Is one which the interviewer collects entire information in one interview.
Panel interviews: The interviewer collects information from the same group of
respondents two or more times at regular intervals. If different respondents are involved in
various stages for asking the same question, it is called Trend Study.
Soft interview: Here the interviewer guides the respondents without putting any pressure
on them.
Hard interview: Here, the interview resembles a police interrogation. The interviewer
questions the validity and completeness of the answers obtained, often warning the
respondents not to lie and forcing them to give an answer when they hesitate.
Personal interviews: There is face to face contact between the interviewer and the
interviewee.
Non-personal interviews: No face-to-face contact, but the information is collected through
telephone, computer or some other medium.
5. Page | 5
Q3. A study of different sampling methods is necessary because precision, accuracy,
and efficiency of the sample results depend on the method employed for selecting
the sample. Explain the different types of Probability and Non-Probability
sampling designs.
Ans. Probability Sampling Design
Simple random sampling with replacement (SRSWR)
Under this scheme, a list of all the elements of the population from where the samples are
to be drawn is prepared..
Simple random sampling without replacement (SRSWOR)
In case of simple random sample without replacement, the procedure is identical to what
was explained in the case of simple random sampling with replacement..
Systematic sampling
Systematic sampling takes care of the limitation of the simple random sampling that the
sample may not be a representative one. In this design, the entire population is arranged in
a particular order.
Stratified random sampling
Under this sampling design, the entire population (universe) is divided into strata (groups),
which are mutually exclusive and collectively exhaustive. By mutually exclusive, it is
meant that if an element belongs to one stratum, it cannot belong to any other stratum.
Non-probability Sampling Designs
Convenience sampling
Convenience sampling is used to obtain information quickly and inexpensively. The only
criterion for selecting sampling units in this scheme is the convenience of the researcher or
the investigator.
Judgemental sampling
Under judgemental sampling, experts in a particular field choose what they believe to be
the best sample for the study in question.
Quota Sampling
In quota sampling, the sample includes a minimum number from each specified subgroup
in the population.
Snowball sampling
Snowball sampling is generally used when it is difficult to identify the members of the
desired population, e.g., deep-sea divers, families with triplets, people using walking sticks,
doctors specializing in a particular ailment, etc.
6. Page | 6
Q4 a. Differentiate between descriptive and inferential analysis of data.
Ans. Descriptive vs Inferential Analysis
At the data analysis stage, the first step is to describe the sample which is followed by
inferential analysis. In the descriptive analysis, we describe the sample whereas the
inferential analysis deals with generalizing the results as obtained from the sample.
Descriptive Analysis
Descriptive analysis refers to transformation of raw data into a form that willfacilitate easy
understanding and interpretation. Descriptive analysis deals with summary measures
relating to the sample data. The common ways of summarizing data are by calculating
average, range, standard deviation, frequency and percentage distribution. Below is a set
of typical questions that are required to be answered under descriptive statistics:
Inferential Analysis
After descriptive analysis has been carried out, the tools of inferential statistics are applied.
Under inferential statistics, inferences are drawn on population parameters based on
sample results. The researcher tries to generalize the results to the population based on
sample results. The analysis is based on probability theory and a necessary condition for
carrying out inferential analysis is that the sample should be drawn at random. The
following is an illustrative list of questions that are covered under inferential statistics.
b. Explain with examples various measures of Central Tendency.
Ans. Measures of Central Tendency
There are three measures of central tendency that are used in research—mean, median
and mode.
1. Mean
The mean represents the arithmetic average of a variable is appropriate for interval and
ratio scale data.
2. Median
The median can be computed for ratio, interval or ordinal scale data. The median is that
value in the distribution such that 50 per cent of the observations are below it and 50 per
cent are above it. The median for the ungrouped data is defined as the middle value
when the data is arranged in ascending or descending order of magnitude.
3. Mode
The mode is that measure of central tendency which is appropriate for nominal or higher
order scales. It is the point of maximum frequency in a distribution around which other
items of the set cluster densely. Mode should not be computed for ordinal or interval
data unless these data have been grouped first.
7. Page | 7
Q5. The chi-square test is widely used in research. Discuss the various applications
of chi-square test. Under what conditions is this test applicable?
Ans. The chi-square test is widely used in research. For the use of chi-square test, data is
required in the form of frequencies. Data expressed in percentages or proportion can also
be used, provided it could be converted into frequencies. The majority of the applications
of chi-square (χ2) are with discrete data. The test could also be applied to continuous data,
provided it is reduced to certain categories and tabulated in such a way that the chi-square
may be applied.
There are many applications of a chi-square test. Some of them mentioned below
• A chi-square test for the goodness of fit
• A chi-square test for the independence of variables
• A chi-square test for the equality of more than two population proportions.
A Chi-square Test for the Goodness of Fit
the data in chi-square tests is often in terms of counts or frequencies. The actual survey
data may be on a nominal or higher scale of measurement. If it is on a higher scale of
measurement, it can always be converted into categories. The real world situations in
business allow for the collection of count data, e.g., gender, marital status, job
classification, age and income. Therefore, a chi-square becomes a much sought after tool
for analysis.
A Chi-square Test for Independence of Variables
The chi-square test can be used to test the independence of two variables each having at
least two categories. The test makes use of contingency tables, also referred to as cross-
tabs with the cells corresponding to a cross classification of attributes or events
A Chi-square Test for the Equality of More than
Two Population Proportions
the researchers may be interested to test whether the proportion of a particular
characteristic is the same in several populations. The interest may lie in finding out
whether the proportion of people liking a movie is the same for the three age groups — 25
and under, over 25 and under 50, and 50 and over.
8. Page | 8
Q6. What is analysis of variance? What are the assumptions of the technique? Give
a few examples where this technique could be used.
Ans. Analysis of variance: A technique used to compare means of two or0 more samples
(using the F distribution). This technique can be used only for numerical data. the test of
hypothesis concerning the equality of two population means using both the Z and t tests.
ASSUMPTIONS OF THE ANOVA
1. The error terms or residual effects, eij, are independent from observation to observation
and are randomly and normally distributed with zero mean and the same variance ó . This
can be expressed as eij are iN (0, ó ). 2 2
2. Variances of different samples are homogeneous.
3. Variances and means of different samples are not correlated, i.e., are independent.
4. The main effects (block and treatment) are additive.
Example: Suppose we want to compare the cholesterol contents of the four competing diet
foods on the basis of the following data (in milligrams per package) which were obtained
for three randomly taken 6-ounce packages of each of the diet foods:
We want to test whether the difference among the sample means can be attributed to
chance at the 5 per cent level of significance.
Solution:-
Where, (i = 1, ... k and j = 1, 2,....n), xij = the jth observation of the ith sample (diet food),
T•• = Grand total of all the data, k = 4 (Number of diet foods), n = 3 (number of
observations in each sample)
Where, Ti = Total of observations for the ith treatment.
In order to test the null hypothesis, H0 : A = B = C = D
against the alternative hypothesis, H1 : At least two means are not equal