Downloaded 108 times

The document outlines a collaboration between PSEG and Tata Consultancy Services (TCS) to enhance PSEG's debt collection process. Key challenges included inefficiencies in manual processes and high delinquency rates, which TCS addressed by automating various aspects of collections and ensuring better monitoring and prioritization of accounts. Post-implementation, PSEG saw significant improvements in performance metrics, reduced bad debt, and improved customer relationships.
Introduction to the presentation about transforming PSEG's debt collection process, focusing on operational challenges and TCS's solution approach.
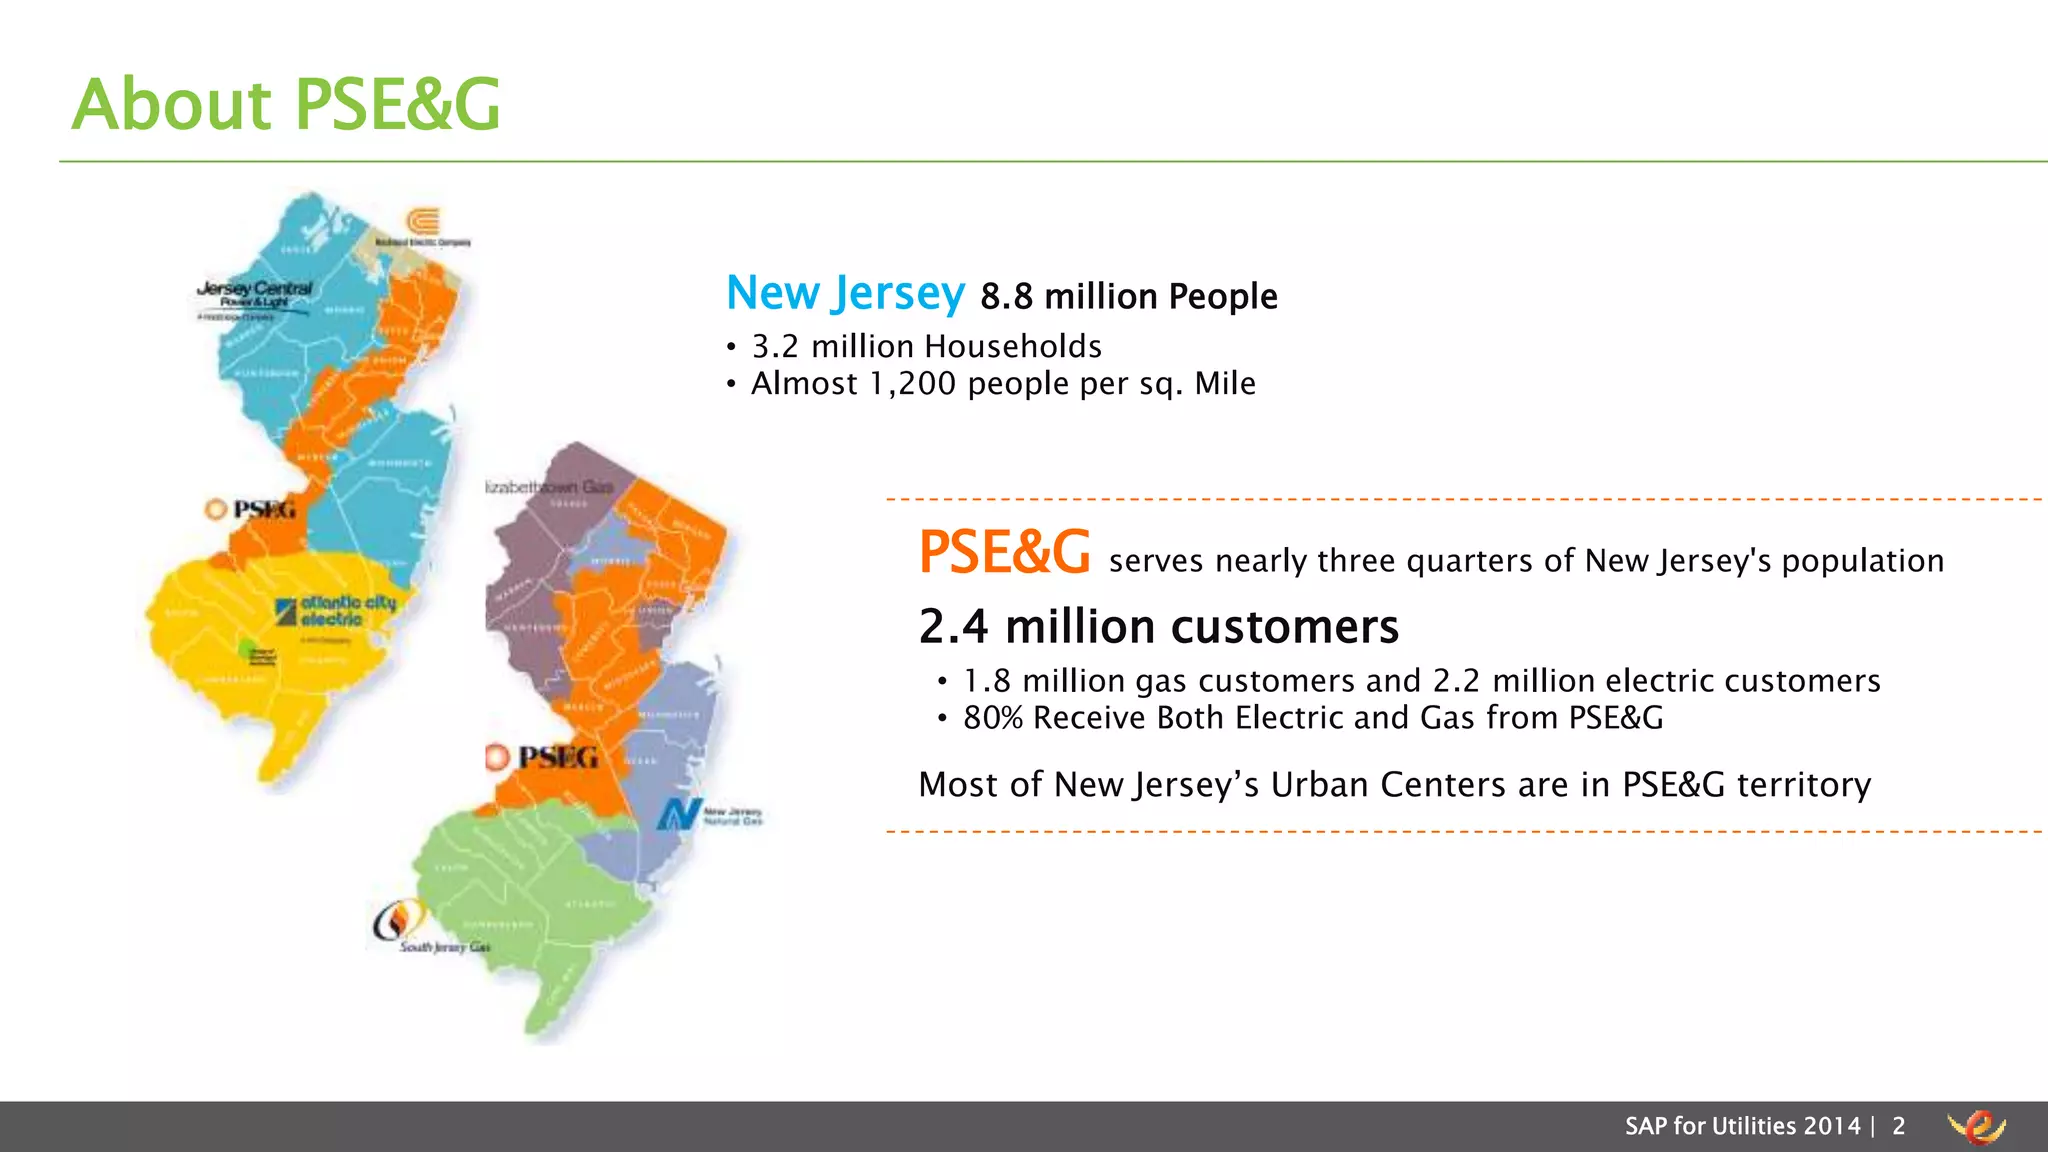
PSEG serves 2.4 million customers in New Jersey with a diverse population and utility services, highlighting operational scale.
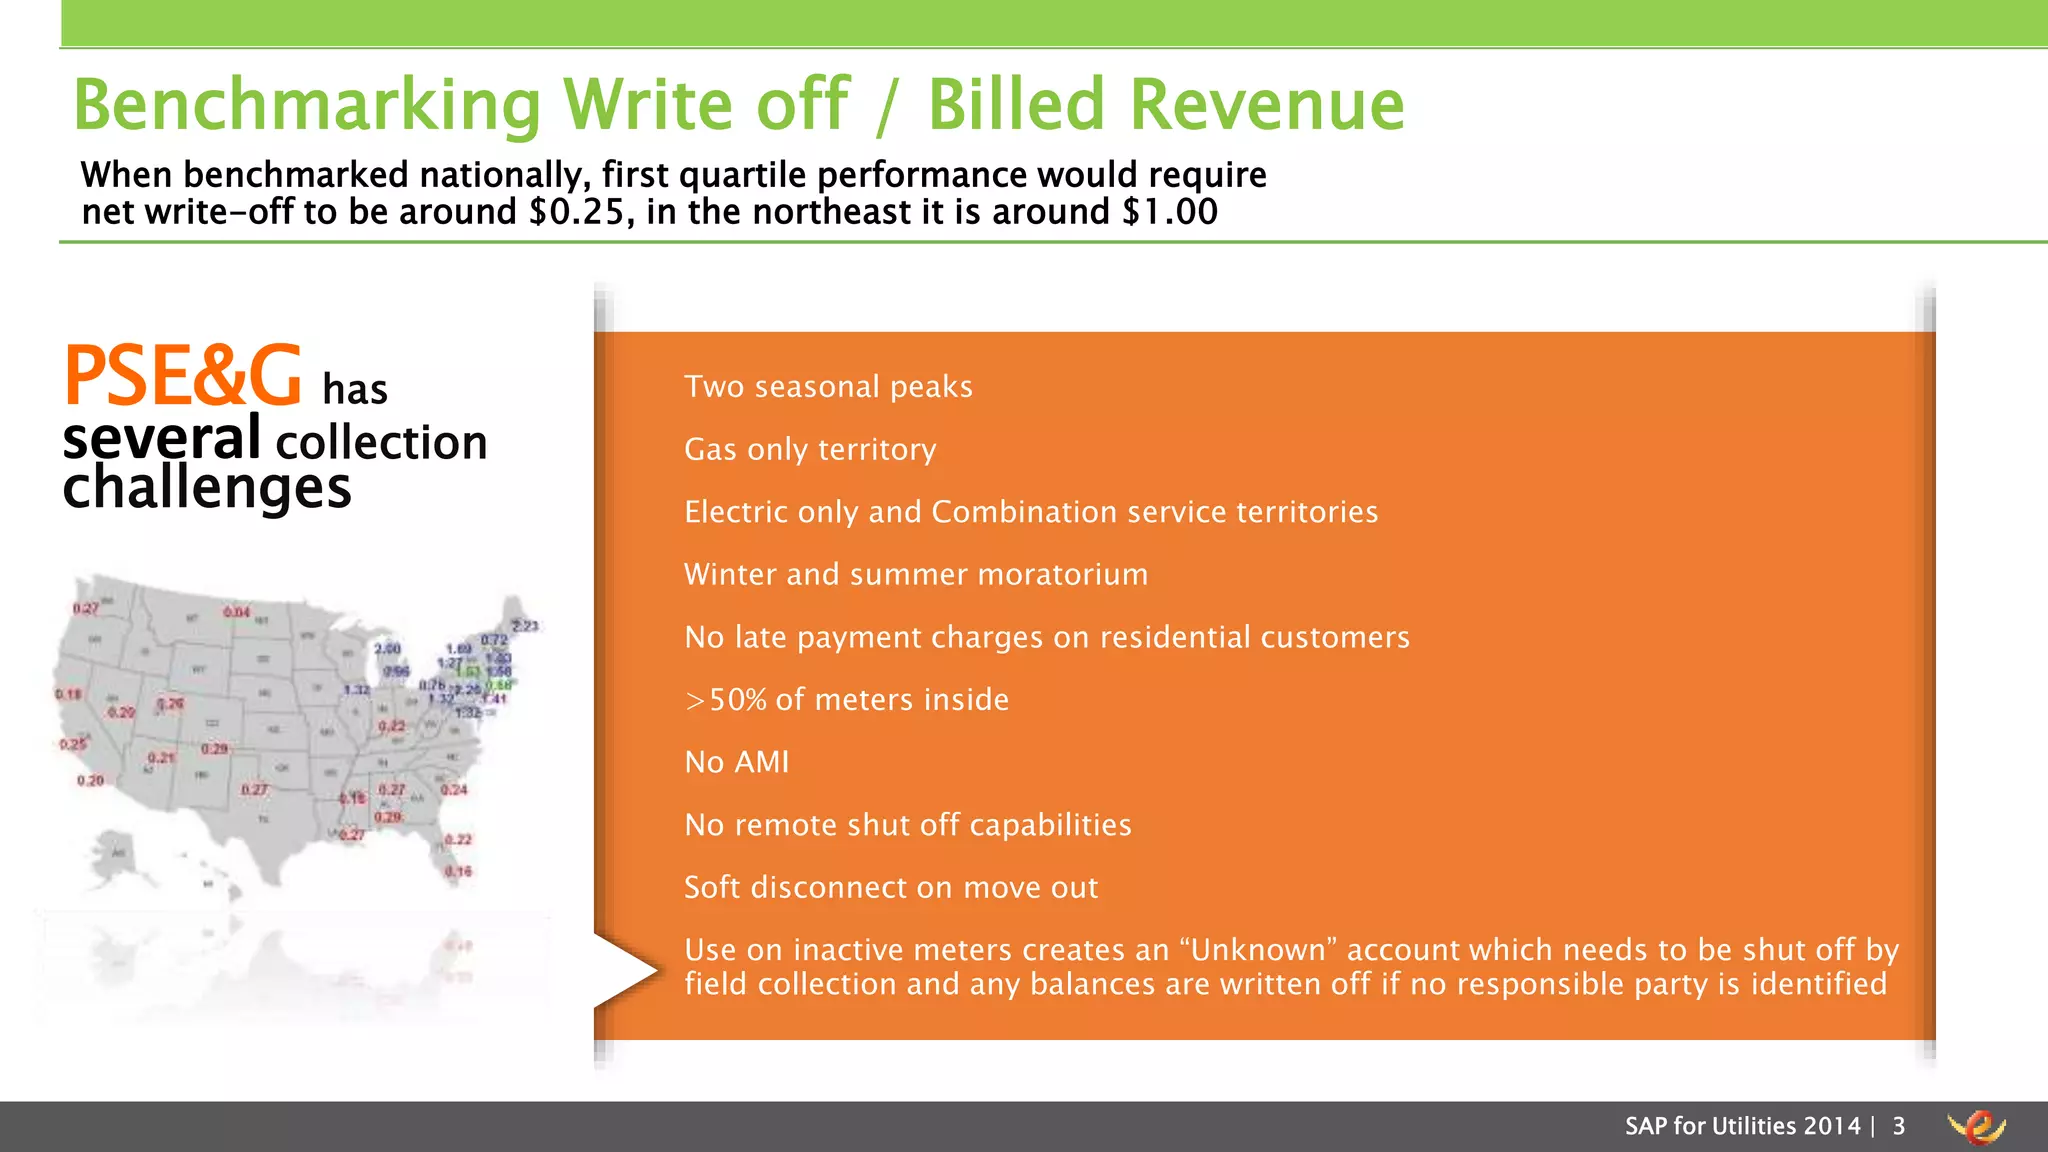
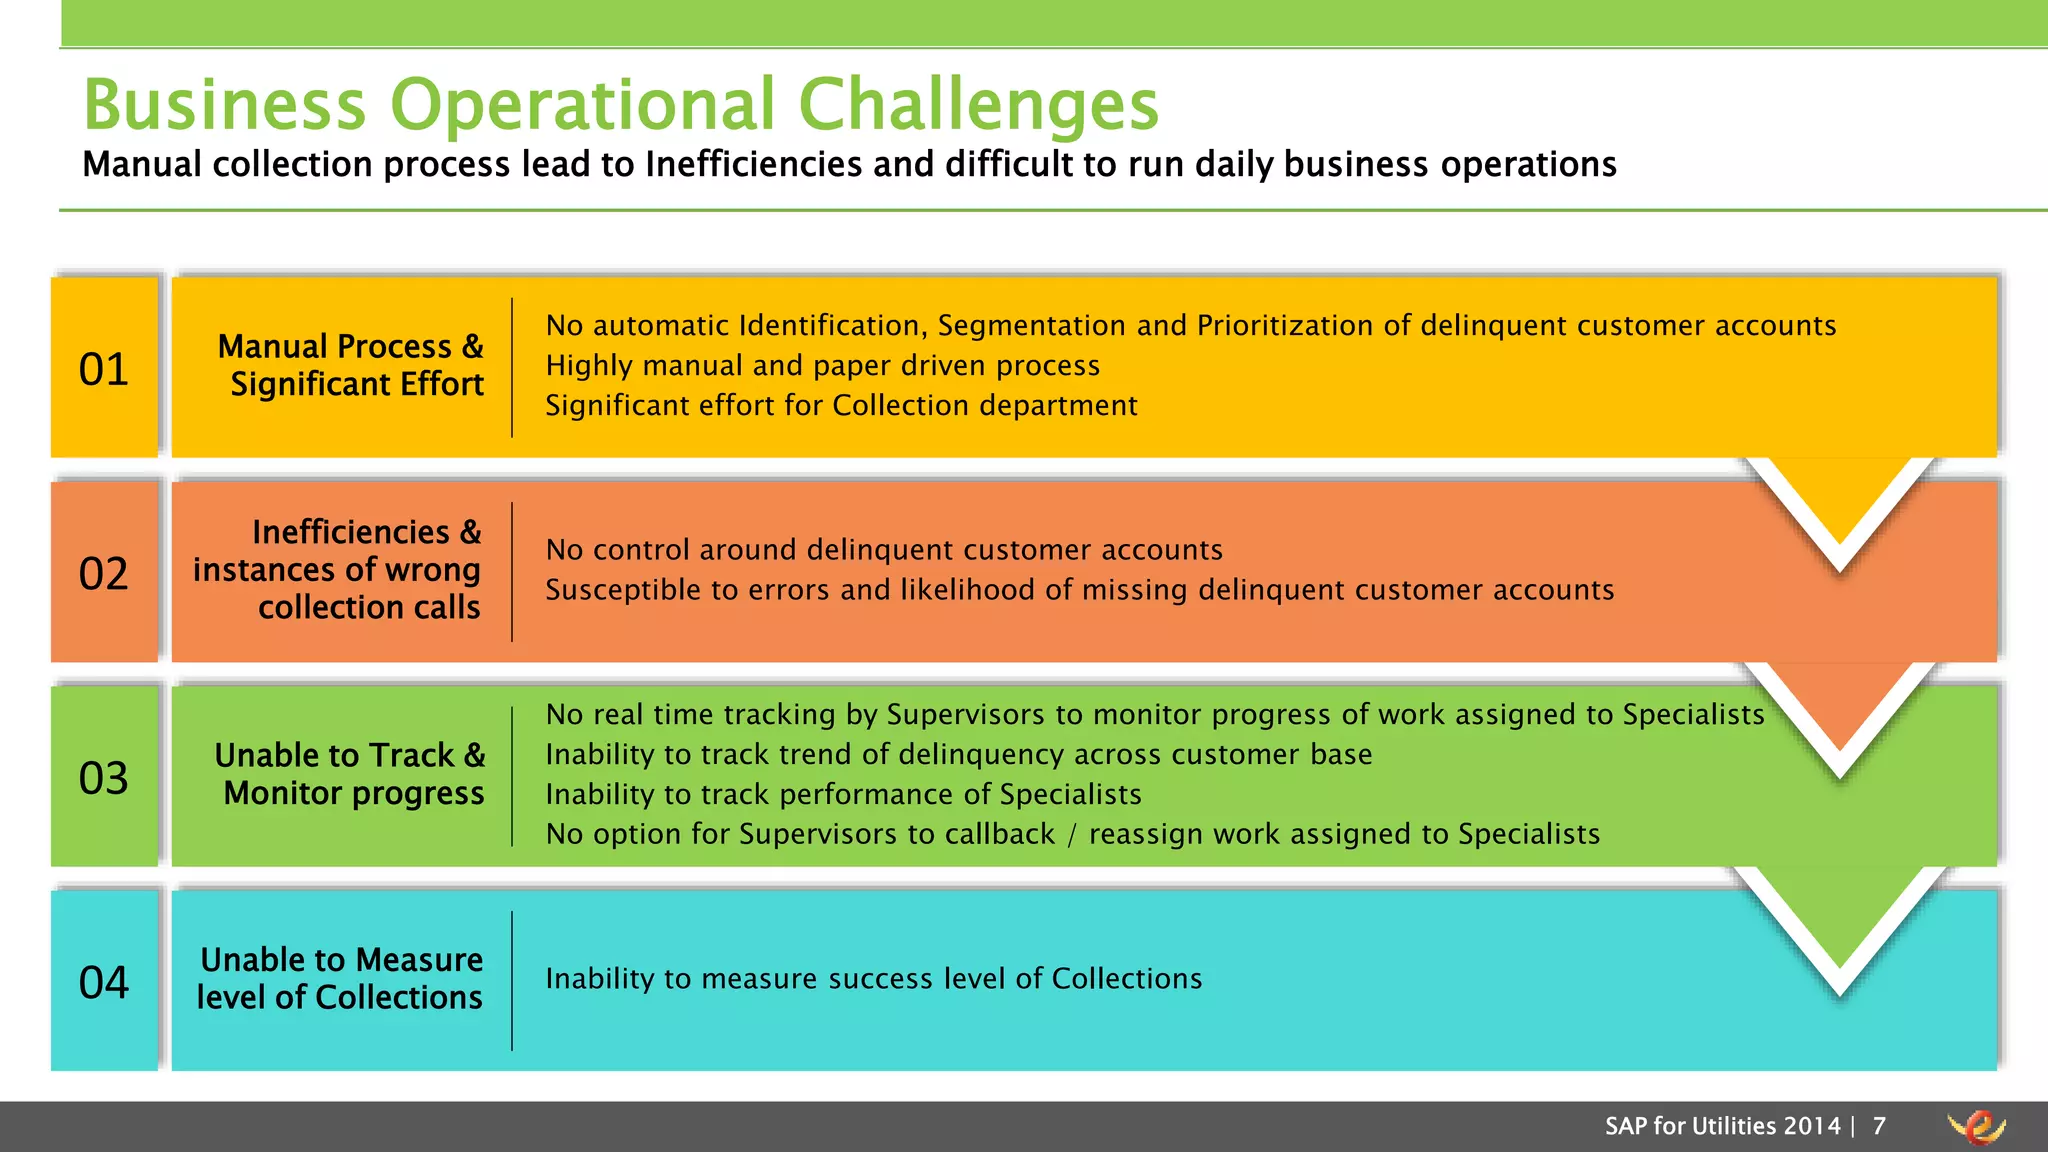
Discussion of PSEG's debt collection challenges, including high write-offs, manual processes, and inefficiencies.
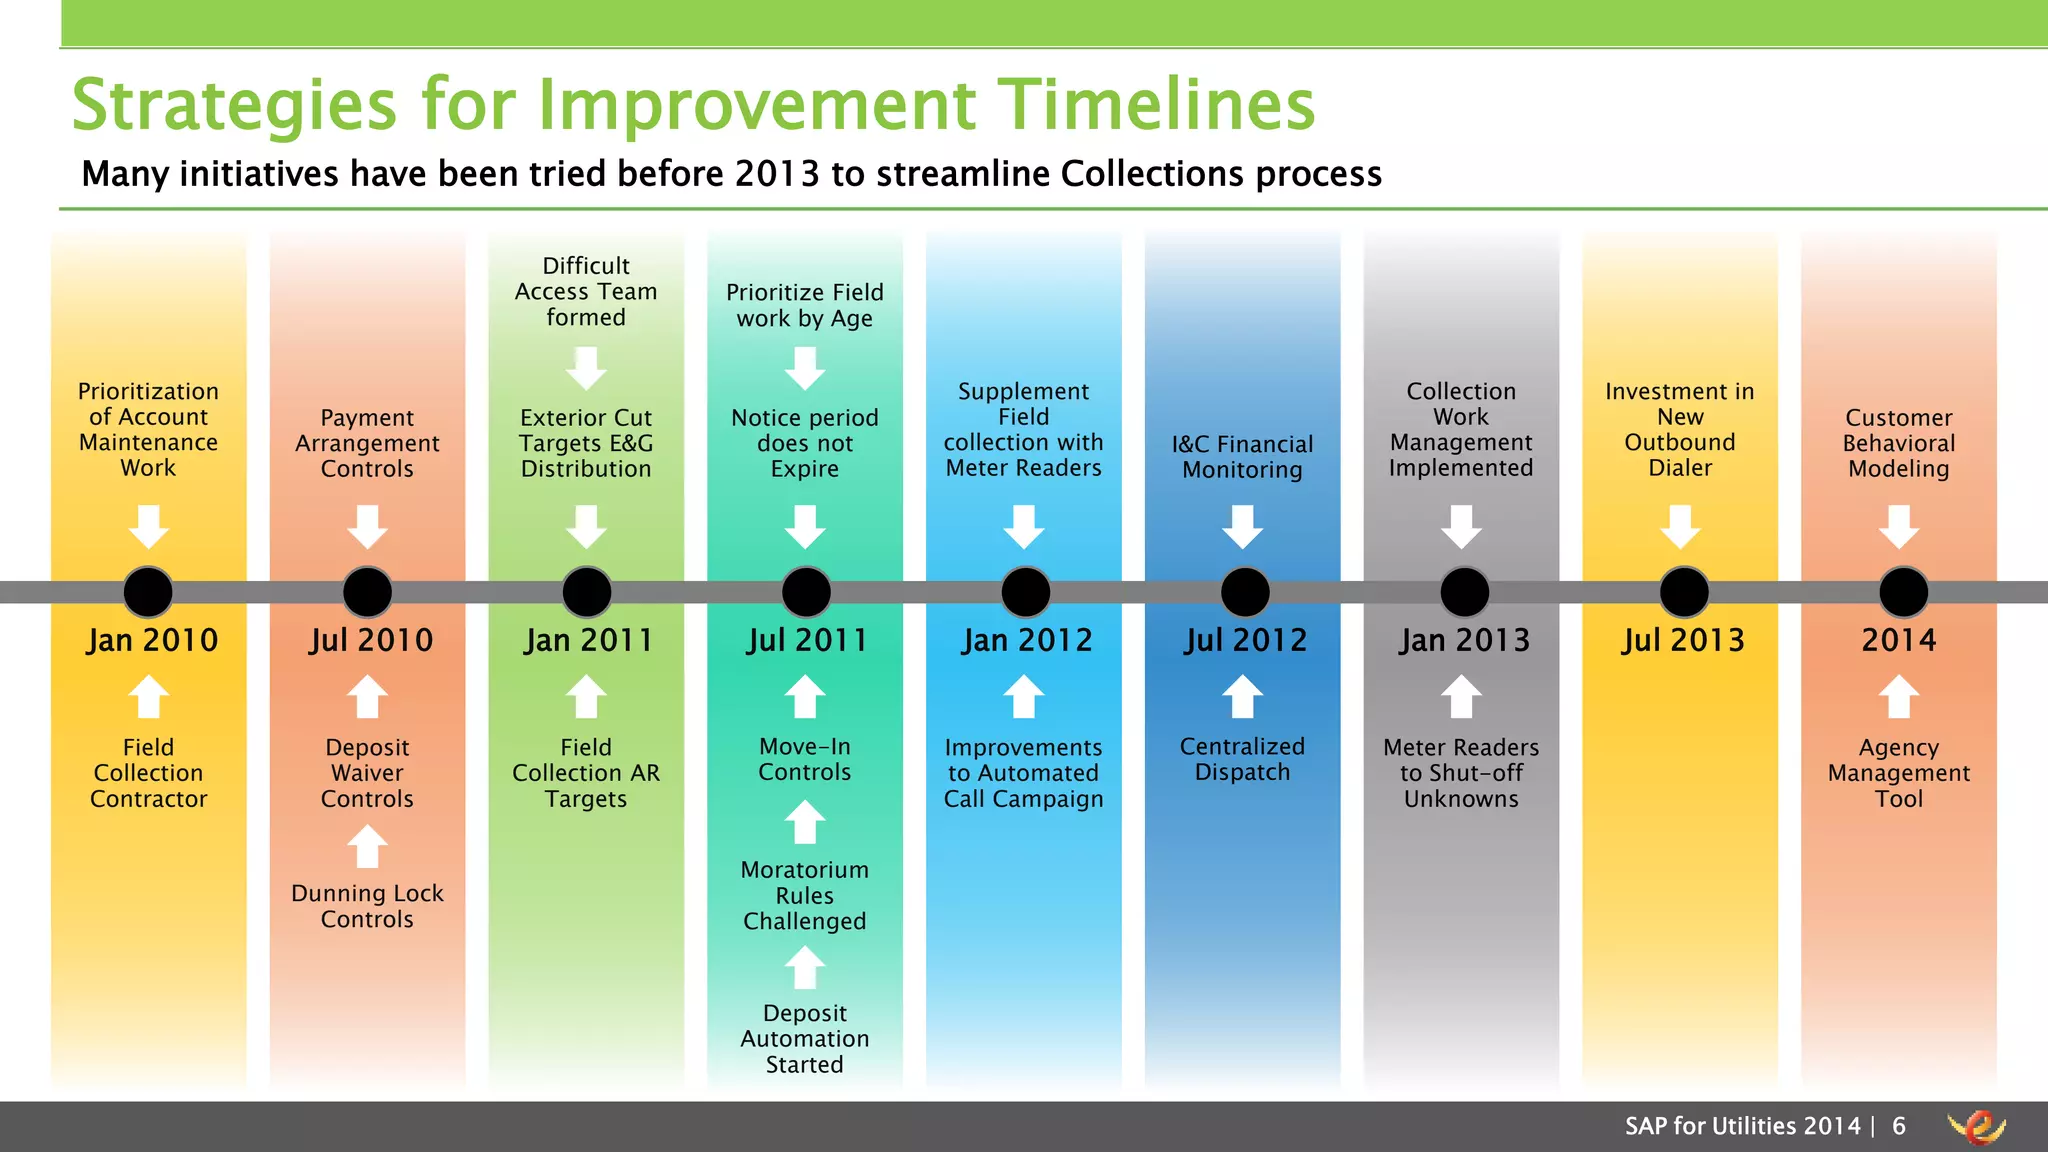
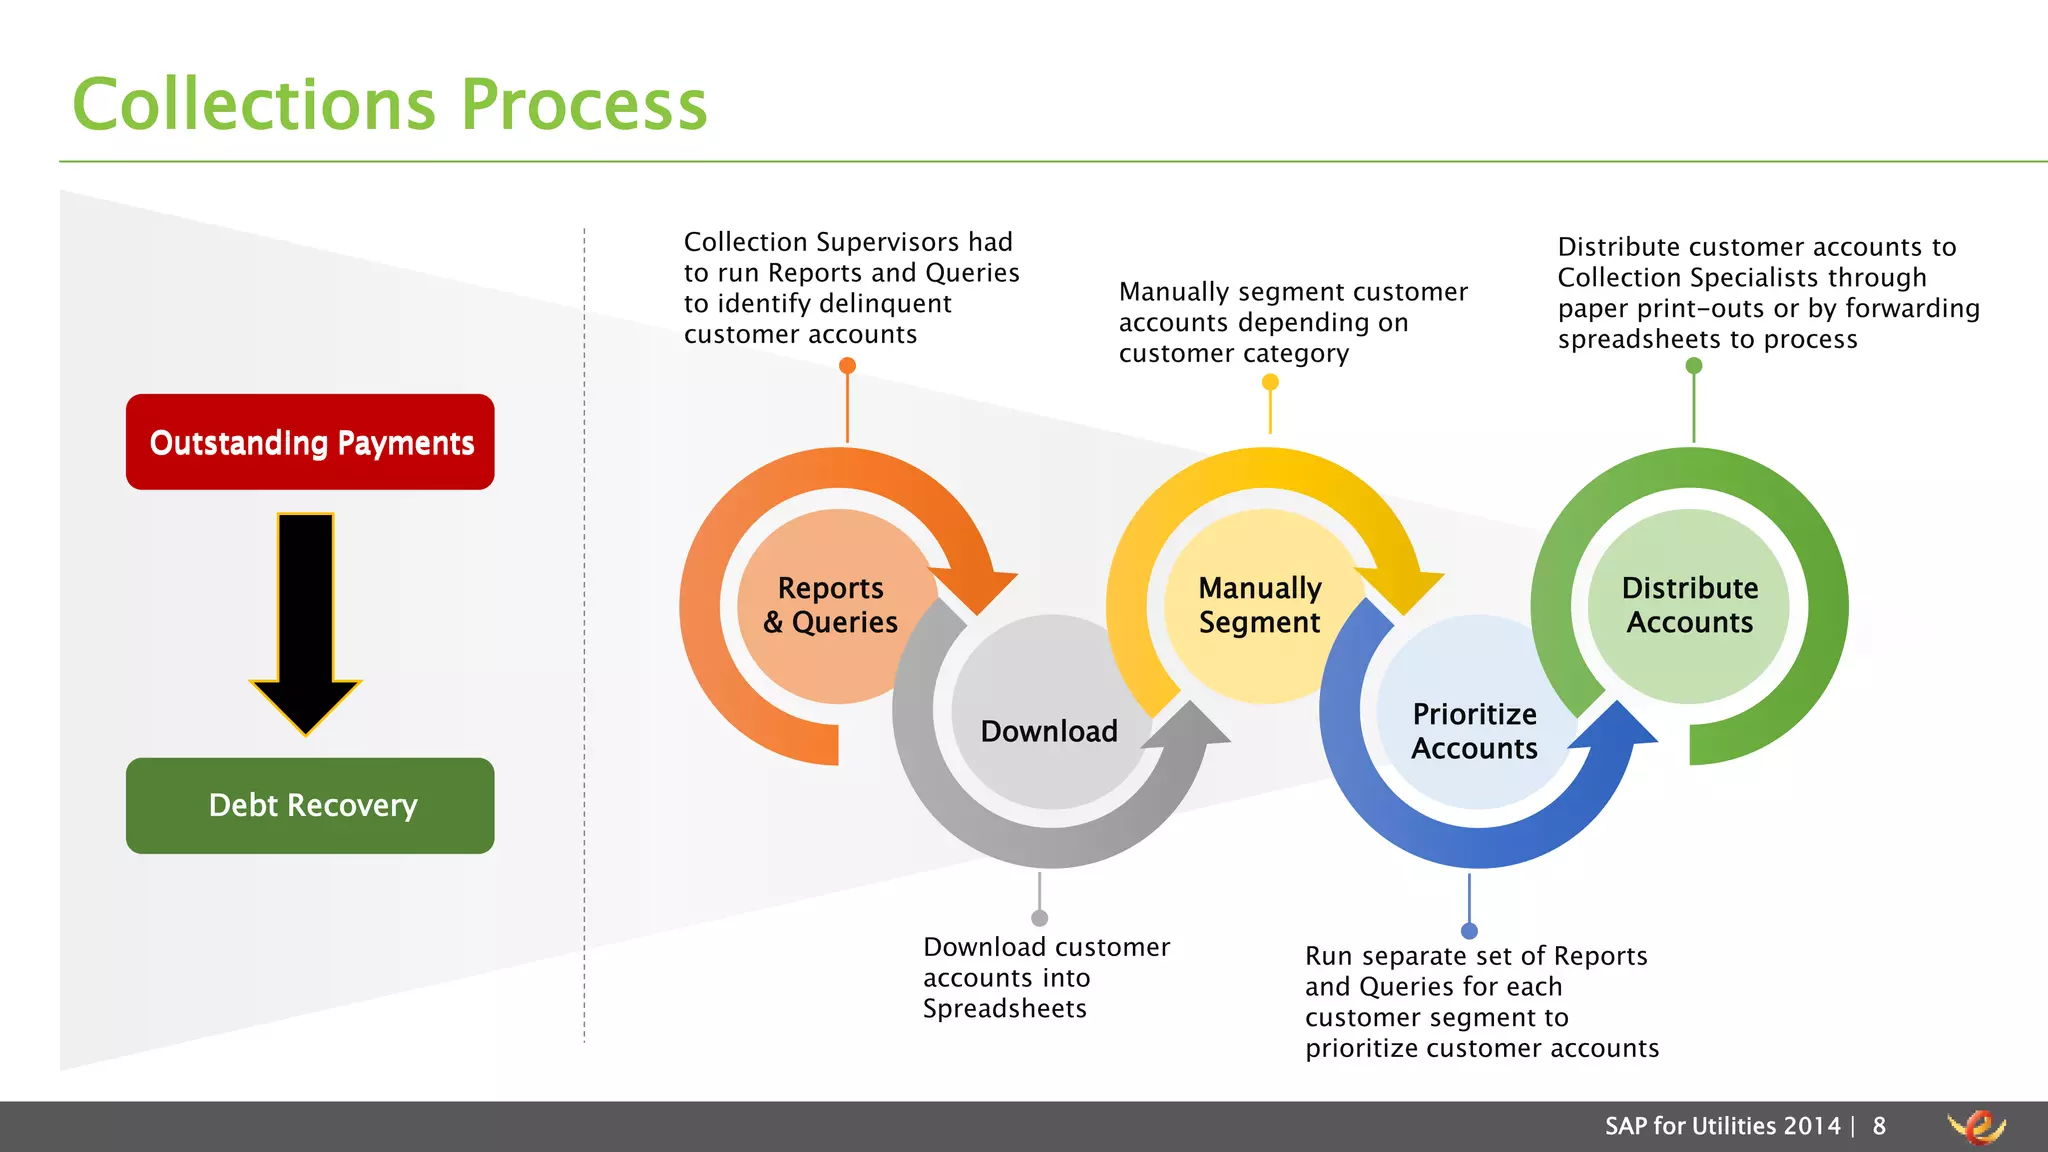
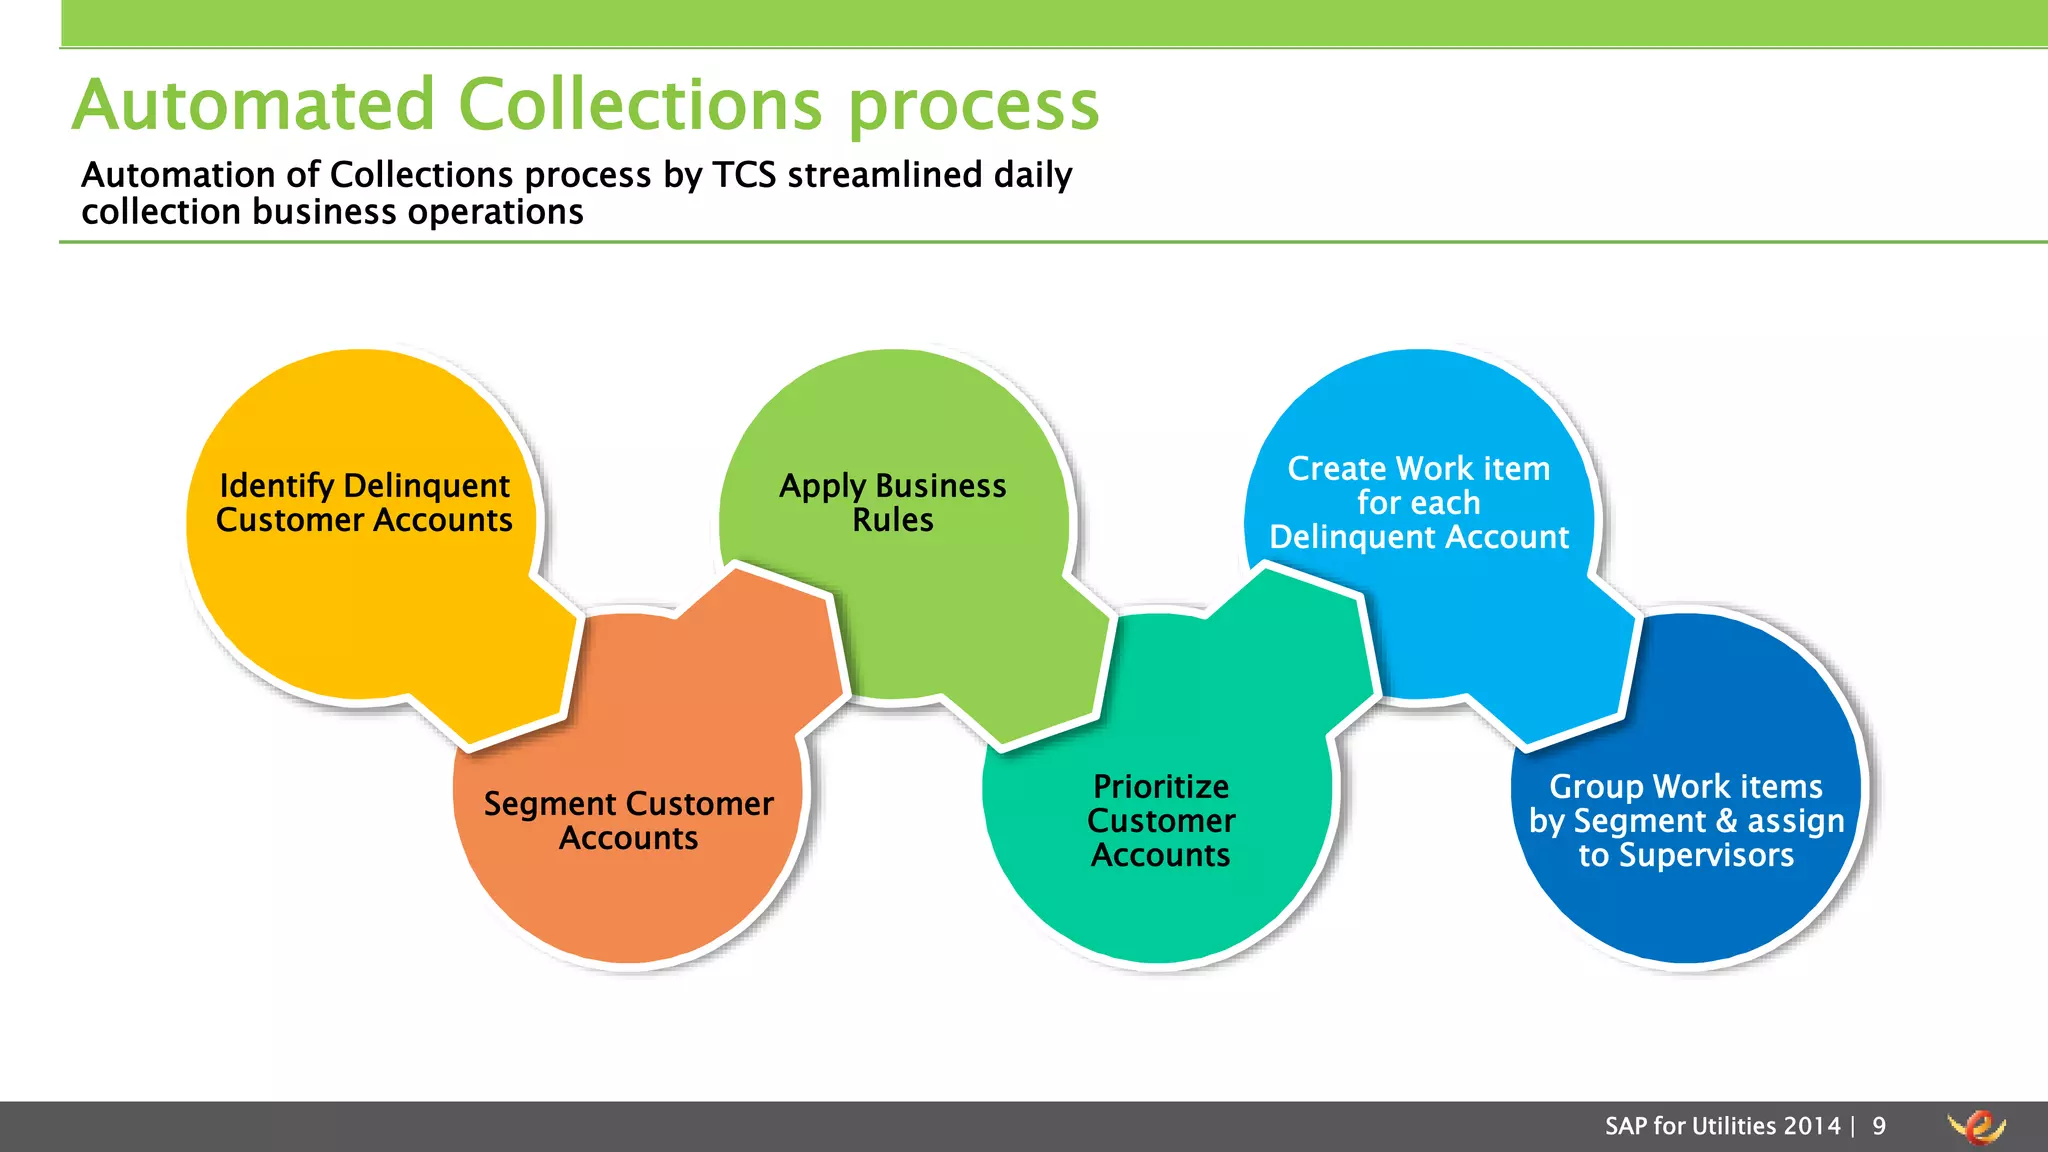
Current manual debt collection processes outlined with inefficiencies and transition toward an automated system for better segmentation and prioritization.
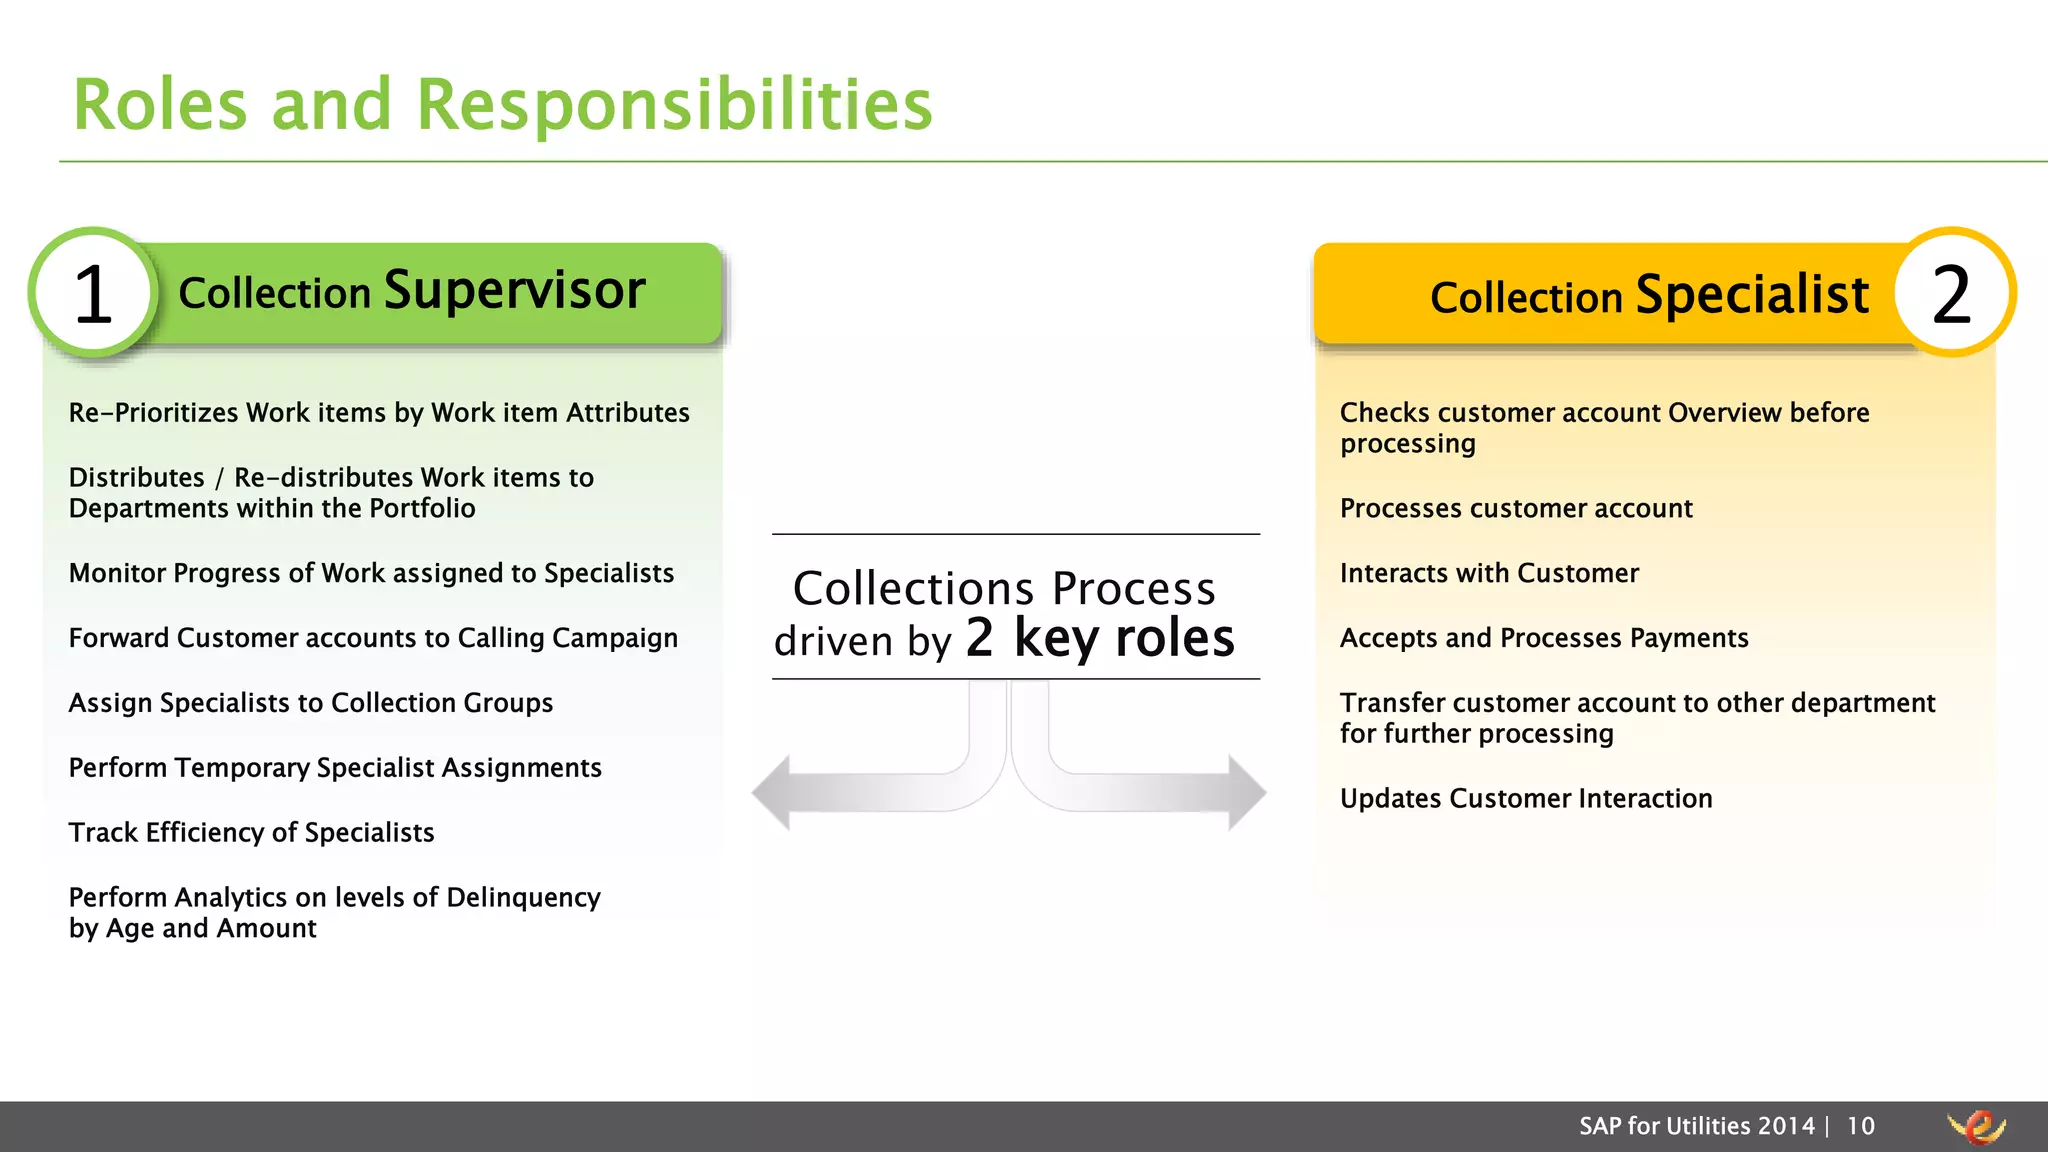
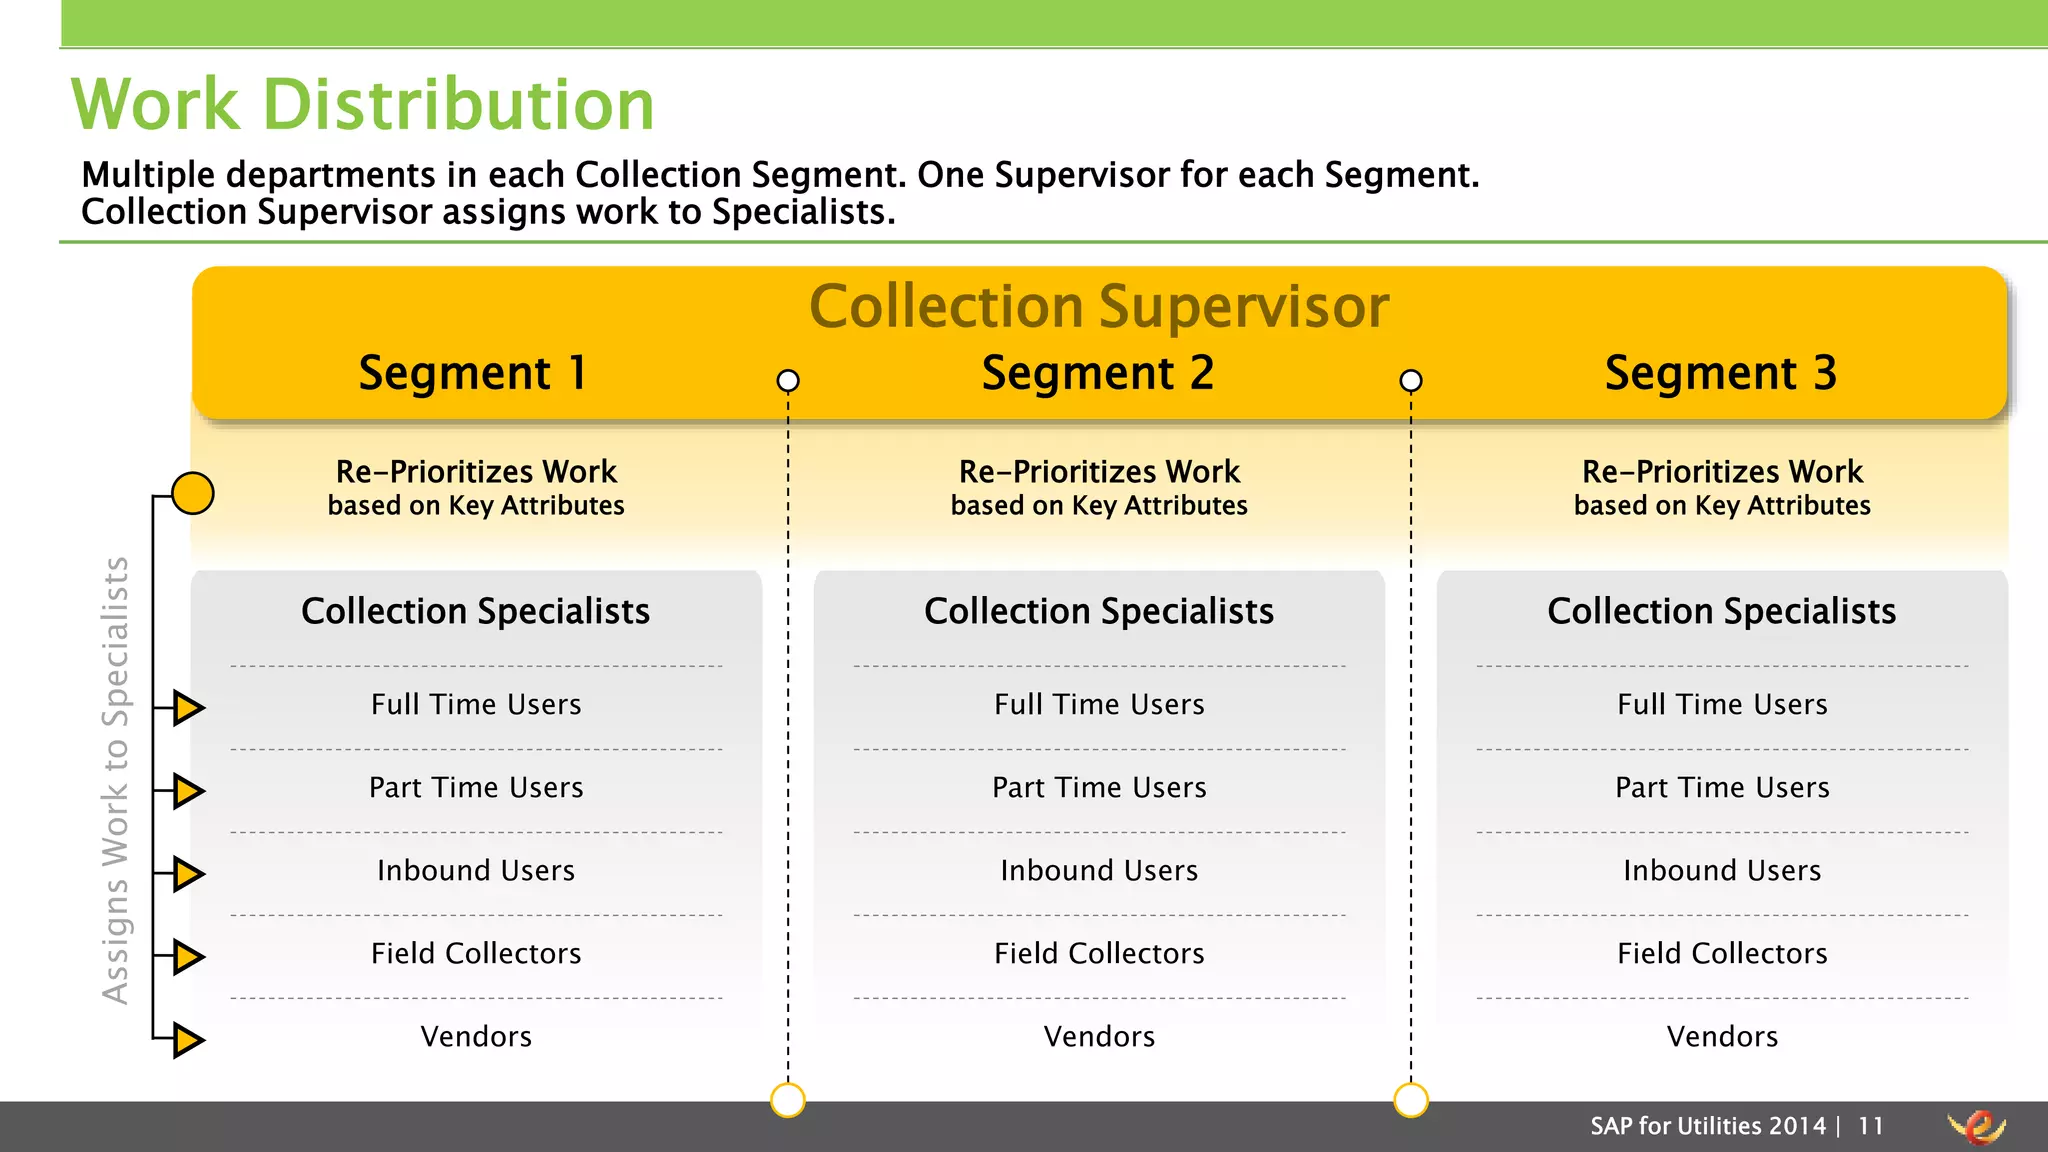
Detailed roles of Collection Supervisors and Specialists in managing and prioritizing accounts for effective collections.
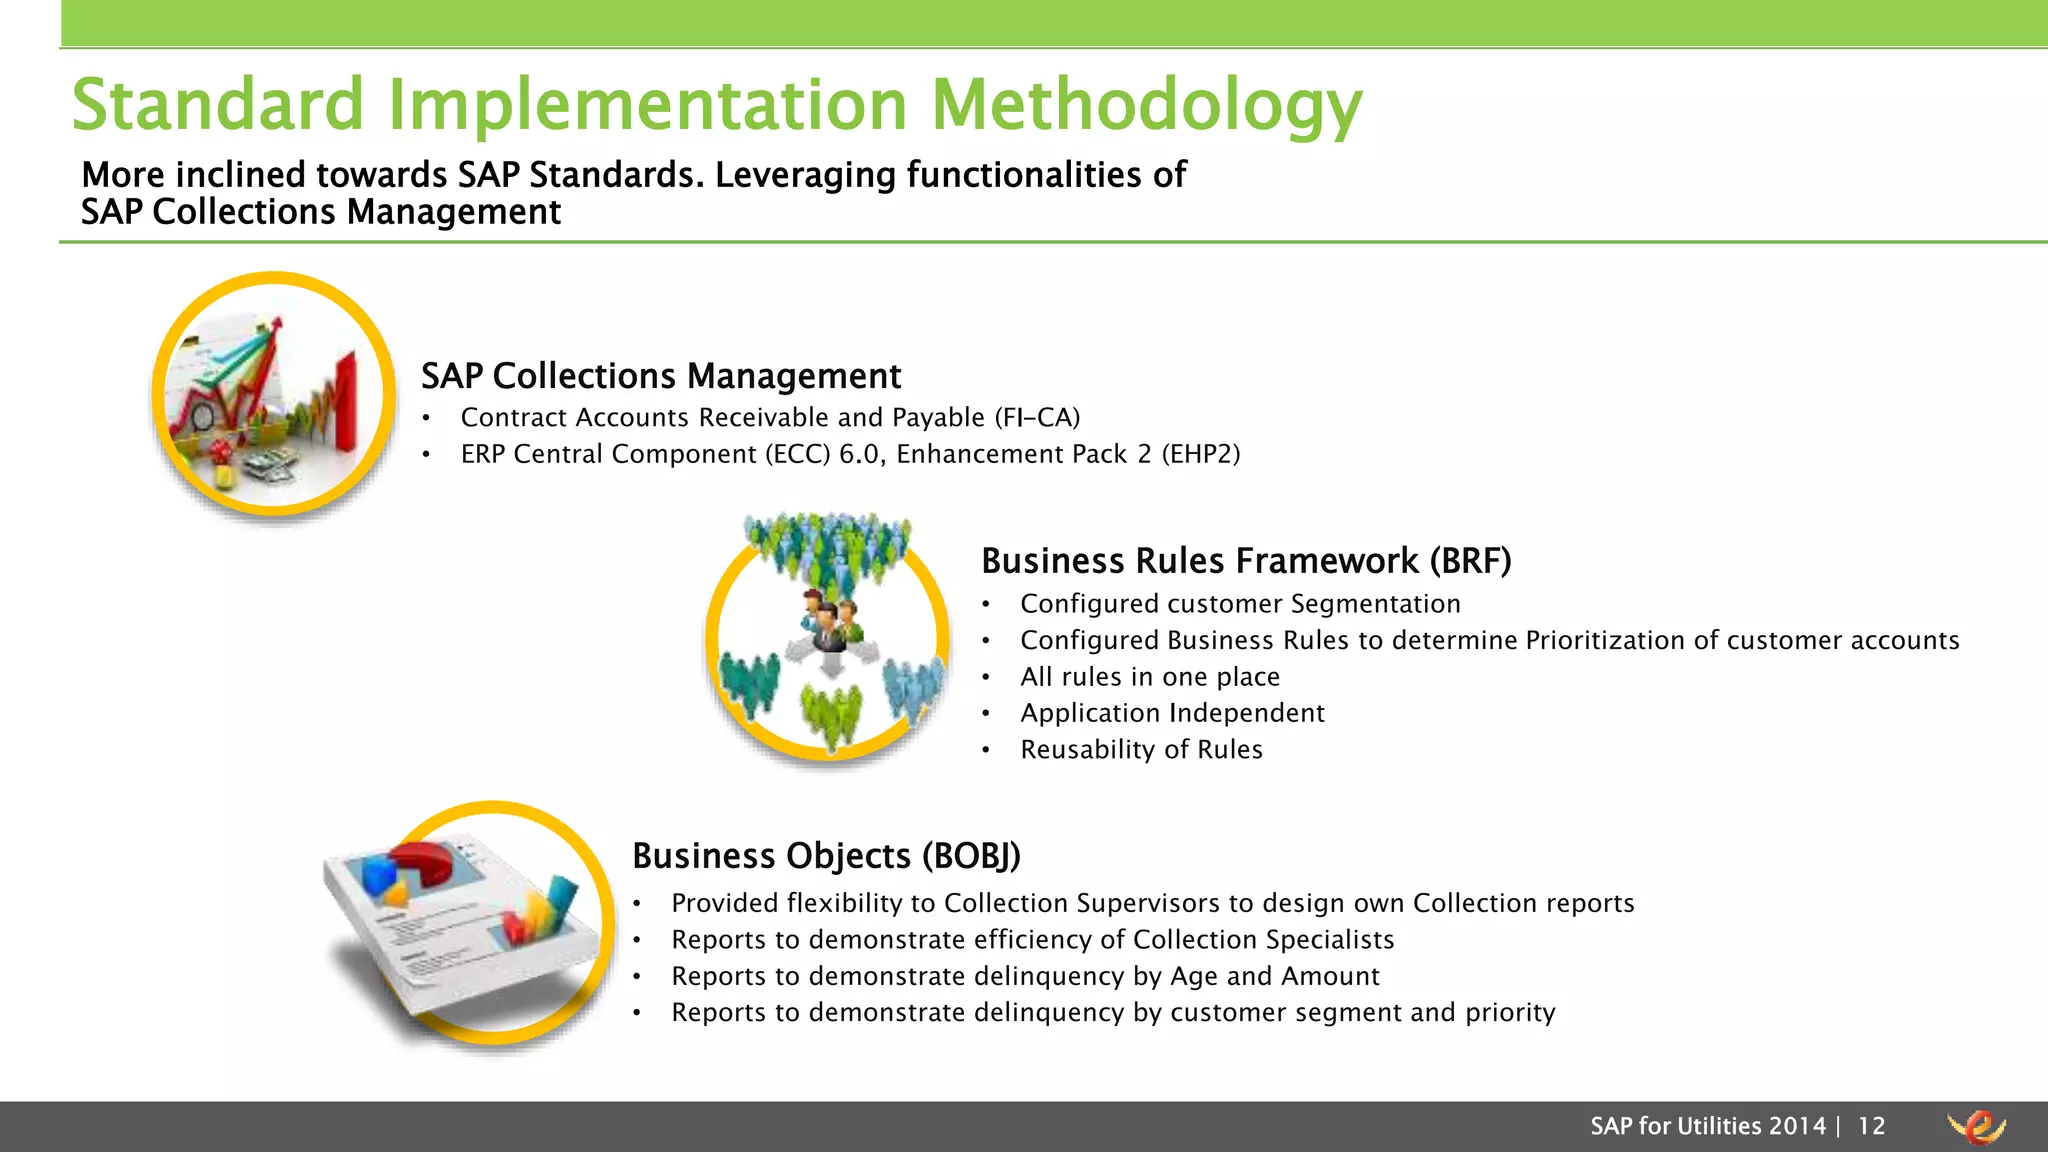
Introduction of SAP Collections Management to streamline and automate debt collection processes through effective reporting.
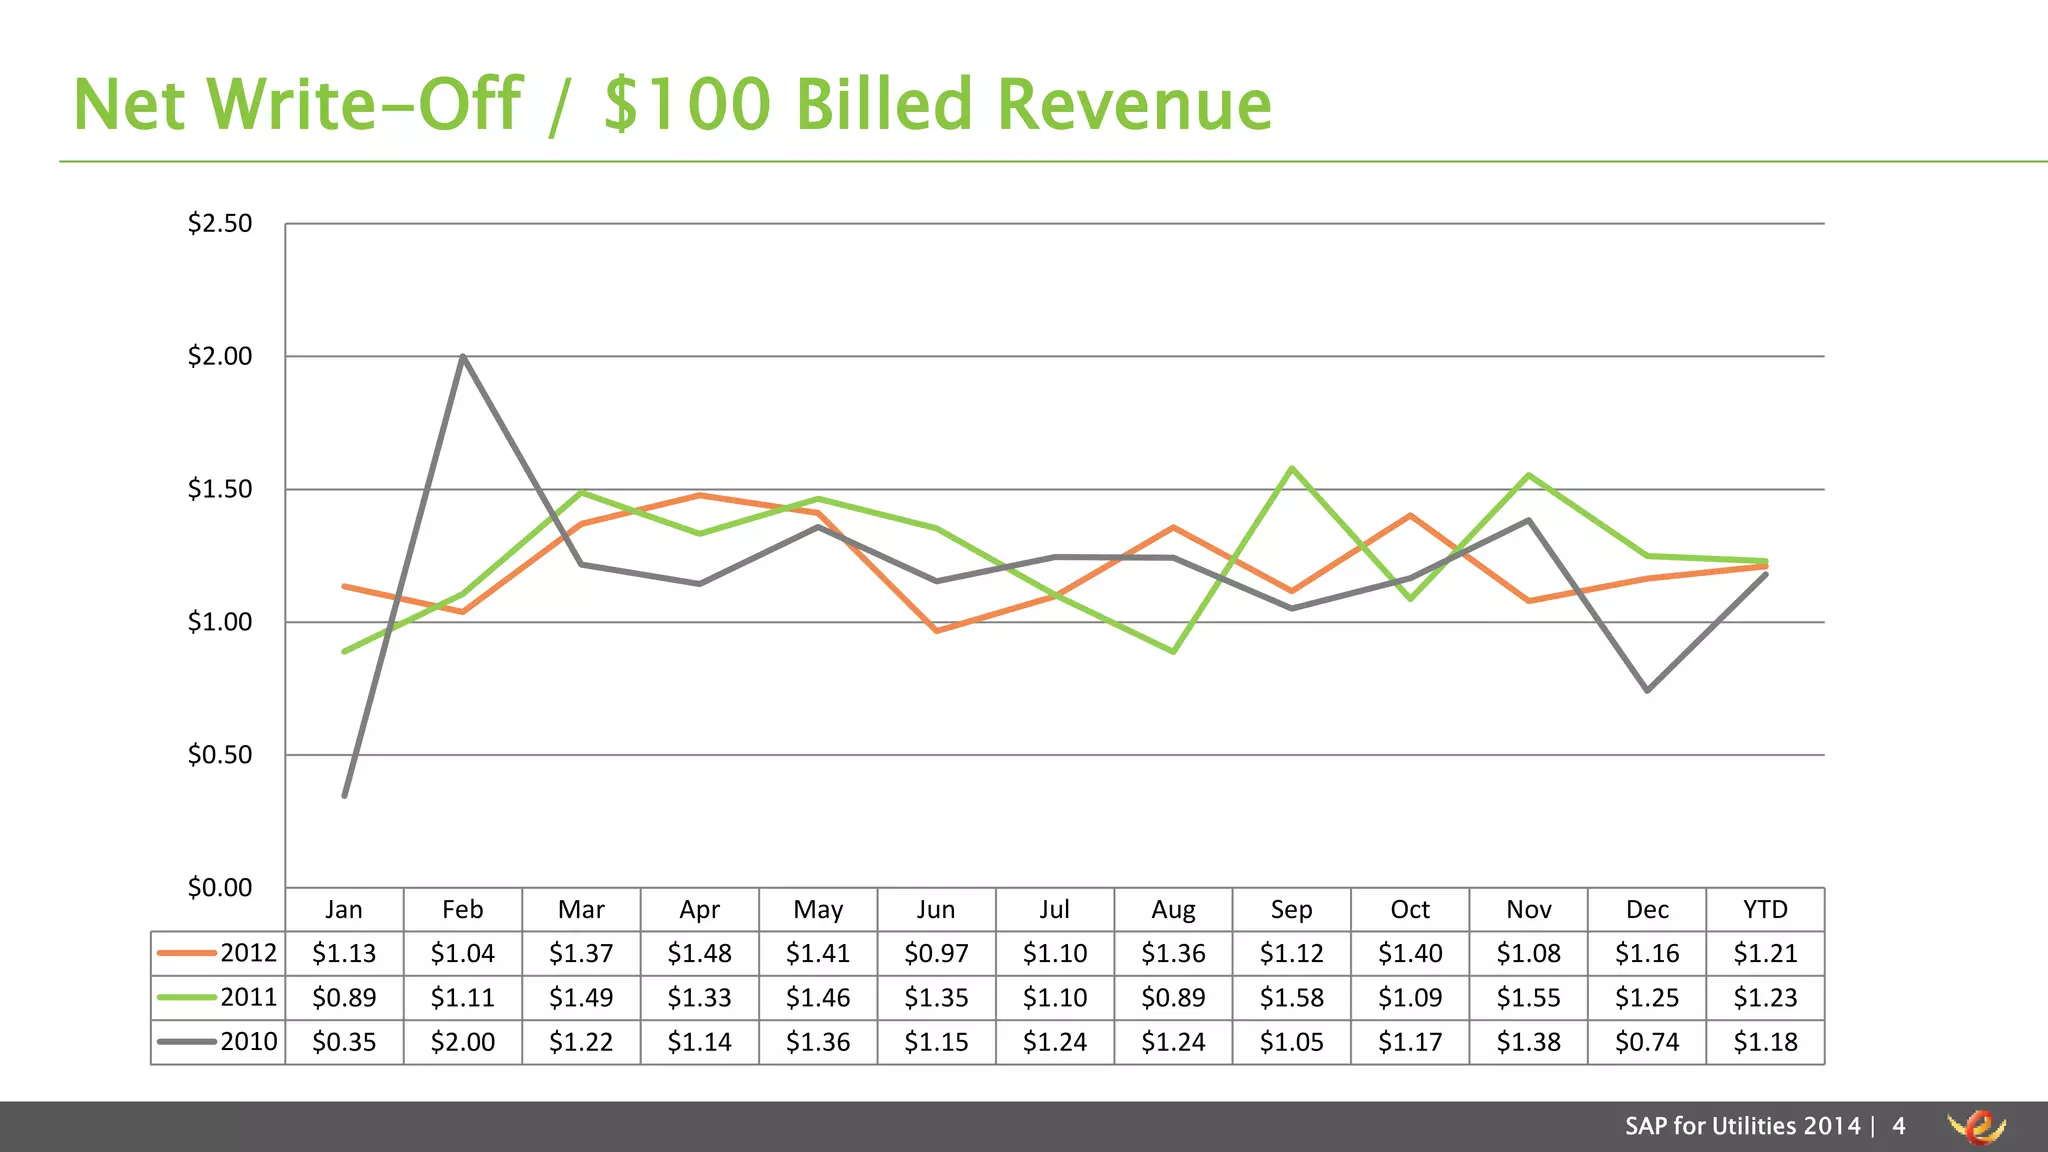
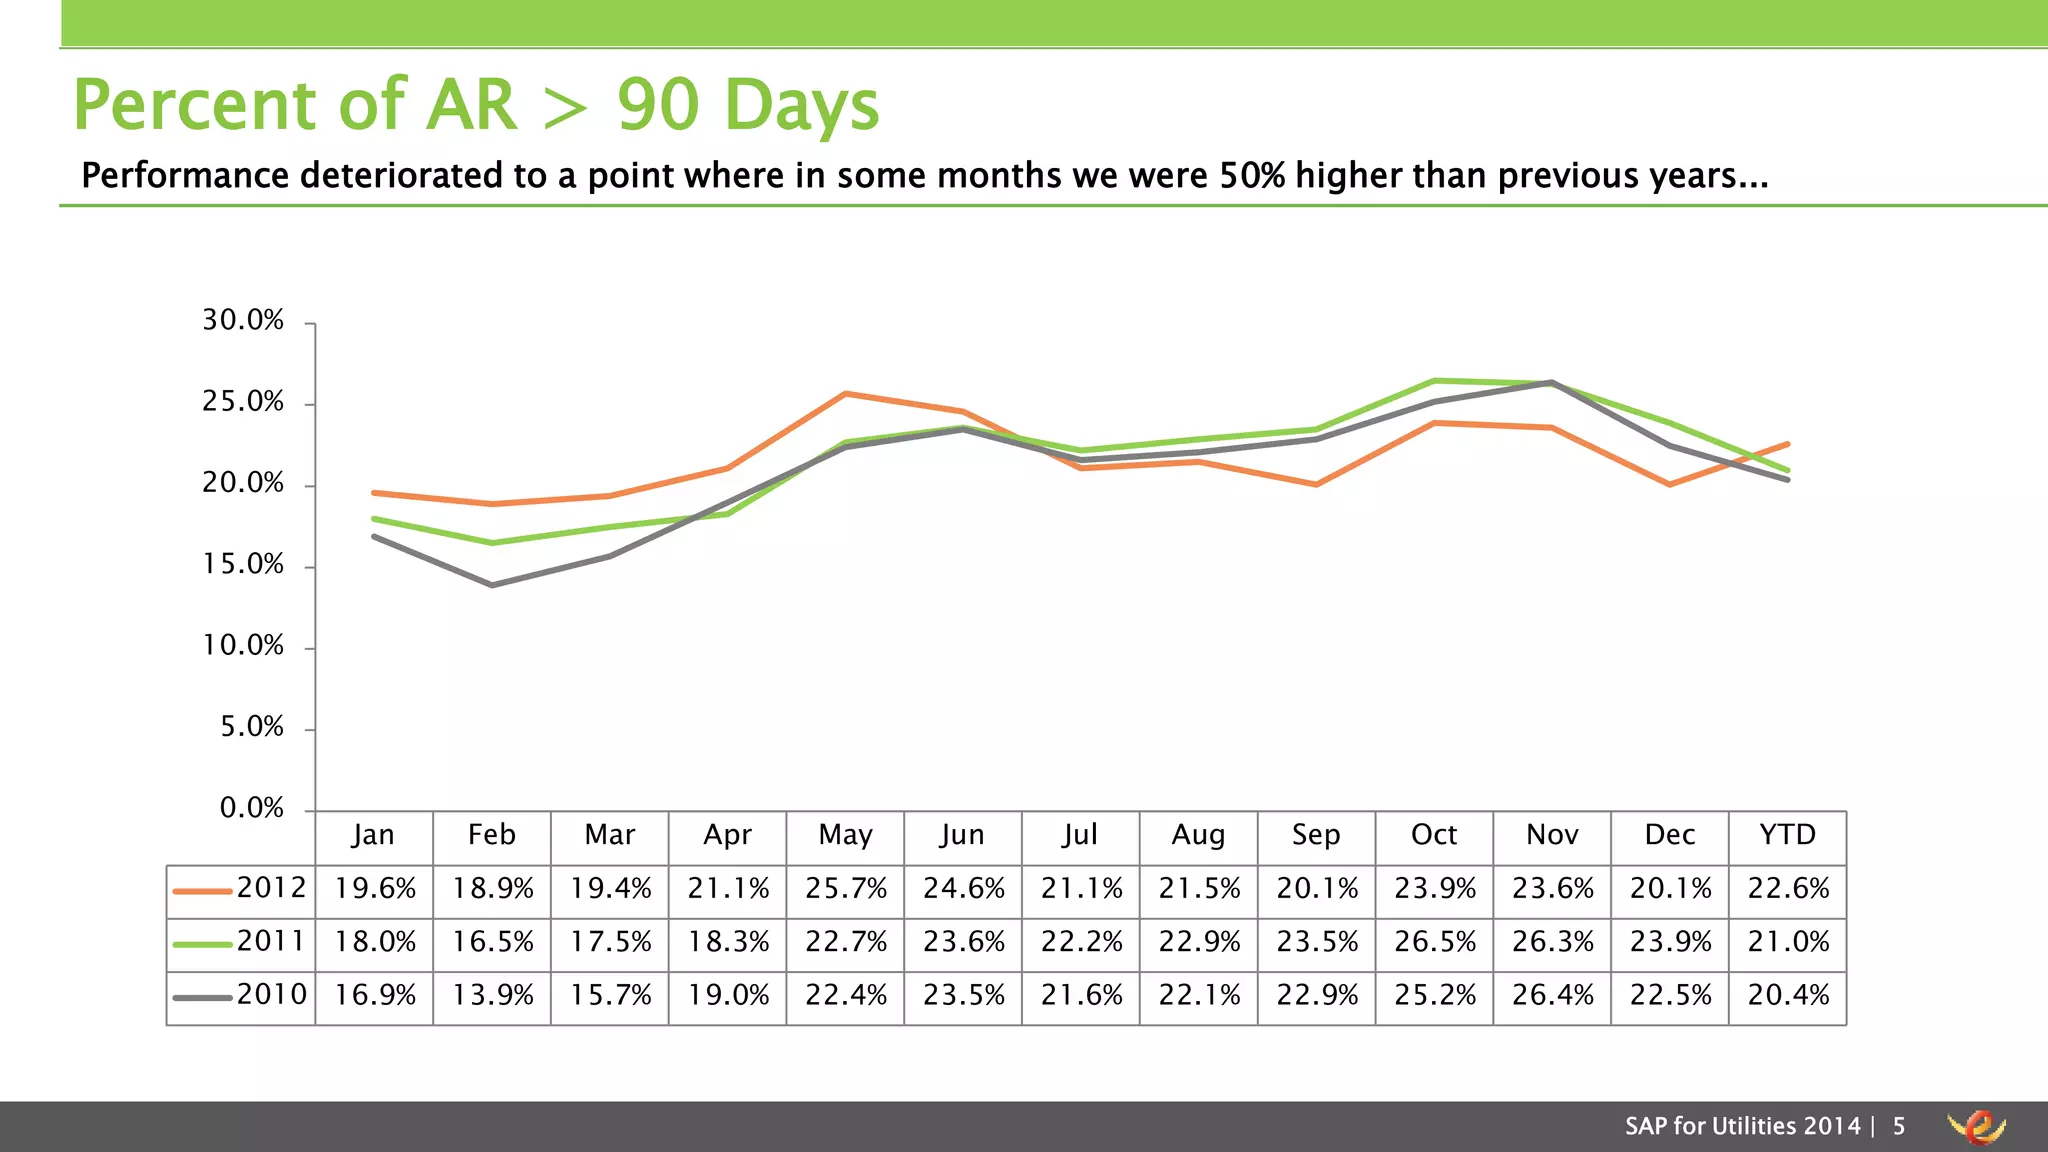
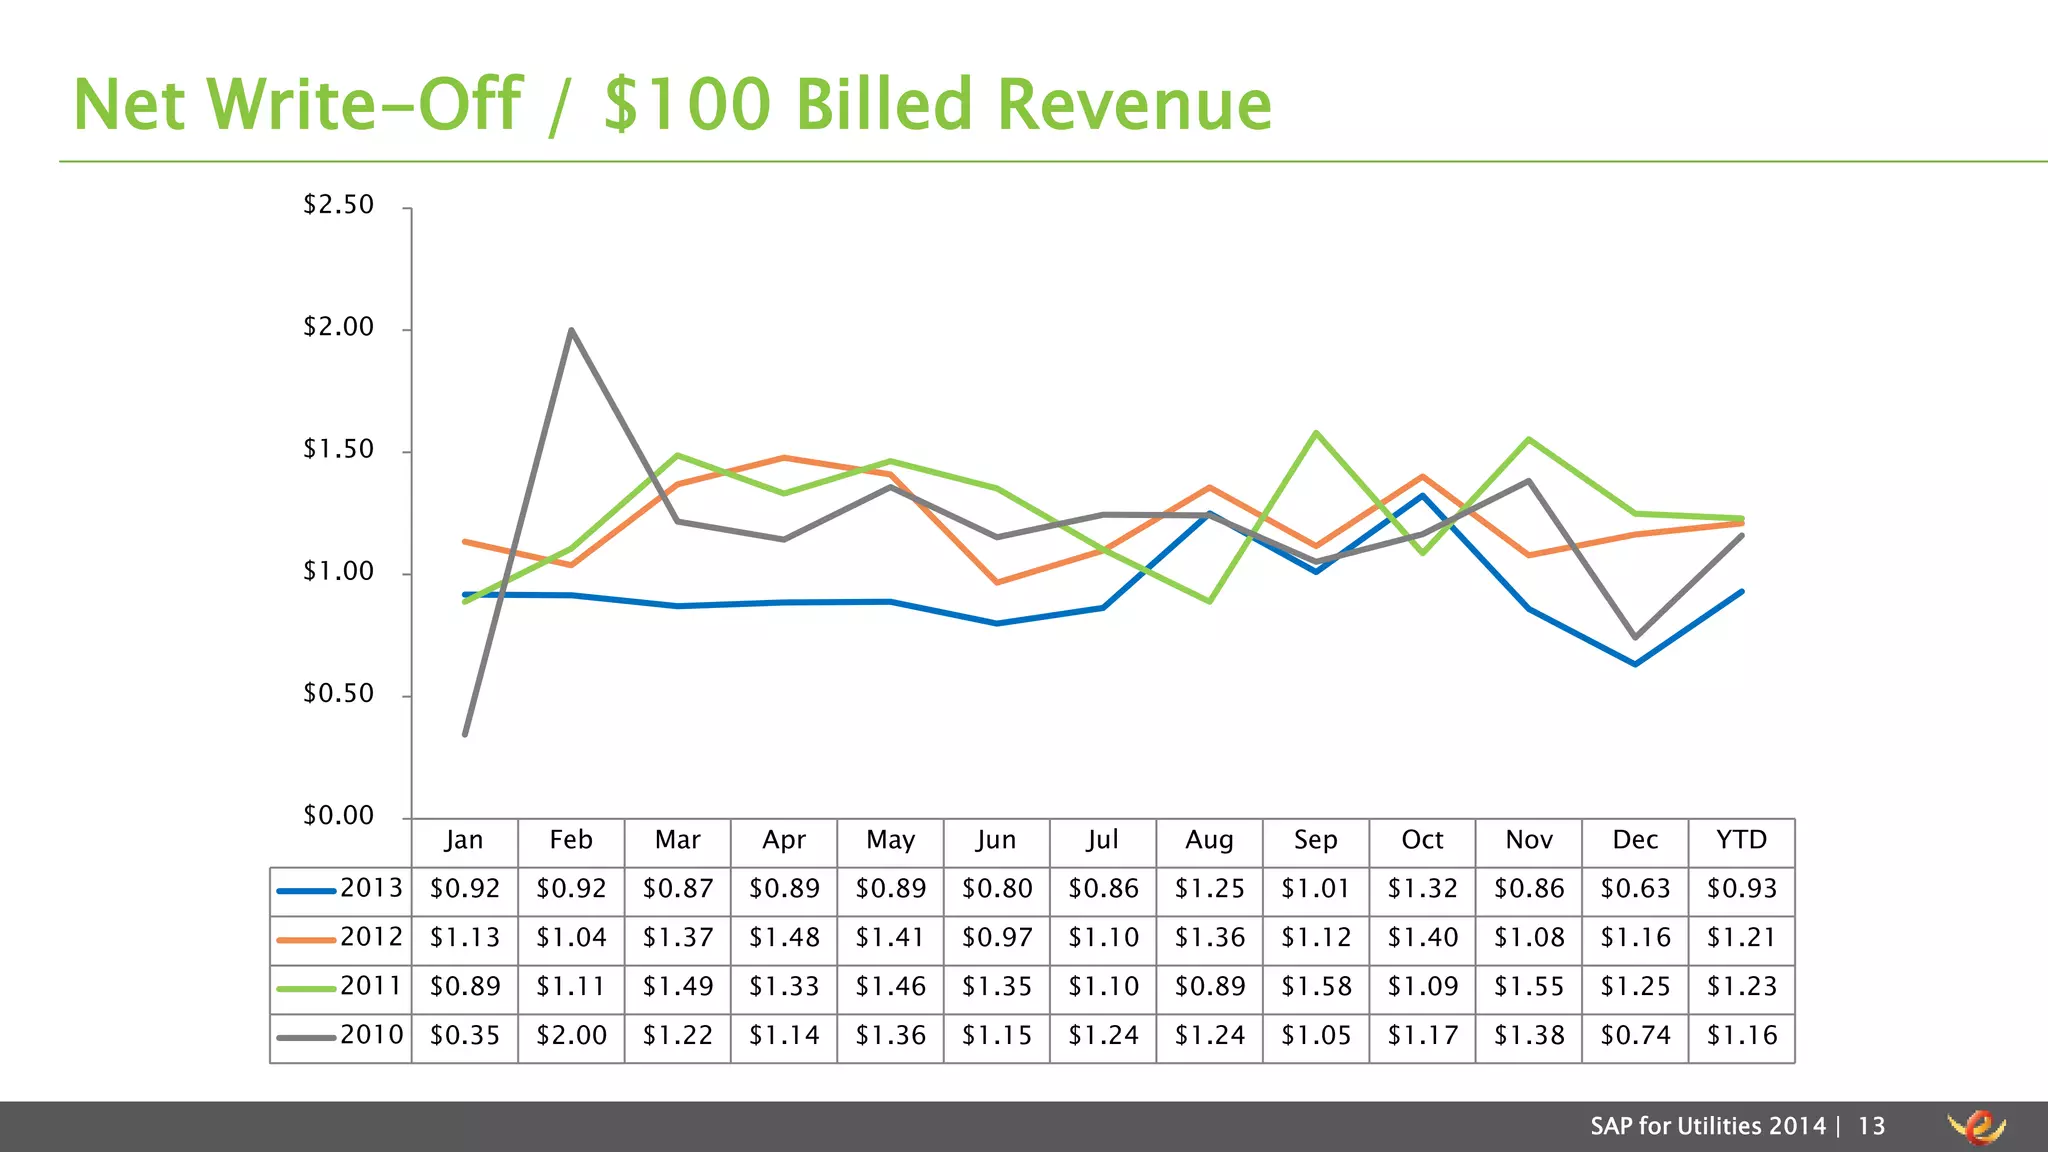
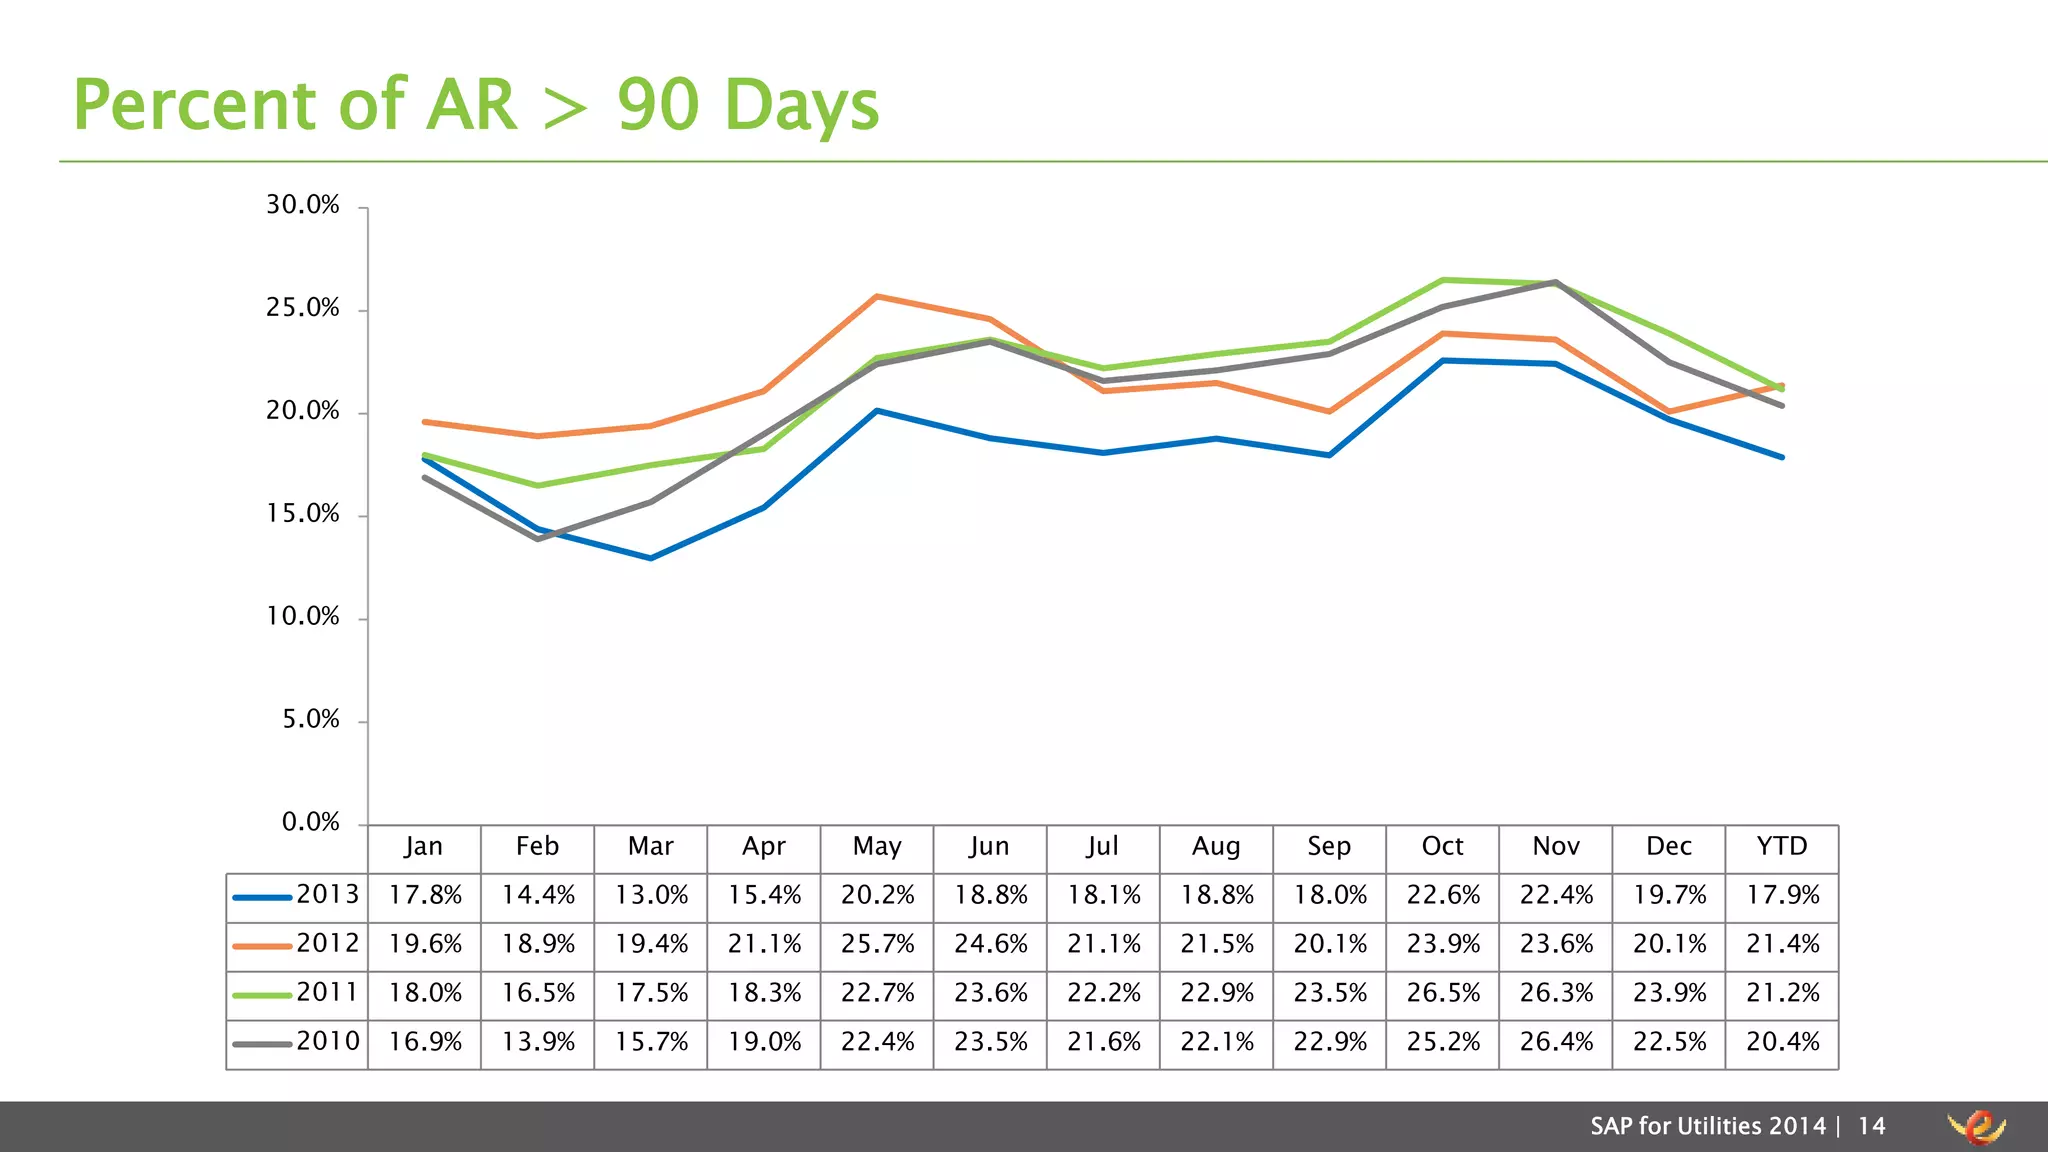
Tracking net write-offs and percentages of accounts receivable over 90 days to gauge financial improvements post-implementation.
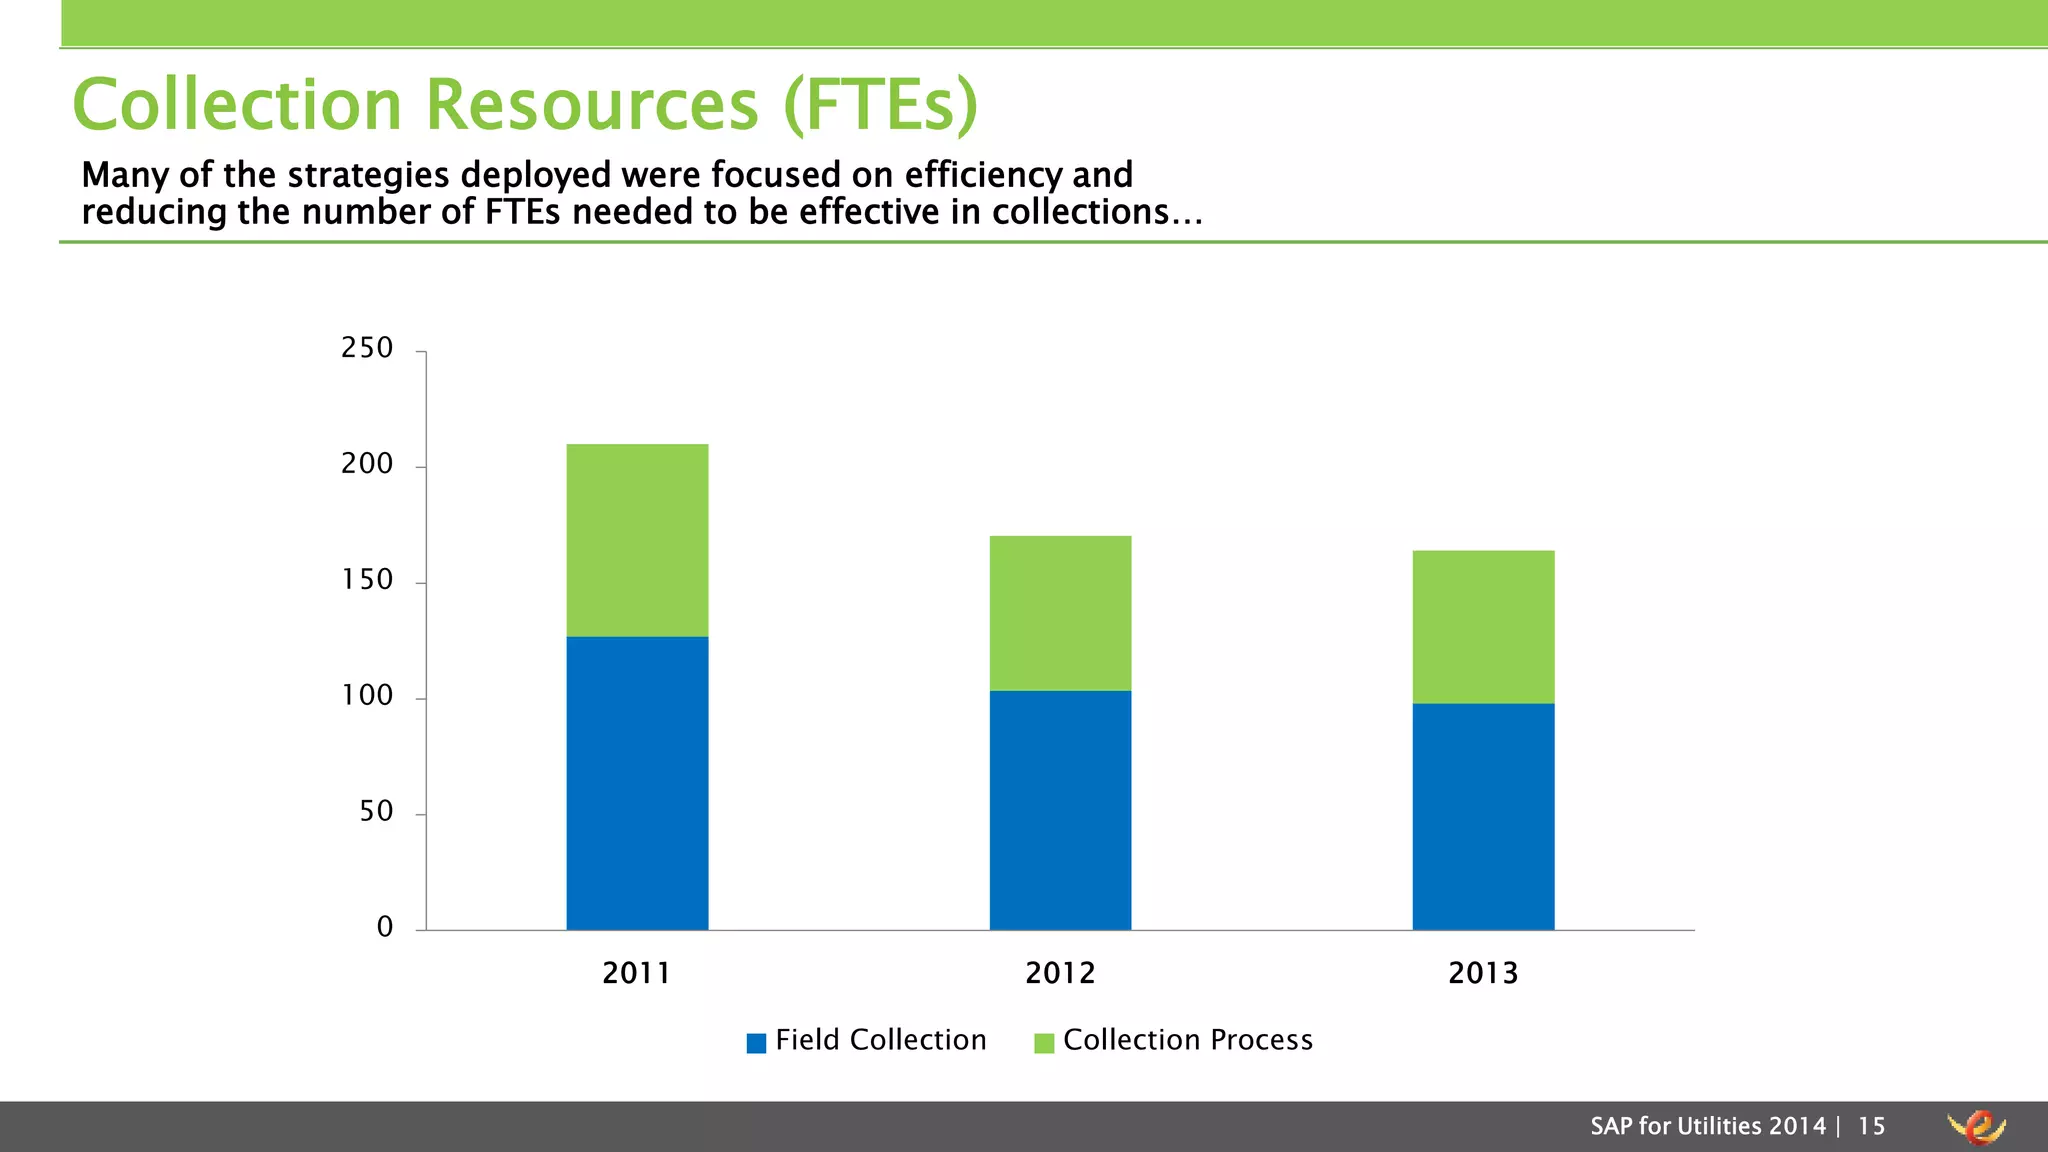
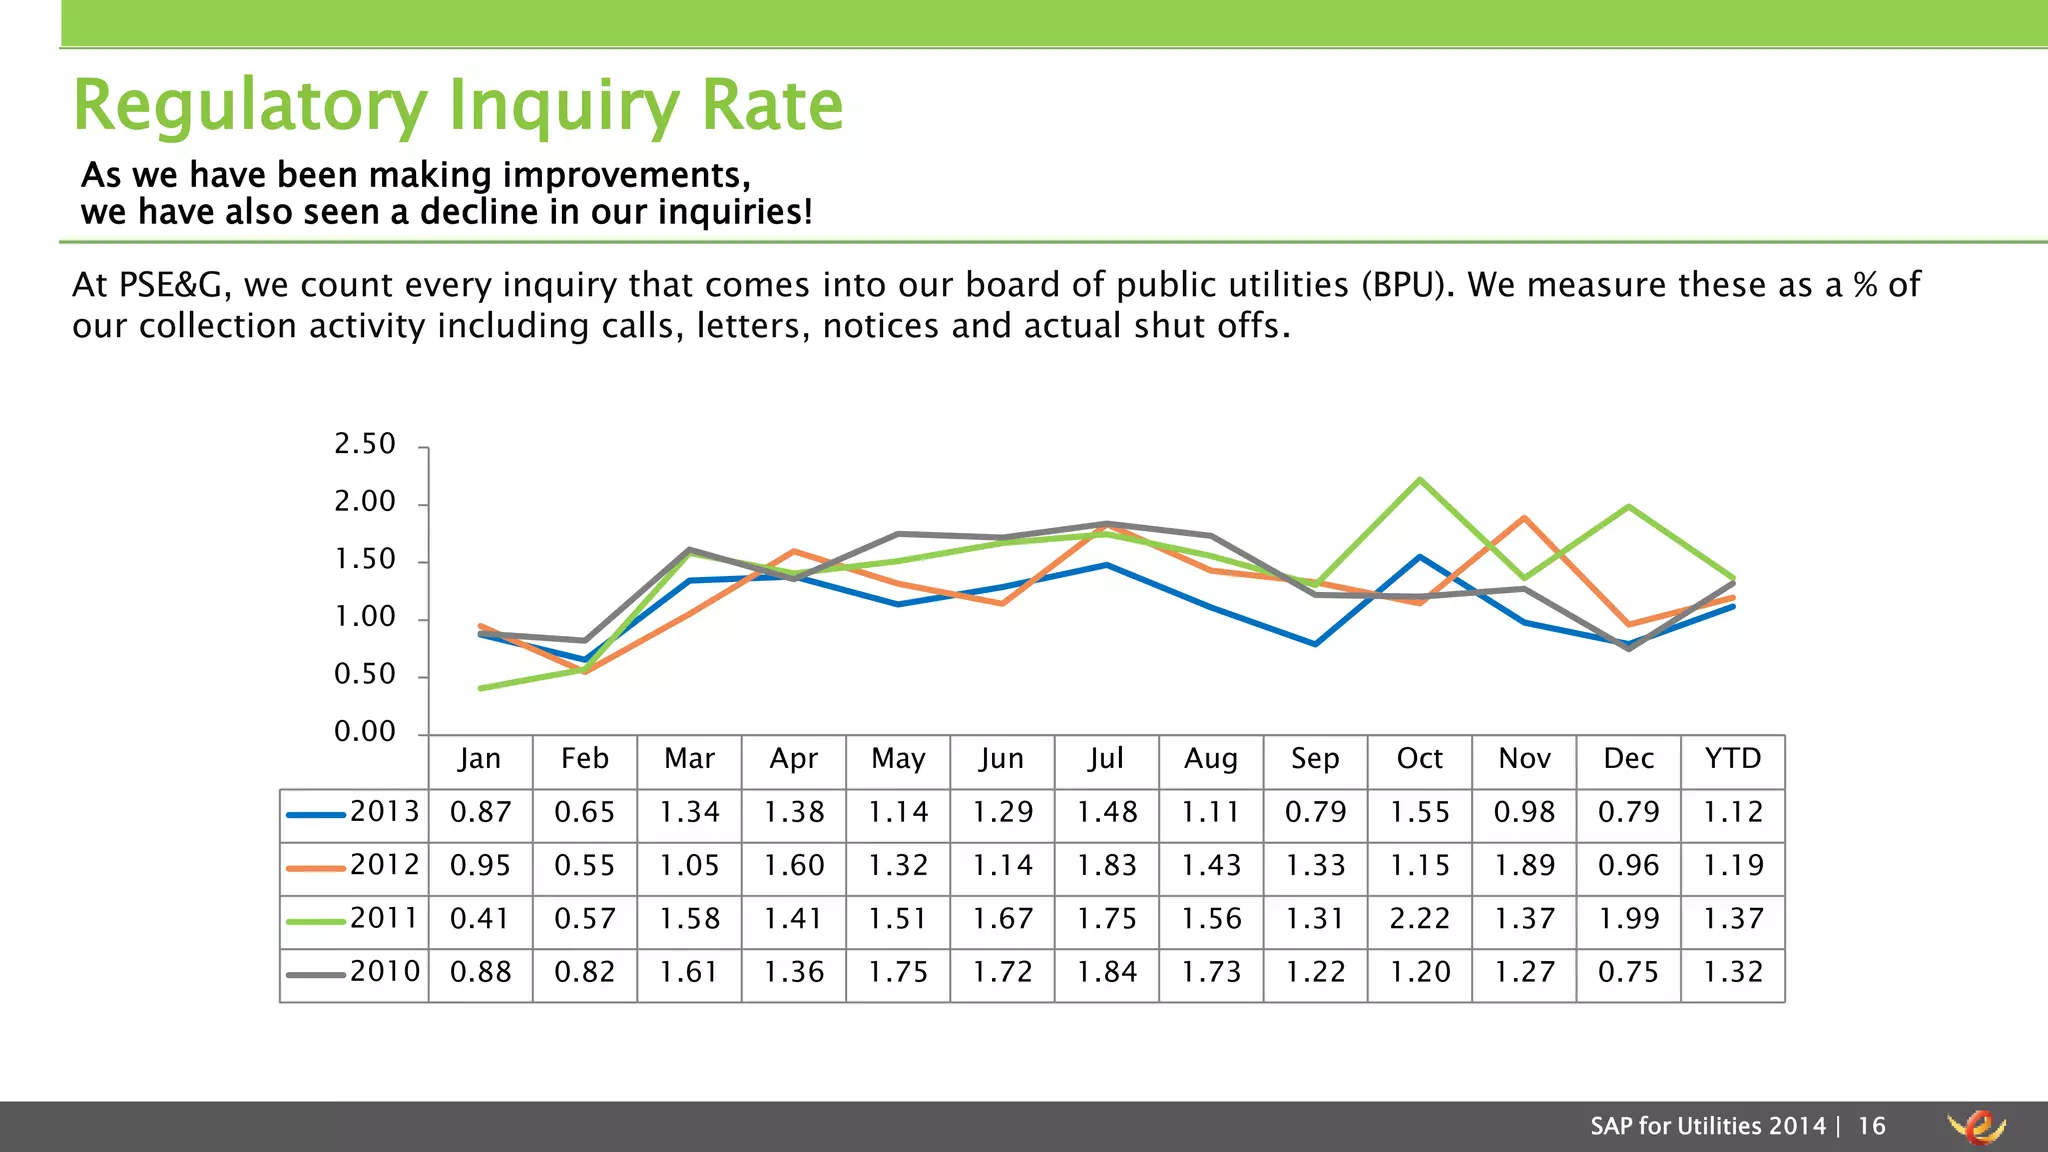
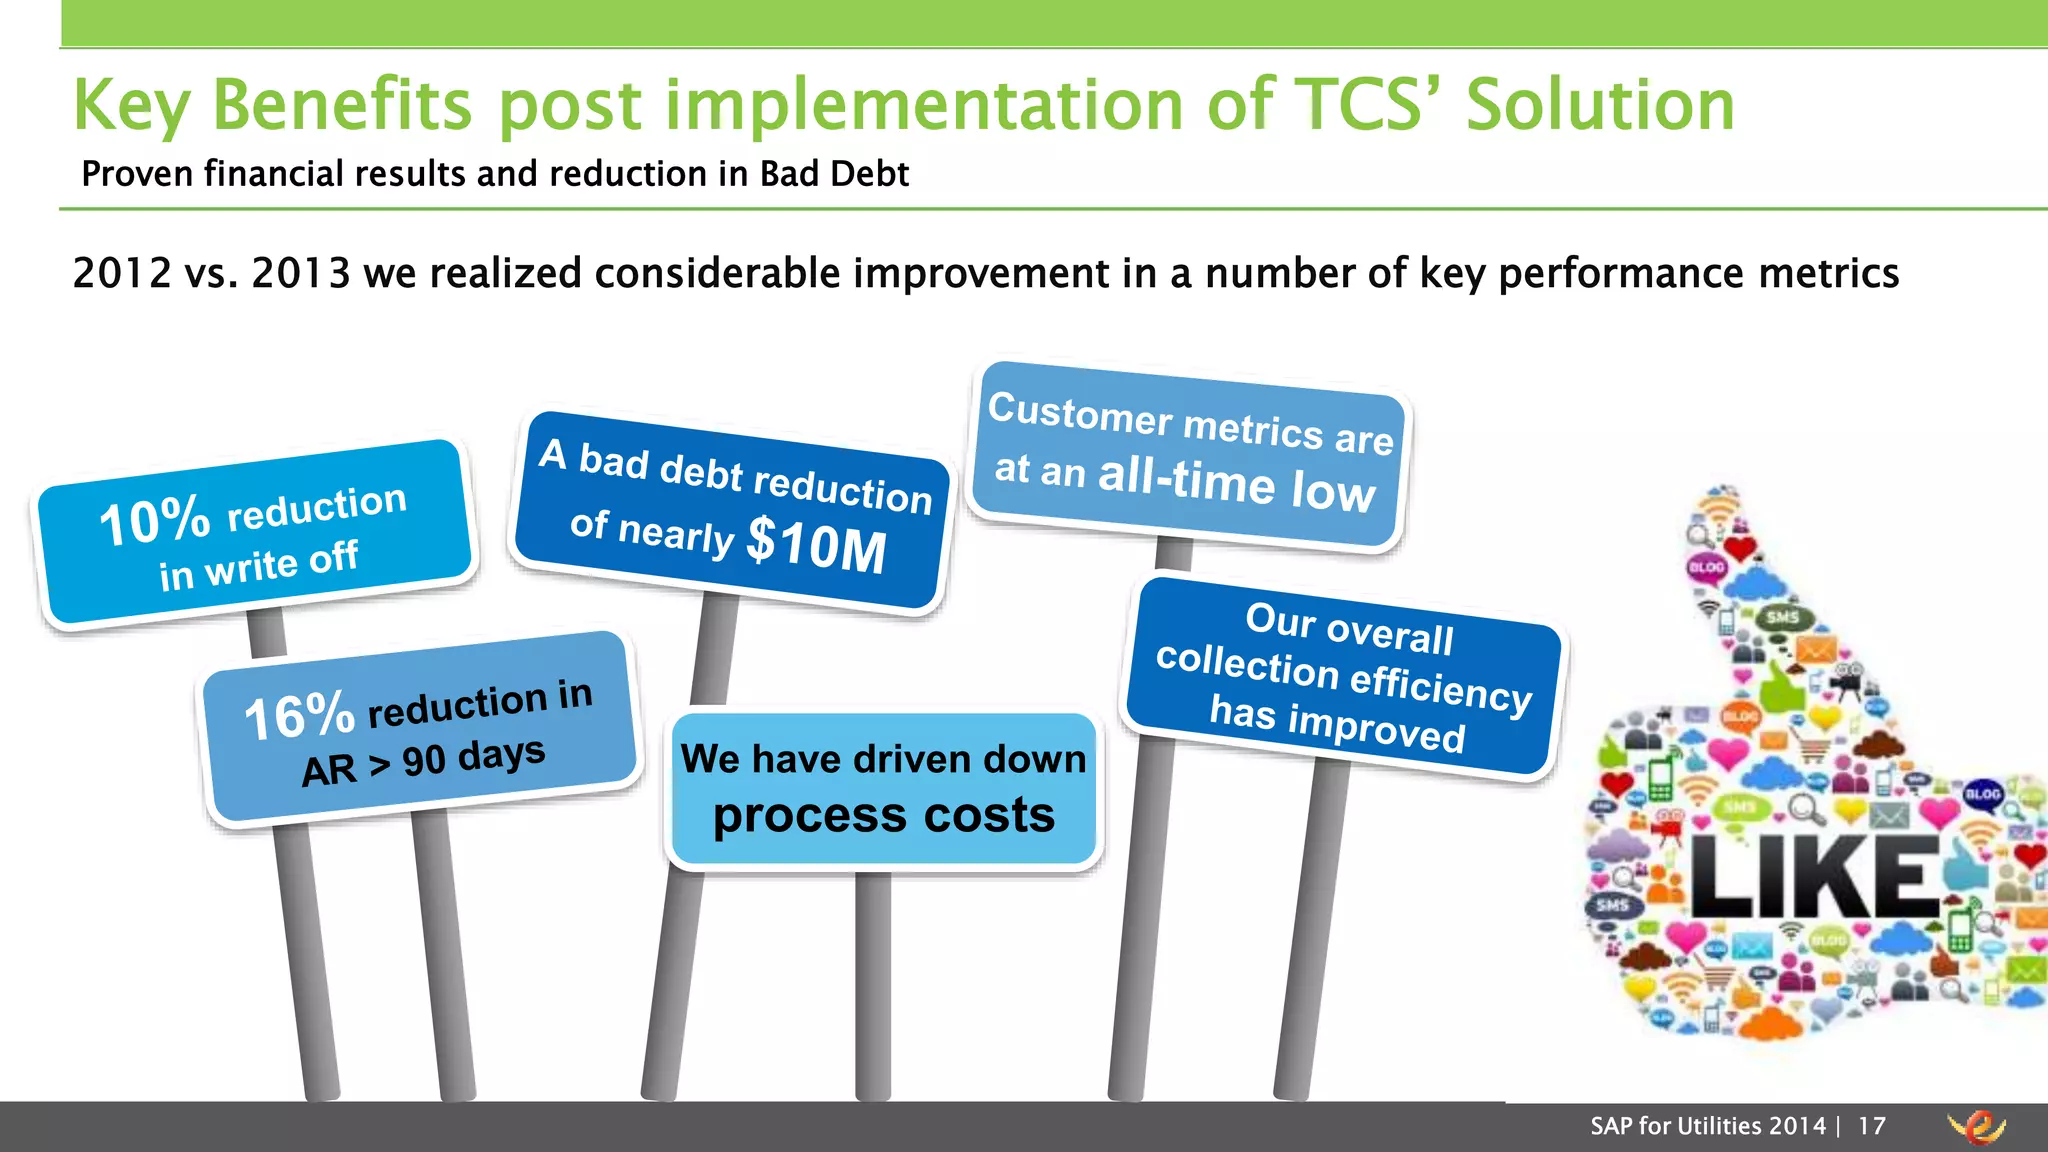
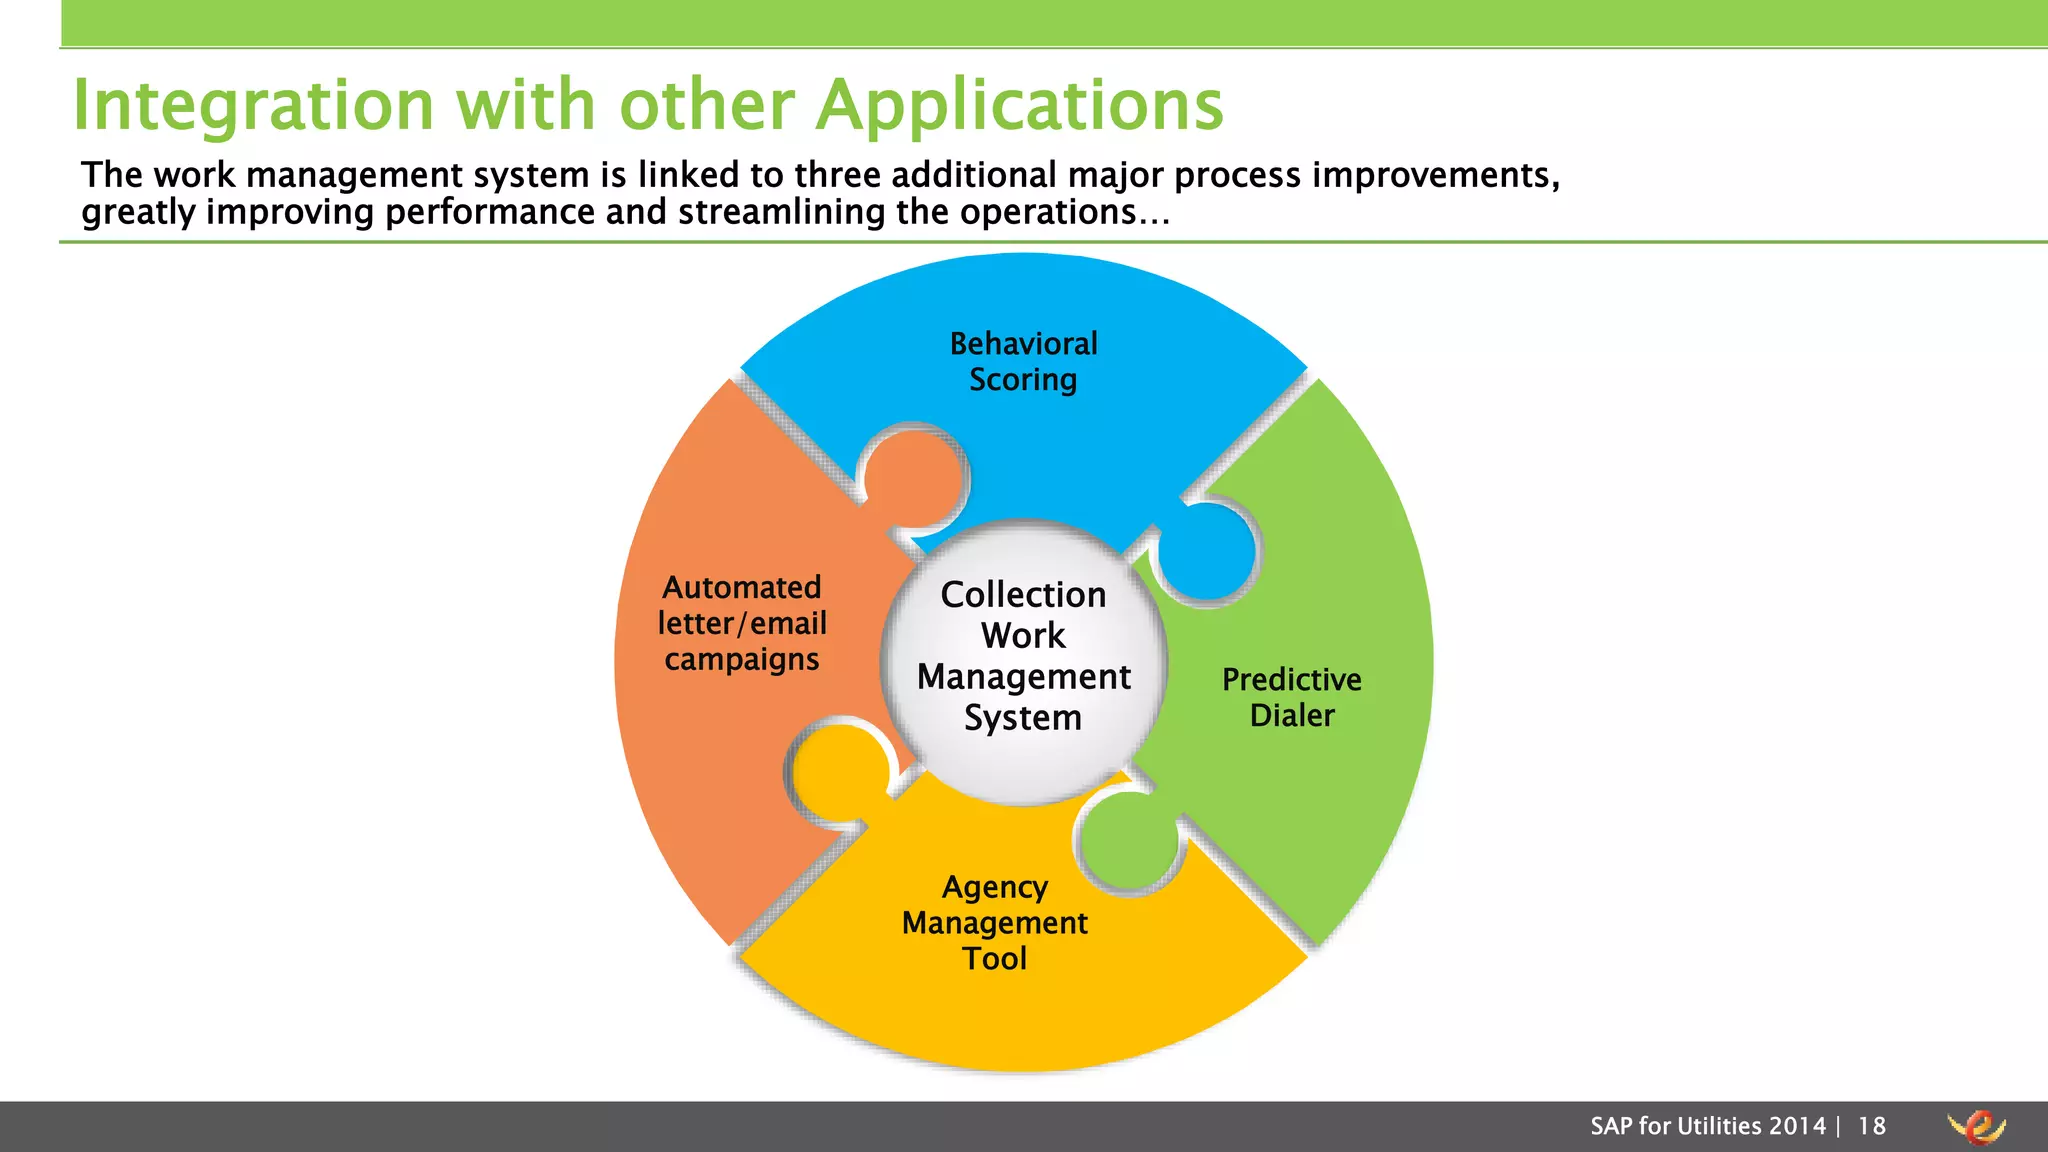
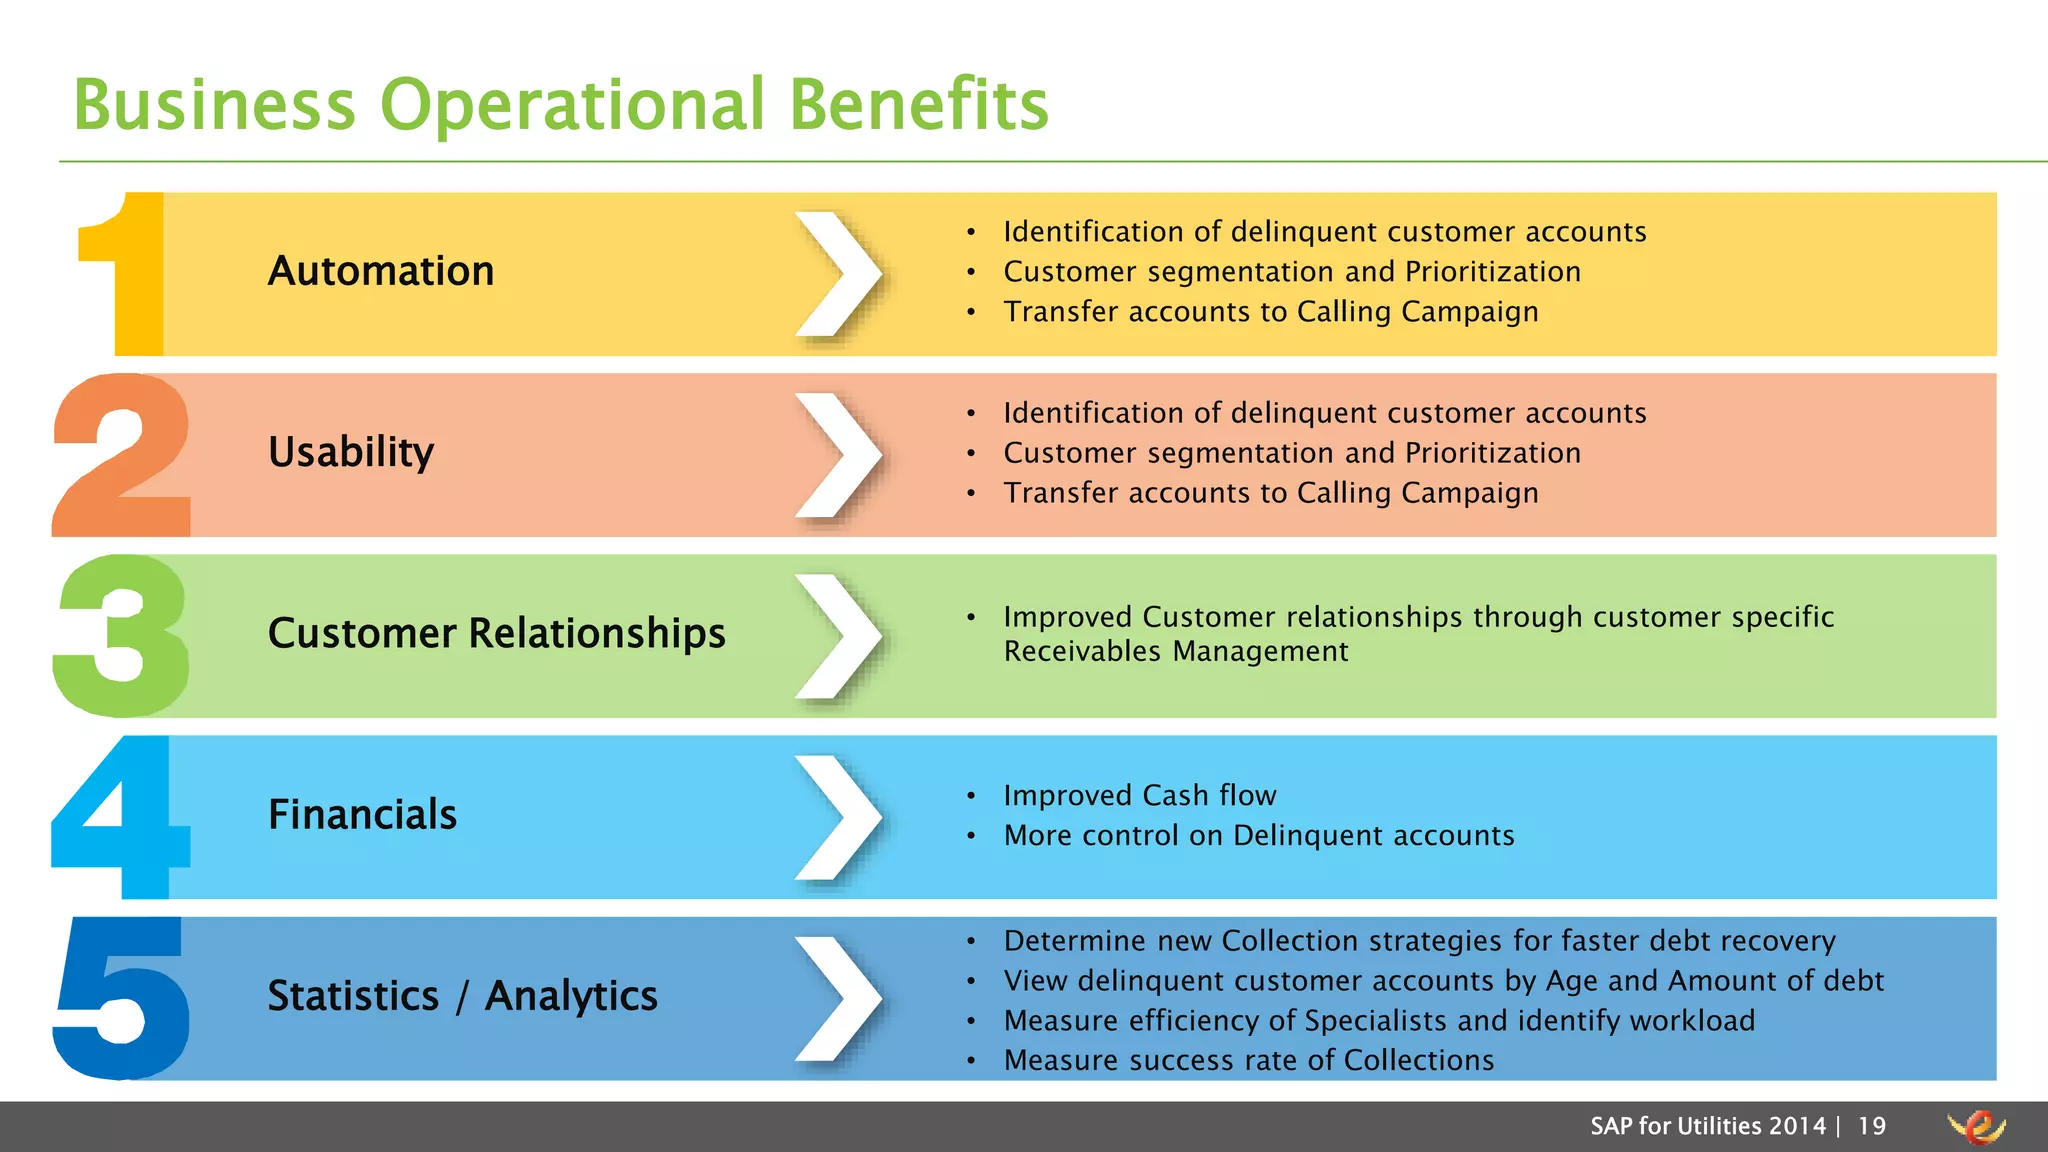
Improvements noted in regulatory inquiries and the key business benefits achieved through the new automated strategies that enhance operational efficiency.
Final slide providing contact details for further inquiries regarding PSEG's debt collection process improvements.


