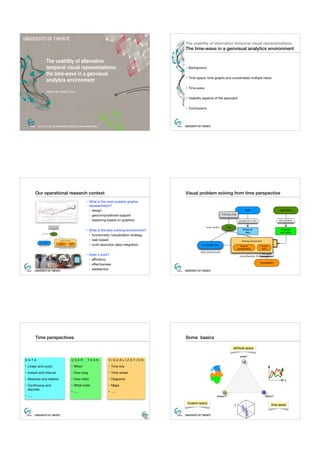
1. The usability of alternative temporal visual representations:
The time-wave in a geovisual analytics environment
The usability of alternative
temporal visual representations:
the time-wave in a geovisual
analytics environment
• Background
• Time space, time graphs and coordinated multiple views
• Time wave
Menno-Jan Kraak & Xia Li
• Usability aspects of the approach
• Conclusions
Our operational research context
Visual problem solving from time perspective
• What is the most suitable graphic
representation?
‣ design
‣ geocomputational support
‣ reasoning based on graphics
PROBLEM
user tasks
Task
Working environment
(Geospatial) Data
Graphic
representation
Function
tools
data framework
• What is the best working environment?
‣ functionality /visualization strategy
‣ web-based
‣ multi resolution data integration
Data
perspective on time
user tasks
Time perspectives
time questions
temporal
data
Task
temporal
user tasks
Working environmenttemporal
(Geospatial) Data
Graphic
representation
visualization framework
• Does it work?
‣ efficiency
‣ effectiveness
‣ satisfaction
User tasks
PROBLEM
data framework
visualization
Function
tools
time space
visualization framework
Visualization
Some basics
attribute space
DATA
USER
TASK
• Linear and cyclic
• When
• Time line
• Instant and interval
• How long
• Time wheel
• Absolute and relative
• How often
• Diagrams
• Continuous and
discrete
• What order
• Maps
• .....
what?
VISUALIZATION
• .....
t
• .....
when?
where?
location space
t
time space
2. Spaces and graphics
Time graphs: visualizations in time space
• ‘visual inference’ in time space that results in action in location and/or
attribute space
• time line / time wheel
Location space
Attribute space
MAP
DIAGRAM
• time wave
time wheel
offset (start cyclic)
wavelength = time unit
time wave
amplitude
(radius wheel)
time line
TIME GRAPH
Time space
Time wave
At work with the time wave
TIME SPACE
year
year
how long?
?
when?
how often?
if?
beiijng
xian
shanghai
annual sighting of plant
A
what order?
year
C
B
ATTRIBUTE
July 24
July 25
July 26
ID 54419
ID 54499
July 27
July 28
temperature
magnitude earthquake
1-3
4-6
7-9
Geovisual analytics environments
Geovisual analytics environment
and visualization strategies
SPACE
3. Usability testing
Evaluation: user requirements
objective
methodology
nature of user’s temporal data
kind of questions asked
• User requirements
questionnaire
• Time wave versus time line (linear) and time wheel (cyclic)
results
samples
• ‘Performance’ of time wave
linear
cyclic
2005
both
relative
absolute
monday
three
9 - 11
2006
tuesday
hours
am
....
....
....
25%
• Time wave, coordinated multiple view environment, and geovisual
analytics
48%
38%
27%
from
linear
cyclic
both
Evaluation: time graphs
19%
43%
relative
absolute
both
Evaluation: time wave
objective
objective
methodology
compare time wave with time
line and time wheel
observe execution task,
interview
results
sample
correctness
samples
100,0
Did it rain on the 2nd Feb 2001 in Haikou?
50,0
right
wrong
cannot
How often did it rain in 2nd wk of Feb ‘01 in Xi’an?
eye movement,
think aloud
results
How often times does event A
happened in the third week of January
75,0
Did it rain on the second Tuesday in Feb in Haikou?
methodology
‘performance’ of the time wave
25,0
0
time line time wheel time wave
response time
160,0
120,0
80,0
!
40,0
!
!
0
!
time line time wheel time wave
Evaluation: time wave in its environment
objective
Time wave and Space-Time-Cube
methodology
what is the user behaviour in
the coordinated multiple view
environment
eye movement
think aloud
samples
results
what > where questions
when > what questions
where > when questions
...
!
!
4. Conclusions
References
•
• Time space helps to organize a user’s temporal questions
• The time wave is, depending on the nature of the temporal questions a
good alternative for the traditional time graphs like the line and wheel
• Basics of time-wave:
Li, X. and M. J. Kraak (2008). "The Time Wave - A new method to visually explore geo-data in time space."
The Cartographic Journal 45(3).
• Integration of the findings in current theory are being elaborated
Li, X. and M. J. Kraak (publication in preparation).