Examining Faculty Motivation to Participate in Faculty Development
•
1 like•714 views

In response to demands for public accountability and improved teaching and learning, institutions are recognizing the need to strengthen their faculty development programs. Central to strengthening faculty development programs is increasing faculty participation in these programs. This mixed-method study examined the motivation of full and part-time faculty to seek development, obstacles to attending, as well as preferred formats across four institutions.

Recommended
Recommended
More Related Content
What's hot
What's hot (20)
Viewers also liked
Similar to Examining Faculty Motivation to Participate in Faculty Development
Similar to Examining Faculty Motivation to Participate in Faculty Development (20)
More from Patrick Lowenthal
More from Patrick Lowenthal (20)
Recently uploaded
Recently uploaded (20)
Examining Faculty Motivation to Participate in Faculty Development
- 1. Running head: EXAMINING FACULTY MOTIVATION 1 Preprint: To appear in an upcoming issue of International Journal of University Teaching and Faculty Development Lowenthal, P. R., Wray, M. L., Bates, B., Switzer, T., & Stevens, E. (in press). Examining faculty motivation to participate in faculty development. International Journal of University Teaching and Faculty Development Examining Faculty Motivation to Participate in Faculty Development Patrick R. Lowenthal Boise State University patricklowenthal@boisestate.edu Michael L. Wray Metropolitan State University of Denver wraym@msudenver.edu Barbara Bates DeVry University bbates@devry.edu Teri Switzer University of Colorado at Colorado Springs tswitzer@uccs.edu Ellen Stevens University of Colorado Denver ellen.stevens@ucdenver.edu
- 2. Running head: EXAMINING FACULTY MOTIVATION 2 Abstract In response to demands for public accountability and improved teaching and learning, institutions are recognizing the need to strengthen their faculty development programs. Central to strengthening faculty development programs is increasing faculty participation in these programs. This mixed-method study examined the motivation of full and part-time faculty to seek development, obstacles to attending, as well as preferred formats across four institutions. Results indicate that full-time faculty seek more development than part-time faculty across institutions. At some institutions, the preferred format of faculty development contributed to differences among the types of faculty. Despite efforts to offer short workshops and faculty development online, in this study full time faculty tended not to value short workshops or online activities and instead preferred such things as books, videos, or even attending retreats. The results of this study suggest that faculty developers should begin thinking differently about the types and the frequency of faculty development. Keywords: faculty development, professional development, post-secondary teaching & learning
- 3. Running head: EXAMINING FACULTY MOTIVATION 3 Introduction Institutions of higher education are placing a greater emphasis on quality teaching and student learning than ever before (AAC&U, 2002; Chism, 2008; Lieberman, 2005; Lowenthal, 2008). Faculty now find themselves in a world where they are expected to be expert researchers as well as expert teachers (Boyer, 1990; Chism, 2008). However, very few faculty receive any type of teacher training prior to entering the academy (Boyer, 1990; Stevens, 1998). Even though faculty are prepared as scholars, not teachers (AAC&U, 2002), it has been assumed that a terminal degree is a license to teach (Stevens, 1988). This mismatch between the lack of teaching preparation and the day-to-day expectations to be an exceptional teacher puts faculty and administrators at odds with each other. Institutions of higher education, however, have begun to turn to faculty development as a possible way to improve teaching and learning (Kolbo & Turnage, 2002). Unfortunately, though, faculty participation in faculty development is inconsistent (Gardiner, 2005). Thus, the purpose of this study was to explore faculty’s motivation to participate in faculty development—specifically, by looking at faculty preferred formats, incentives, and distracters to participate in faculty development. Background Faculty development research suggests that development efforts are needed and can improve teaching and learning in multiple ways at the college level (Fletcher & Patrick, 1998; Sorcinelli, 2006; Wright, 1998). In addition, faculty development has the ability to not only enhance teaching skill, but also reduce faculty burnout (Huston & Weaver, 2007; Mintz, 1999; Roche, 2001), improve the recruitment of women and minorities in unrepresented programs (Laursen & Rocque, 2009), and enhance collaborative learning amongst faculty (Cole, Barker, Kolodner, Williamson, Wright, & Kern, 2004; Hill, Soo La, & Lagueux, 2007; Knight, Carrese, & Wright, 2007).
- 4. Running head: EXAMINING FACULTY MOTIVATION 4 Despite some of the aforementioned possible benefits of participating in faculty development, most faculty think they excel in the classroom and, therefore, do not need to participate in face-to-face development workshops (Chism & Szabo, 1996; Maxwell & Kazlauskas, 1987; Murray, 2000; Travis, Hursh, Lankewicz, & Tang, 1995). For instance, fifty percent of faculty believe they are in the top 10% of teachers; ninety percent believe they are in the top half of teachers (Blackburn, 1995). Administrators struggle with finding ways to attract faculty to faculty development activities as well as identifying the right mix of faculty development services to improve faculty teaching and ultimately student learning (Menges, 1997). Face-to-face workshops are efficient both in terms of time and resources, but are not necessarily the most effective way to help faculty improve teaching quality (Holmgren, 2005; Menges, 1980; Schroeder, 2005). While faculty developers have begun offering faculty development workshops online to address some possible barriers, such as time conflicts and attracting both full and part-time faculty (Lowenthal, 2008; Shea, Sherer, & Kristensen, 2002; Vrasidas & Glass, 2004; Wood et al., 1998), there has not been enough research conducted to determine whether this new approach is attracting any new faculty or improving teaching and learning. At the same time, faculty developers are trying to clarify the factors that influence faculty participation in faculty development (Holmgren, 2005). Some faculty attend faculty development activities to improve the quality of their instruction (Bess, 1982); others attend faculty development to strengthen their portfolio as they move through the tenure process (Huston & Weaver, 2007), while others have little interest in participating in faculty development if they are not coerced by department chairs (Lucas, 2002). In addition to varying incentives that provide impetus for participation in faculty development, research suggests that teaching and learning, as well as faculty development, are
- 5. Running head: EXAMINING FACULTY MOTIVATION 5 contextual (Eddy, 2007; Elen, 2007). Because faculty differ across institution type it is not enough to understand in general terms what motivates a typical faculty member. Instead, we posit that, in order to strengthen faculty development programs (which largely involves increasing faculty participation in faculty development activities), faculty developers must understand what motivates faculty from different institutional types to attend faculty development. Methods The purpose of this study was to explore what motivates faculty from different types of higher education institutions to participate in faculty development. The following research questions guided this study: 1. How do faculty differ by employment category (full time or part-time), tenure status, and institution type in their frequency of attending faculty development? 2. Are there differences among faculty employment category, institution type, or tenure status in the preference of faculty development format? 3. What are the differences among faculty employment category, institution type, or tenure status in their motivation to attend faculty development? 4. What are the differences among faculty employment category, institution type, or tenure status in their obstacles to attend faculty development? Population and Sample The higher education landscape is diverse (Blackburn & Lawrence, 1995). There are research institutions, teaching institutions, technical institutions, private institutions, religious institutions, and proprietary institutions to name a few. With each of these institution types comes a different culture and way of doing things (Blackburn & Lawrence, 1995)—including the
- 6. Running head: EXAMINING FACULTY MOTIVATION 6 role of faculty development. However, despite these differences, all institutions appear to be using part-time lecturers more than in the past (Jaschik, 2006). It is unclear, though, how the differences in institutional culture and the increase use of part-time faculty affect professional development (Christensen, 2008). With this in mind, we purposefully sampled (Miles & Huberman, 1994) both full-time (i.e., non-tenure track, tenure track, and tenured) and part-time faculty (i.e. adjuncts) from four types of higher education institutions in the Western United States. The four types of institutions sampled included the following • Research University (RU), a public research university; • City College (CC), a public four-year college; • Western Catholic University (CWU), an accelerated adult college in a private catholic university; and • Corporate University (CU), a proprietary university. See Table 1 for a brief description of each institution and Table 2 for a comparison of each institution. Table 1 Descriptions of each Institution Institution Description City College (CC) CC is a public urban commuter college that offers bachelor’s degrees in a variety of areas (e.g., business, liberal arts, and professional studies). It has a large diverse population with over 20,000 students. The average student is 28 years old. The faculty are 35% fulltime and 65% part time. Full time faculty are classified as either tenure track or tenure faculty. Full time faculty set personal goals based upon teaching, advising, professional development, and
- 7. Running head: EXAMINING FACULTY MOTIVATION 7 community service; there is less emphasis on research and more on teaching. Catholic Western University (CWU) CWU is a private catholic Jesuit University. CWU has over 15,000 students in three different colleges; the biggest college is the College for Professional Studies (CPS) with over 12,000 students. With satellite campuses across the region, CPS offers nontraditional accelerated Undergraduate and Graduate degrees for working adults. About 40% of CPS’s credits are completed online. CPS does not have a tenure track for faculty; rather full-time faculty are employed on a contractual basis and not eligible for tenure. Over 80% of the courses are taught by adjunct faculty. Corporate University (CU) CU provides a career-oriented, technology-based education to about 47,000 undergraduate and graduate students at 70 locations in 22 states and Canada- - 21,000 of which are fully online students. More than half of the students are nontraditional and diverse students. CU employs 1100 faculty as well as adjuncts who teach more than 50% of the courses. Faculty are not eligible for tenure and the teaching load for full time faculty is 45 credit hours. Research University (RU) RU is a traditional research based institution with academic programs in science, education, business, and philosophy. It is an urban institution with limited housing for its 16,000+ students in undergraduate and graduate degree programs. RU is a tenure granting institution with moderately intensive research requirements and less focus on teaching and advising.
- 8. Running head: EXAMINING FACULTY MOTIVATION 8 Only 30% of courses are taught by adjunct faculty. Table 2 Institutional Differences Undergraduate Courses Graduate Courses Tenure or Tenure Track Faculty Emphasis of Faculty % of courses taught by part-time faculty RU Yes Yes Yes Scholarship 25% CC Yes No Yes Teaching 65% CWU Yes Yes No Teaching 80% CU Yes Yes No Teaching 65% An online survey was administered to faculty at each institution. A total of 524 faculty (234 full-time faculty and 290 part-time faculty) from the four institutions completed the survey. The participants who completed the survey represented a cross section of employment types. The survey was developed to investigate faculty characteristics, motivation to attend faculty development, and obstacles to attending faculty development. The survey was designed to yield both quantitative and qualitative data using likert scale types of questions as well as open-ended questions. Before administering the survey, it was verified for content validity by two faculty development directors at higher education institutions. Data Analysis The data was downloaded and imported into SPSS once the surveys were completed. Descriptive statistics, an analysis of variance (ANOVA), as well as a multivariate analysis of variance (MANOVA) were used to analyze the quantitative data (Keppel, 1991; Leech, Barrett & Morgan, 2008; Lomax 2001). The open-ended questions were analyzed by three researchers
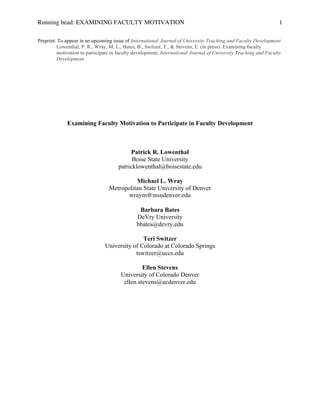
- 9. Running head: EXAMINING FACULTY MOTIVATION 9 using a constant comparison analysis qualitative technique (Leech & Onwuegbuzie, 2007) of identifying “significant statements” (Creswell, 2007, p. 61), coding these statements, and finding themes in the data. Results Frequency of Attending Faculty Development Our first research question focused on the frequency that faculty attended faculty development across institution types. An ANOVA was used to examine the frequency of attending faculty development programs across institutions. A significant difference was found between institutional types and faculty rank in the total number of faculty development activities attended over a two year period, F (3,510) = 5.623, p=.001, eta² = .18, which according to Cohen, (1998) was a small effect. City College (CC) faculty reported the highest mean attendance (M=6.45). At CC, tenure track faculty attended an average of 9.53 activities and tenured faculty attended an average of 9.11 activities over a two year period. Research University (RU), on the other hand, reported the lowest attendance (M=3.50) (see Table 3 and Figure 1). Table 3 Means, Standard Deviation and N for Frequency of Attending Professional Development Activities by Tenure Status Employment Type M SD N Adjunct 4.06 5.13 290 Corporate University 3.31 2.06 13 City College 3.71 4.54 55 Catholic Western University Research University 4.30 3.05 5.88 5.71 201 21 Non Tenure Track 5.49 5.13 100 Corporate University 5.96 5.59 49 City College 4.50 .71 2
- 10. Running head: EXAMINING FACULTY MOTIVATION 10 Catholic Western University 5.97 4.92 36 Research University 2.54 3.23 13 Tenure Track 5.31 5.81 62 City College 9.53 8.20 19 Research University 3.44 2.93 43 Tenured 6.57 6.21 72 City College 9.11 6.82 35 Research University 4.13 3.09 29 Total Schools * 4.82 5.64 524 Corporate University 5.40 5.16 62 City College 6.45 6.60 110 Catholic Western University 4.56 5.77 237 Research University 3.50 4.62 115 *p<.001 4.3 5.97 0 0 3.31 5.96 0 0 3.71 4.5 9.53 9.11 3.05 12 10 8 6 4 2 0 Adjunct Non tenure Tenure Track Tenure Adjunct Non tenure Tenure Track Tenure Adjunct Non tenure Tenure Track Tenure Adjunct Catholic Western Corporate U City College Research U Figure 1. Faculty attendance at faculty development by institution and rank Preferred Format for Faculty Development 2.54 3.44 4.13 Non tenure Tenure Track A MANOVA was used to address the second research question of our study which Tenure focused on faculty’s preferred format for faculty development. There was a significant main
- 11. Running head: EXAMINING FACULTY MOTIVATION 11 effect for institutional type, Pillai’s Trace = .073, F (15, 1518) = 5.88, p<.001, eta² = .023, which was a medium effect size according to Cohen, 1998. A follow-up ANOVA indicated that two variables contributed to the school differences, online workshops, F (3, 508) = 22.820, p < .001, and one-hour workshops, F (3, 508) = 4.275, p = .005. Across institutions faculty appeared to prefer formatted instruction, such as books or videotapes, and one-hour workshops (see Table 4). Each institution had books or videotapes as their first or second choice of preferred format (M=3.37). One-hour workshops were also listed as the first or second preferred format in each institution except CWU (M=3.30). Table 4 Means and Standard Deviations of likelihood total faculty would participate in formats of professional development learning activities, by institution Institution Development Activity M SD N CC New classroom technology 3.22 1.26 110 Books or videotapes 3.44 1.18 110 Weekend retreat 2.32 1.20 110 One hour workshop* 3.24 1.15 110 Online formats** 2.71 1.21 110 CU New classroom technology 3.29 1.27 62 Books or videotapes 3.39 1.19 62 Weekend retreat 2.00 .99 62 One hour workshop* 3.53 1.08 62 Online formats** 3.41 1.02 CWU New classroom technology 3.56 1.22 237 Books or videotapes 3.24 1.20 237 Weekend retreat 2.46 1.99 237 One hour workshop* 3.11 1.26 237 Online formats** 3.31 1.24 RU New classroom technology 3.36 1.28 115 Books or videotapes 3.57 1.01 115 Weekend retreat 2.43 1.22 115 One hour workshop* 3.63 1.06 115 Online formats** 4.15 2.35 115
- 12. Running head: EXAMINING FACULTY MOTIVATION 12 Total Schools New classroom technology 3.41 1.25 524 Books or videotapes 3.37 1.18 524 Weekend retreat 2.37 1.19 524 One hour workshop* 3.30 1.19 524 Online formats** 3.38 1.60 524 *p=.005, **p<.001 Motivation to Attend Faculty Development Our third research question focused on what motivates faculty to attend faculty development. We used multiple types of analysis to answer this research question. We first used a MANOVA to investigate the differences between faculty employment type and institution type in their motivation to attend faculty development programs. There was a significant interaction between institution type and employment type, Pillai’s Trace = .057, F (16,1010) = 1.85, p= .021, eta² = .029. The follow-up ANOVA indicated that release time significantly contributed to institution type differences for institutions with tenure status, F (2,511) = 3.52, p= .030. See Tables 5 and 6, following. Table 5 Means and Standard Deviations of Incentives by Institution Institution Development Activity M SD N CC Release time* .37 .486 110 Stipend .59 .494 110 Promotion .32 .468 110 Public Recognition .13 .335 110 Awards .24 .427 110 Letters of Recognition .06 .245 110 Certificates .33 .471 110 Incentives not important .19 .395 110 CU Release time* .48 .504 62 Stipend .50 .504 62 Promotion .34 .477 62 Public Recognition .18 .385 62 Awards .27 .450 62 Letters of Recognition .11 .319 62 Certificates .40 .495 62 Incentives not important .21 .410 62 CWU Release time* .18 .386 238
- 13. Running head: EXAMINING FACULTY MOTIVATION 13 Stipend .37 .485 238 Promotion .12 .328 238 Public Recognition .05 .219 238 Awards .11 .318 238 Letters of Recognition .05 .219 238 Certificates .25 .433 238 Incentives not important .39 .488 238 RU Release time* .32 .469 115 Stipend .34 .475 115 Promotion .19 .395 115 Public Recognition .05 .223 115 Awards .17 .373 115 Letters of Recognition .08 .270 115 Certificates .30 .458 115 Incentives not important .43 .497 115 Total Schools Release time* .29 .453 525 Stipend .43 .495 525 Promotion .20 .403 525 Public Recognition .08 .274 525 Awards .17 .376 525 Letters of Recognition .07 .250 525 Certificates .29 .456 525 Incentives not important .33 .472 525 *p=.021 Table 6 Means and Standard Deviations of Incentives by Tenure Status Incentive Tenure Status M SD N Stipend Tenured .38 .488 72 Tenure Track .48 .504 62 Non Tenure Track .33 .437 100 Adjunct .46 .499 291 Total .43 .495 525 Release Time* Tenured .40 .494 72 Tenure Track .40 .495 62 Non Tenure Track .61 .490 100 Adjunct .12 .330 291 Total .29 .453 525 Promotion Tenured .18 .387 72 Tenure Track .37 .487 62 Non Tenure Track .27 .446 100 Adjunct .15 .359 291 Total .20 .403 525 Public Recognition Tenured .10 .298 72
- 14. Running head: EXAMINING FACULTY MOTIVATION 14 Tenure Track .13 .338 62 Non Tenure Track .11 .314 100 Adjunct .06 .235 291 Total .08 .274 525 Awards Tenured .13 .333 72 Tenured Track .27 .450 62 Non Tenure Track .21 .409 100 Adjunct .14 .352 291 Total .17 .376 525 Letters of Recognition Tenured .05 .201 72 Tenure Track .15 .355 62 Non Tenure Track .08 .273 100 Adjunct .05 .221 291 Total .07 .250 525 Certificates Tenured .29 .444 72 Tenured Track .34 .477 62 Non Tenure Track .30 .461 100 Adjunct .29 .454 291 Total .29 .456 525 Incentives not important Tenured .29 .458 72 Tenured Track .32 .471 62 Non Tenure Track .32 .469 100 Adjunct .35 .478 291 Total .33 .472 525 *p=.021 Not surprisingly, part-time faculty accounted for the significant difference between faculty types (M=.12). Tenured, tenure track and non-tenure track faculty, reported either stipends or release time as their top two incentives to participate in faculty development. At the same time though, all faculty types (including part-time), reported that non-monetary or time incentives were not important, (M=.33). A moderate level of importance was attributed to certificates of participation (M=.29). To further explore what motivates faculty to participate in faculty development, we inquired what motivated faculty to attend previous development activities. A MANOVA was used to identify if there were any differences in what motivated faculty to attend previous development activities across institution type and faculty type. There was a significant
- 15. Running head: EXAMINING FACULTY MOTIVATION 15 interaction between institution type and tenure status, Pillai’s Trace = .030, F (10,1020) = 1.55, p= .12, eta² = .015. A follow-up ANOVA indicated that “activity was related to technology” was significantly different for institutions with different tenure types, F (2,608) = 3.43, p= .033, eta²=.013. This indicates that tenured and full-time faculty in our sample were more likely to attend previous faculty development activities if the subject was related to technology. Overall, faculty in our sample were most likely to attend faculty development to improve teaching (M=.31). Although there were similar means across institution type, RU reported the highest motivation to improve teaching (M=.43). Table 7 shows the differences between reasons for attending across institution types. Required faculty development as well as activities related to technology were the next most frequent response (M=.25). Not surprisingly, CC, where professional development activities are often required, had the highest response to required attendance (M=.71). RU had the highest response to activities related to technology (M=.43). Table 7 Means and Standard Deviations of Motivation to Attend Past Faculty Development Event Institution Development Activity M SD N CC PD was required .24 .427 110 I got paid to attend .04 .118 110 Needed for promotion .14 .345 110 Needed for teaching skill .31 .464 110 Activity related to technology* .25 .438 110 CU PD was required .71 .458 62 I got paid to attend .10 .298 62 Needed for promotion .05 .216 62 Needed for teaching skill .23 .422 62 Activity related to technology* .11 .319 62 CWU PD was required .22 .417 238 I got paid to attend .04 .191 238 Needed for promotion .02 .144 238 Needed for teaching skill .32 .469 238 Activity related to technology* .21 .405 238
- 16. Running head: EXAMINING FACULTY MOTIVATION 16 RU PD was required .05 .223 115 I got paid to attend .03 .184 115 Needed for promotion .04 .205 115 Needed for teaching skill .57 .498 115 Activity related to technology* .43 .497 115 Total Schools PD was required .25 .431 525 I got paid to attend .04 .205 525 Needed for promotion .05 .225 525 Needed for teaching skill .31 .464 525 Activity related to technology* .25 .435 525 *p=.033 Obstacles to Attend Faculty Development The final research question focused on obstacles to attend faculty development. Faculty were asked why they would not attend faculty development (e.g., because the time and day of the event, competing priorities, lack of financial support, inconvenient location, or uninterested in the topic). Results reported in Table 8 indicated that there is a significant main effect Pillai’s Trace = .066, F (15,1299) = 1.94, p= .016, eta² = .022. A follow-up ANOVA indicated that financial support from one’s institution significantly contributed to the group difference {F(10,435) = 4.43, p= .004, eta² = .030. Table 8 Means and Standard Deviations of reasons not to attend faculty development contributing to school mean difference
- 17. Running head: EXAMINING FACULTY MOTIVATION 17 Institution Reason not to attend M SD N City College Time and day of the event .73 .447 110 Corporate University Catholic Western U. Research University Total Schools Time and day of the event .65 .478 525 *p=.004 Other competing priorities .59 .494 110 Financial support from institution* Location .11 .313 110 Topic .22 .415 110 Time and day of the event Other competing priorities .48 .504 62 Financial support from institution* Location .39 .491 62 Topic .16 .371 62 Time and day of the event Other competing priorities .57 .497 238 Financial support from institution* Location .42 .494 238 Topic .21 .411 238 Time and day of the event Other competing priorities .64 .487 115 Financial support from institution* Location .19 .401 115 Topic .25 .439 115 Other competing priorities .57 .496 525 Financial support from institution* Location .32 .466 525 Topic .21 .408 525 Discussion Frequency of Attendance .55 .712 110 .63 .487 62 .84 .853 62 .63 .485 238 .30 .580 238 .58 .500 115 .36 .543 115 .44 .680 525 The first research question examined whether faculty differ by employment type, tenure status, or institution type in their frequency of attending faculty development programs. We
- 18. Running head: EXAMINING FACULTY MOTIVATION 18 found that institutions that reward attendance to faculty development reported significantly higher attendance than schools that did not. Mandatory attendance also resulted in higher mean scores. This suggests that if institutions want to use faculty development to improve teaching and learning (which entails having faculty regularly attend faculty development) then they need to either establish reward structures that help encourage faculty to attend or (depending on the culture of the institution) possibly require faculty to attend. Preferred Format for Faculty Development The second research question investigated faculty’s preferred format for faculty development. When we examined the types of activities the respondents preferred, the one-hour format, which involves the least time commitment, and the online format, which provides convenience, prevailed. This suggests that, similar to previous studies, online faculty development might be a viable option for institutions that plan to respond to current trends (Posler, 2008; Sherer, 2005). Motivation to Attend Faculty Development For the third research question, we examined incentives as a motive to attend faculty development. Although we found that the preference for release time differed significantly between the groups, it was not surprising to see that part-time faculty (the major contributor to group difference) did not value release time as an incentive. Part-time faculty are typically not eligible for release time at these institutions. Where participation in faculty development was somehow related to tenure and/or promotion, faculty also tended to prefer documentation for their attendance. More is learned, however, by examining the descriptive results across all institutions. Overall results suggest that receiving a stipend was the most motivating factor for encouraging attendance. The next highest incentive, release time, was prevalent among full-time faculty.
- 19. Running head: EXAMINING FACULTY MOTIVATION 19 Obstacles to Attend Faculty Development The fourth research question focused on possible obstacles that might prevent faculty from attending faculty development activities. Time and competing priorities were the top two obstacles for attending faculty development by faculty across all institutions. A total of 65% of the faculty also responded that the time and day of the event is a major obstacle to attending faculty development. Financial support differed significantly across institution types. At CU for example, where there is limited, or no, budget to attend activities outside of the institution, 84% of faculty responded that lack of financial support impeded their attendance. The other institution types had similar means. However, faculty at RU, compared to the other institutions, were the least likely to list financial support as an obstacle—suggesting that faculty at research institutions like RU have access to more financial resources and support than faculty at smaller institutions. The open ended questions added a voice to these findings. Both tenure track and part-time faculty at each institution made comments such as, “If I had more time to attend, I would more than likely try to attend all the faculty development workshops,” and “It isn’t lack of motivation…it is lack of time. Most affiliate faculty have full time jobs, families (some young children), etc.”. Perhaps the most complete and informative response is from a RU tenure track faculty member who remarked, “In my experience, there is little if any time to take advantage of faculty development workshops or other institutional opportunities…nose is to the grindstone 24/7 preparing for classes, conducting research and performing service. For me, it has little to do with motivation…I simply don’t have a spare minute.”
- 20. Running head: EXAMINING FACULTY MOTIVATION 20 Implications of the Study It is in the best interest of our academic institutions to provide opportunities for faculty to improve their teaching and research skills and to foster the career development of both new and seasoned teachers. As previously mentioned, there are many different faculty development models and programs. However, the key to using faculty development to improve teacing and learning does not solely lie on the shoulders of each faculty development program; instead, it lies in how to get faculty to attend these excellent programs. The best program in the world is not going to improve the teaching process if few people attend. What motivates faculty? What incentives should be provided? It is clear there is no specific technique for encouraging participation in faculty development. However, there are some trends that each institution can, and should, garner from these results. Most apparent is that institutions must value faculty development attendance at learning activities and implement some kind of a reward structure for attendance. In fact, one faculty member commented, “Having a formula in place to count this toward teaching as well as research (as in a course release without external funding) would free up time for me to attend workshops.” Another faculty member suggested that receiving “credits toward tenure” would be a way to motivate faculty to attend workshops. While requiring attendance might improve attendance rates, it is yet to be determined that improvement would result from such participation. An even higher participation might be achieved if faculty, particularly adjunct faculty, are paid to attend. Additionally, institutions may consider varied times and formats that focus on those workshops that tend to have fewer time conflicts, such as books, videotapes, or online resources.
- 21. Running head: EXAMINING FACULTY MOTIVATION 21 References AAC&U. (2002). Greater expectations: A new vision for learning as a nation goes to college. Washington, DC: American Association of Colleges and Universities. Blackburn, R. T., & Lawrence, J. H. (1995). Faculty at work: Motivation, expectation, satisfaction. Baltimore: Johns Hopkins University Press. Boyer, E. L. (1990). Scholarship reconsidered: Priorities of the professoriate. New York: John Wiley &Sons. Chism, N. V. N. (Ed.) (2008). Faculty at the margins. New directions for higher education,143. San Francisco: Jossey-Bass. Chism, N. V. N, & Szabo, B. (1996). Who uses faculty development services? In L. Richlin (Ed.), To improve the academy (Vol. 15; pp. 129-154). Stillwater, OK: New Forms Press. Christensen, C. (2008). The employment of part-time faculty at community colleges. In N.V.N.Chism (Ed.), Faculty at the margins. New Directions for Higher education, 143 (pp. 29-26). San Francisco: Jossey-Bass. Cole, K. A., Barker, L. R., Kolodner, K., Williamson, P. R., Wright, S. M., & Kern, D. E. (2004). Faculty development in teaching skills: An intensive longitudinal model. Academic Medicine, 79, 469-480. Cohen, J. (1998). Statistical power analysis for the behavioral sciences (2nd ed.). New Jersey: Lawrence Erlbaum. Creswell, J. W. (2007). Qualitative inquiry and research design: Choosing from among five traditions (2nd ed.). Thousand Oaks, CA: Sage. Eddy, P. L. (2007). Faculty development in rural community colleges. New Directions For Community Colleges, 137, 65-76.
- 22. Running head: EXAMINING FACULTY MOTIVATION 22 Elen, J., Lindbloom-Ylanne, S., & Clement, M. (2007). Faculty development in research-intensive universities: The role of academics’ conceptions on the relationship between research and teaching. International Journal for Academic Development, 12(2), 123-139. Fletcher, J. J., & Patrick, S. K. (1998). Not just workshops any more: The role of faculty development in reframing academic priorities. International Journal for Academic Development, 3(1), 39. Gardiner, L. F. (2005). Transforming the environment for learning: A crises of quality. In S. Chadwick-Blossey & D. R. Robertson (Eds.), To improve the academy: Resources for faculty, instructional, and organizational development. (Vol. 23, pp. 3-23). Bolton, MA: Anker Publishing. Hill, L., Soo La, K., & Lagueux, R. (2007). Faculty collaboration as faculty development. Peer Review, 9(4), 17-19. Holmgren, R. A. (2005). Teaching partners: Improving teaching and learning by cultivating a community of practice. In S. Chadwick-Blossey & D. R. Robertson (Eds.), To improve the academy: Resources for faculty, instructional, and organizational development. (Vol. 23). Bolton, MA: Anker Publishing. Houston, T., & Weaver, C. L. (2007). Peer coaching: Professional development for experienced faculty. Innovations in Higher education, 33, 5-20. Keppel, G. (1991). Design and analysis: A researcher's handbook (3rd ed.). Englewood Cliffs, NJ: Prentice Hall. Knight, A. M., Carrese, J. A., & Wright, S. M. (2007). Qualitative assessment of the long-term impact of a faculty development programme in teaching skills. Medical Education, 41(6), 592-600.
- 23. Running head: EXAMINING FACULTY MOTIVATION 23 Kolbo, J. R., & Turnage, C. C. (2002). Technological applications in faculty development. The Technology Source, 39. Retrieved from http://technologysource.org/section/ faculty_and_staff_development/ Laursen, S., & Rocque, B. (2009). Faculty development for institutional change: Lessons from an advance project. Change, 41(2), 18-26. Leech, N., Barrett, K., & Morgan, G. (2008). SPSS for intermediate statistics: Use and Interpretation (3rd ed.). Mahwah, NJ: Lawrence Erlbaum Associates. Leech, N. L., & Onwuegbuzie, A. J. (2007). An array of qualitative data analysis tools: A call for data analysis triangulation. School Psychology Quarterly, 22(4), 557-584. Lomax, R. G. (2001). Statistical concepts: A second course for education and the behavioral sciences (2nd ed.). Mahwah, NJ: Lawrence Erlbaum Associates. Lieberman, D. (2005). Beyond faculty development: How centers for teaching and learning can be laboratories for learning. New Directions for Higher education, 131, 87-98. Lowenthal, P. R. (2008). Online faculty development and storytelling: An unlikely solution to improving teacher quality. Journal of Online Learning and Teaching, 4(3), 349-356. Lucas, A. F. (2002). Reaching the unreachable: Improving the teaching of poor teachers. In K. H. Gillespie, L. R. Hilsen, & E. C. Wadsworth (Eds.), A guide to faculty development (pp. 167-179). Bolton, MA: Anker. Maxwell, W. E., & Kazlauskas, E. J. (1987). Which faculty development methods really work in community colleges? A review of the research. Community/Junior College Quarterly, 11, 19-32. Menges, R. J. (1980). Teaching improvement strategies: How effective are they? In AAHE (Ed.), Current issues in higher education: Improving teaching and institutional quality Washington, DC: AAHE.
- 24. Running head: EXAMINING FACULTY MOTIVATION 24 Menges, R. J. (1997). Fostering faculty motivation to teach: Approaches to faculty development. In J.L. Bess (Ed), Teaching well and liking it: Motivating faculty to teach effectively (pp. 407-423). Baltimore: Johns Hopkins University Press. Mintz, J. A. (1999). Faculty development and teaching: A holistic approach. Liberal Education, 85(2), 32. Murray, J. P. (2000). Faculty development in Texas two-year colleges. Community College Journal of Research and Practice, 24, 251-267. Posler, B. D., & Bennett, L. (2008). Improving faculty development. Academic Leader, 24(9), 5- 7. Roche, V. (2001). Professional development models and transformative change: A case study of indicators of effective practice in higher education. The International Journal for Academic Development, 6(2), 120-129. Sherer, P. (2005). Web-based technology improves faculty development. Academic Leader, 21(1), 2-8. Sorcinelli, M. D., Austin, A. E., Eddy, P. L., & Beach, A. L. (2006). Creating the future of faculty development: Learning from the past, understanding the present. Bolton: MA: Anker. Stevens, E. (1988). Tinkering with teaching. Review of Higher Education, 12(1), 63-78. Travis, J. E., Hursh, D., Lankewicz, G., & Tang, Li (1995). Monitoring the pulse of the faculty: Needs assessment in faculty development programs. In L. Richlin (Ed.), To improve the academy, 15 (pp. 95-114). Stillwater, OK: New Forms Press. Wood, V. L., Stevens, E., McFarlane, T., Peterson, K., Richardson, K., Davis, R., et al. (1998).
- 25. Running head: EXAMINING FACULTY MOTIVATION 25 Faculty development workshop: Critical reflection in a web-based environment. Paper presented at the annual meeting of the Society for Information Technology & Teacher Education, Washington, DC. Wright, D. L. (2000). Faculty development centers in research universities: A study of resources and programs. In M. Kaplan & D. Lieberman (Eds.), To improve the academy, 18 (pp. 291-301). Bolton, MA: Anker.