This Document contains the results we received from our Questionnaires given to our thriller movie audience. It also includes an analysis of each question's result underneath the graph or chart.
Model Call Girls In Ariyalur WhatsApp Booking 7427069034 call girl service 24...
Questionnaire results
1. Thriller Movie Questionnaire Analysis:
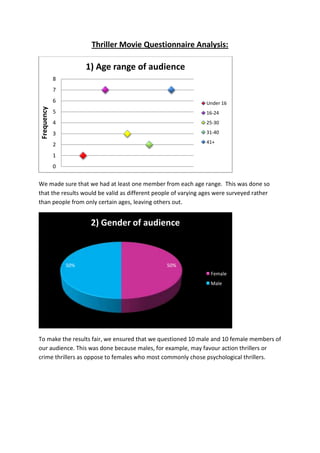
1) Age range of audience
8
7
6 Under 16
Frequency
5 16-24
4 25-30
3 31-40
2 41+
1
0
We made sure that we had at least one member from each age range. This was done so
that the results would be valid as different people of varying ages were surveyed rather
than people from only certain ages, leaving others out.
2) Gender of audience
50% 50%
Female
Male
To make the results fair, we ensured that we questioned 10 male and 10 female members of
our audience. This was done because males, for example, may favour action thrillers or
crime thrillers as oppose to females who most commonly chose psychological thrillers.
2. 3) Preferred thriller genre of
audience
Crime thrillers
Action thrillers
Psychological thrillers
Conspiracy thrillers
0 2 4 6 8 10 12
From this graph, we can conclude that most people prefer psychological thrillers and the
least favourite type of thriller is action thrillers. This benefits our movie opening as it is also
a psychological thriller and as evident from our survey, this would be popular. We allowed
our audience to tick more than one sub-genre to get a wider idea of their preferences.
4) Preffered Era by audience
16
14
12
10
8
6
4
2
0
1800s 1900s 2000s
Here, we see that the preferred era out of the three is 2000s. We can use this information
as the basis of our thriller movie opening and produce a movie set in the 2000s.
3. 5) Preffered colour of thriller movie
Black and White Colour Depends
5% 10%
85%
The answer to this question helps us to decide on whether to film our movie in black and
white or colour; as the majority of the people questioned favoured colour, our movie
opening will be in colour.
6) How often thriller movies are
watched
Other
Once every two months
Once a month
Less than twice a week
3-6 times a week
Every day
0 1 2 3 4 5 6
We included this questionnaire to get a general understanding of how often our audience
watch thriller movies. From the graph above, we see that most people either watch thriller
movies once a month or less than twice a week. Only three of the twenty people surveyed
watch thriller movies once every two months. From this, we can conclude that thriller
movies are watched often.
4. 7) Thriller movies watched by the
audience
Psycho
9% Gothika
18%
Paranormal Activity
21%
The Jacket
12%
The Human Centipede
6%
Saw
6%
28%
None
Most of the movies listed above are psychological movies. We included this question to see
whether psychological movies were popular or not as we are creating an opening to a
psychological movie. From the pie chart, we can finalise that many people do watch
psychological movies as only 9% of our audience questioned watched none of the movies
mentioned. This is a promising finalisation for our movie.