1. The economic cycle refers to short-run fluctuations in national output (real GDP) around its long-term trend. It includes periods of boom, slowdown, recession, and recovery.
2. A recession is defined as at least six months of falling output across the economy. It can cause rising unemployment, falling business profits, and declining tax revenues.
3. Estimating the output gap, which is the difference between actual GDP and potential GDP, is difficult but important for understanding inflationary pressures and spare capacity in the economy. A negative output gap indicates unused resources while a positive gap risks inflation.
Introduction to the Trade Cycle, key stages: Boom, Slowdown, Recession, Recovery, Depression. Real GDP trends in the UK, with projections from IMF, highlighting growth potential and stages.
Explained concept of output gap, negative and positive gaps, and challenges in accurate measurement.
Examples of demand and supply shocks along with potential causes of recession in an economy.
Short-term impacts of recession on business, employment, government finances; long-term social effects.
Contrast between recession and depression, discussing economic consequences and historical context.
Summary of the Trade Cycle and its relation to output gap, reinforcing initial concepts.
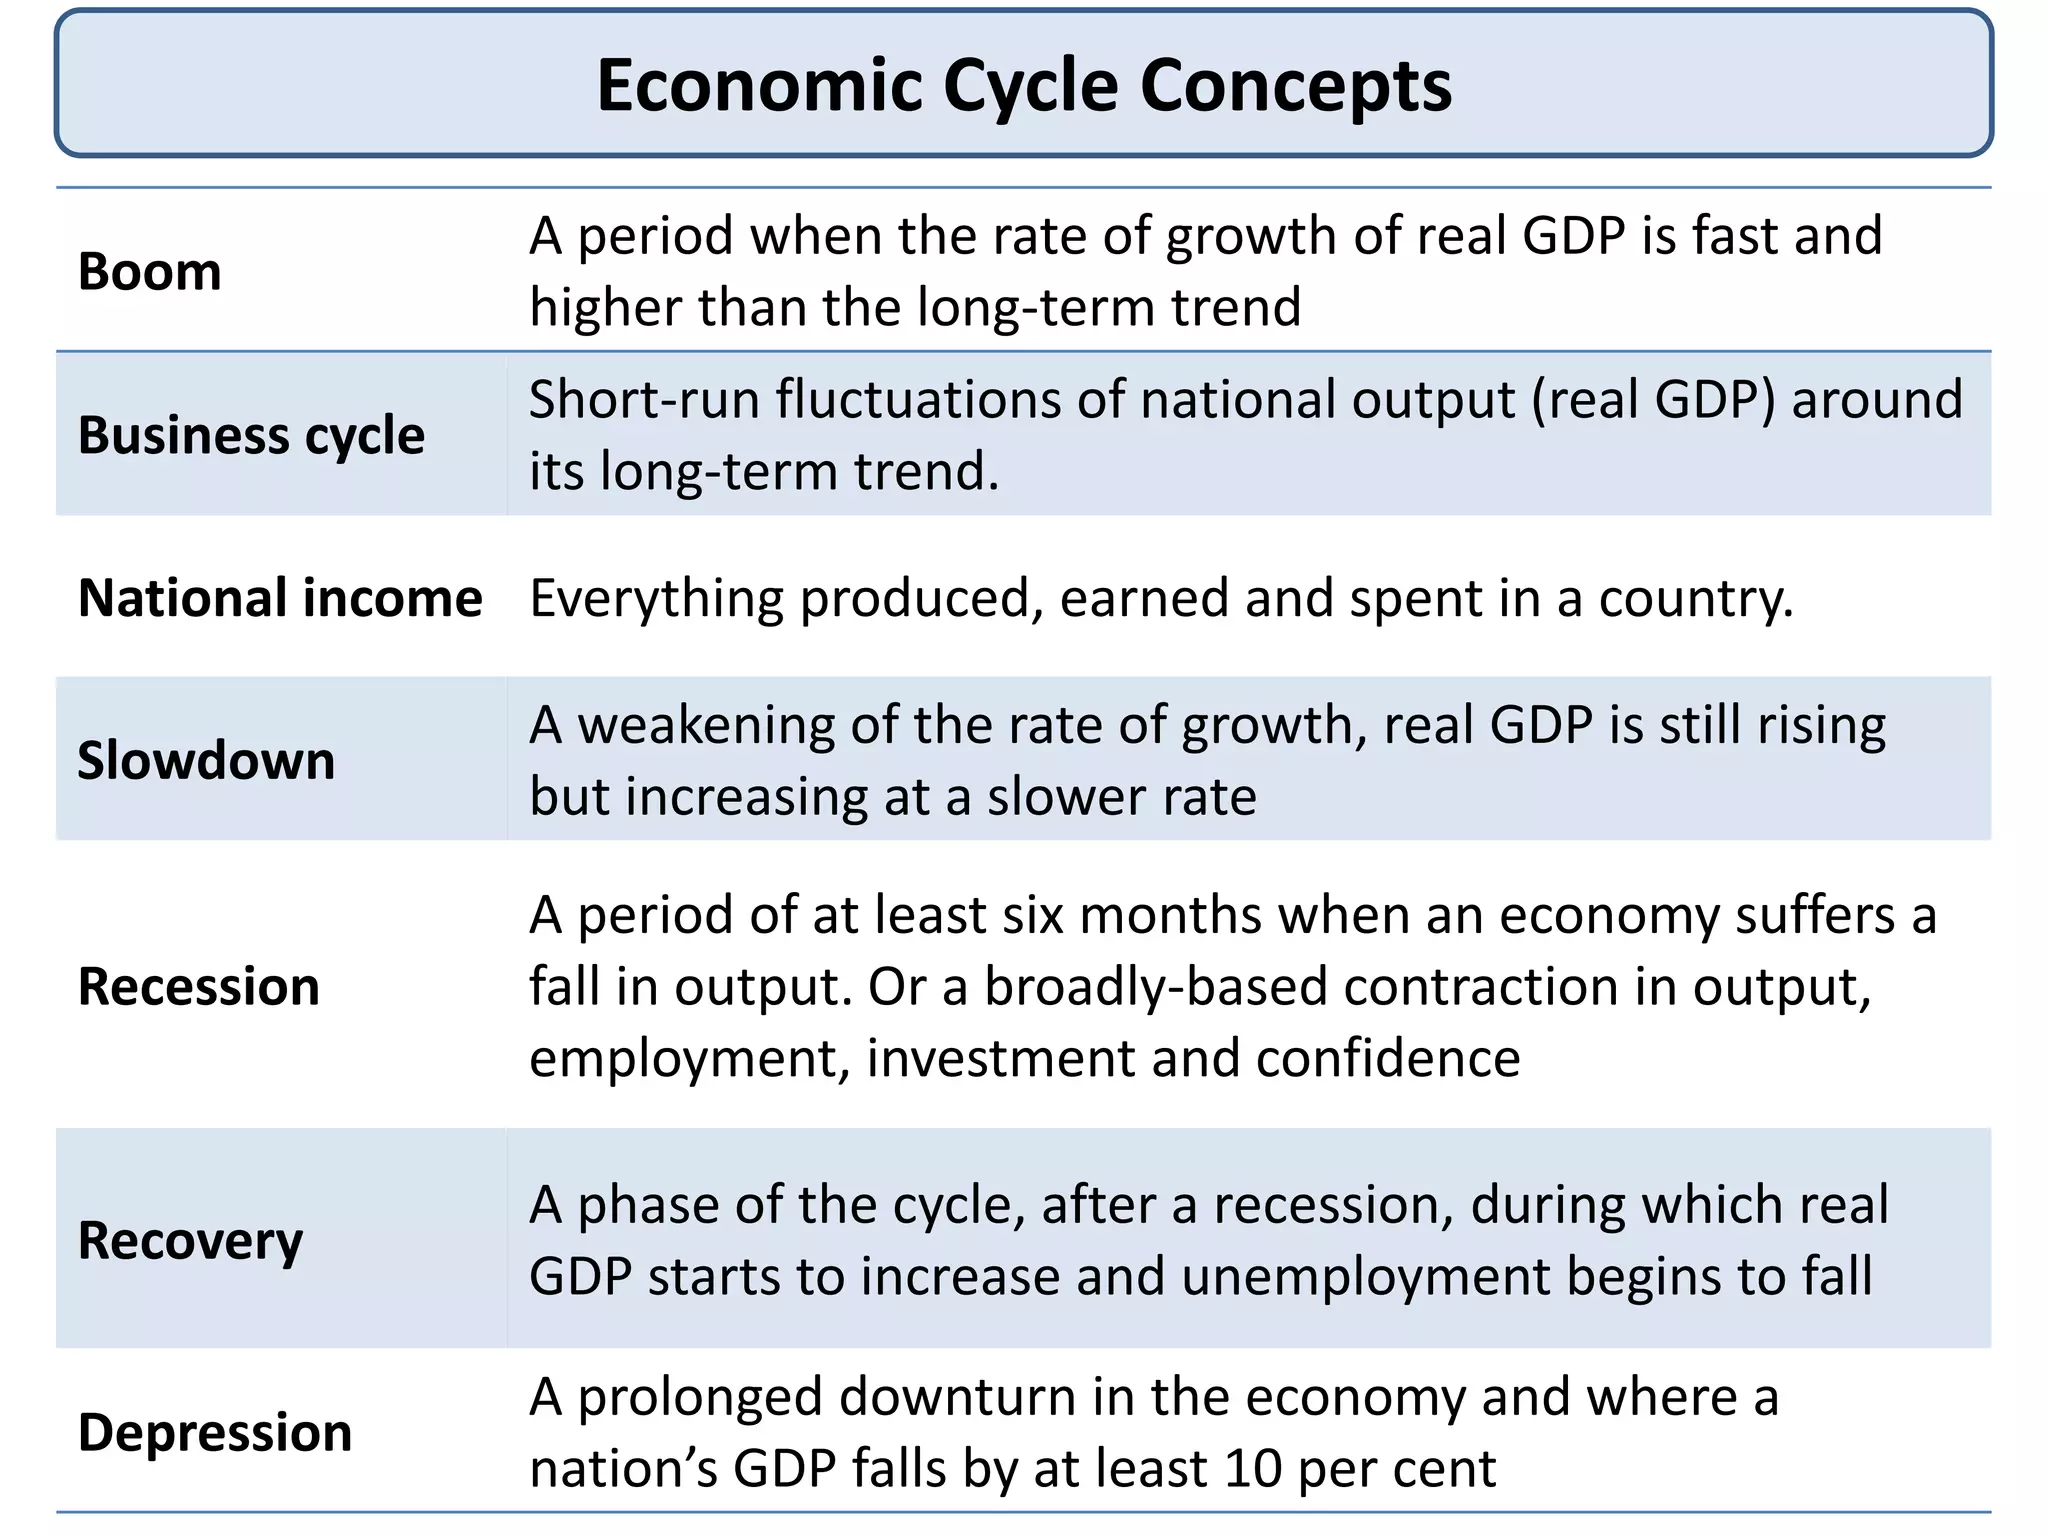
Economic Cycle Concepts
Boom
Aperiod when the rate of growth of real GDP is fast and
higher than the long-term trend
Business cycle
Short-run fluctuations of national output (real GDP) around
its long-term trend.
National income Everything produced, earned and spent in a country.
Slowdown
A weakening of the rate of growth, real GDP is still rising
but increasing at a slower rate
Recession
A period of at least six months when an economy suffers a
fall in output. Or a broadly-based contraction in output,
employment, investment and confidence
Recovery
A phase of the cycle, after a recession, during which real
GDP starts to increase and unemployment begins to fall
Depression
A prolonged downturn in the economy and where a
nation’s GDP falls by at least 10 per cent
3.
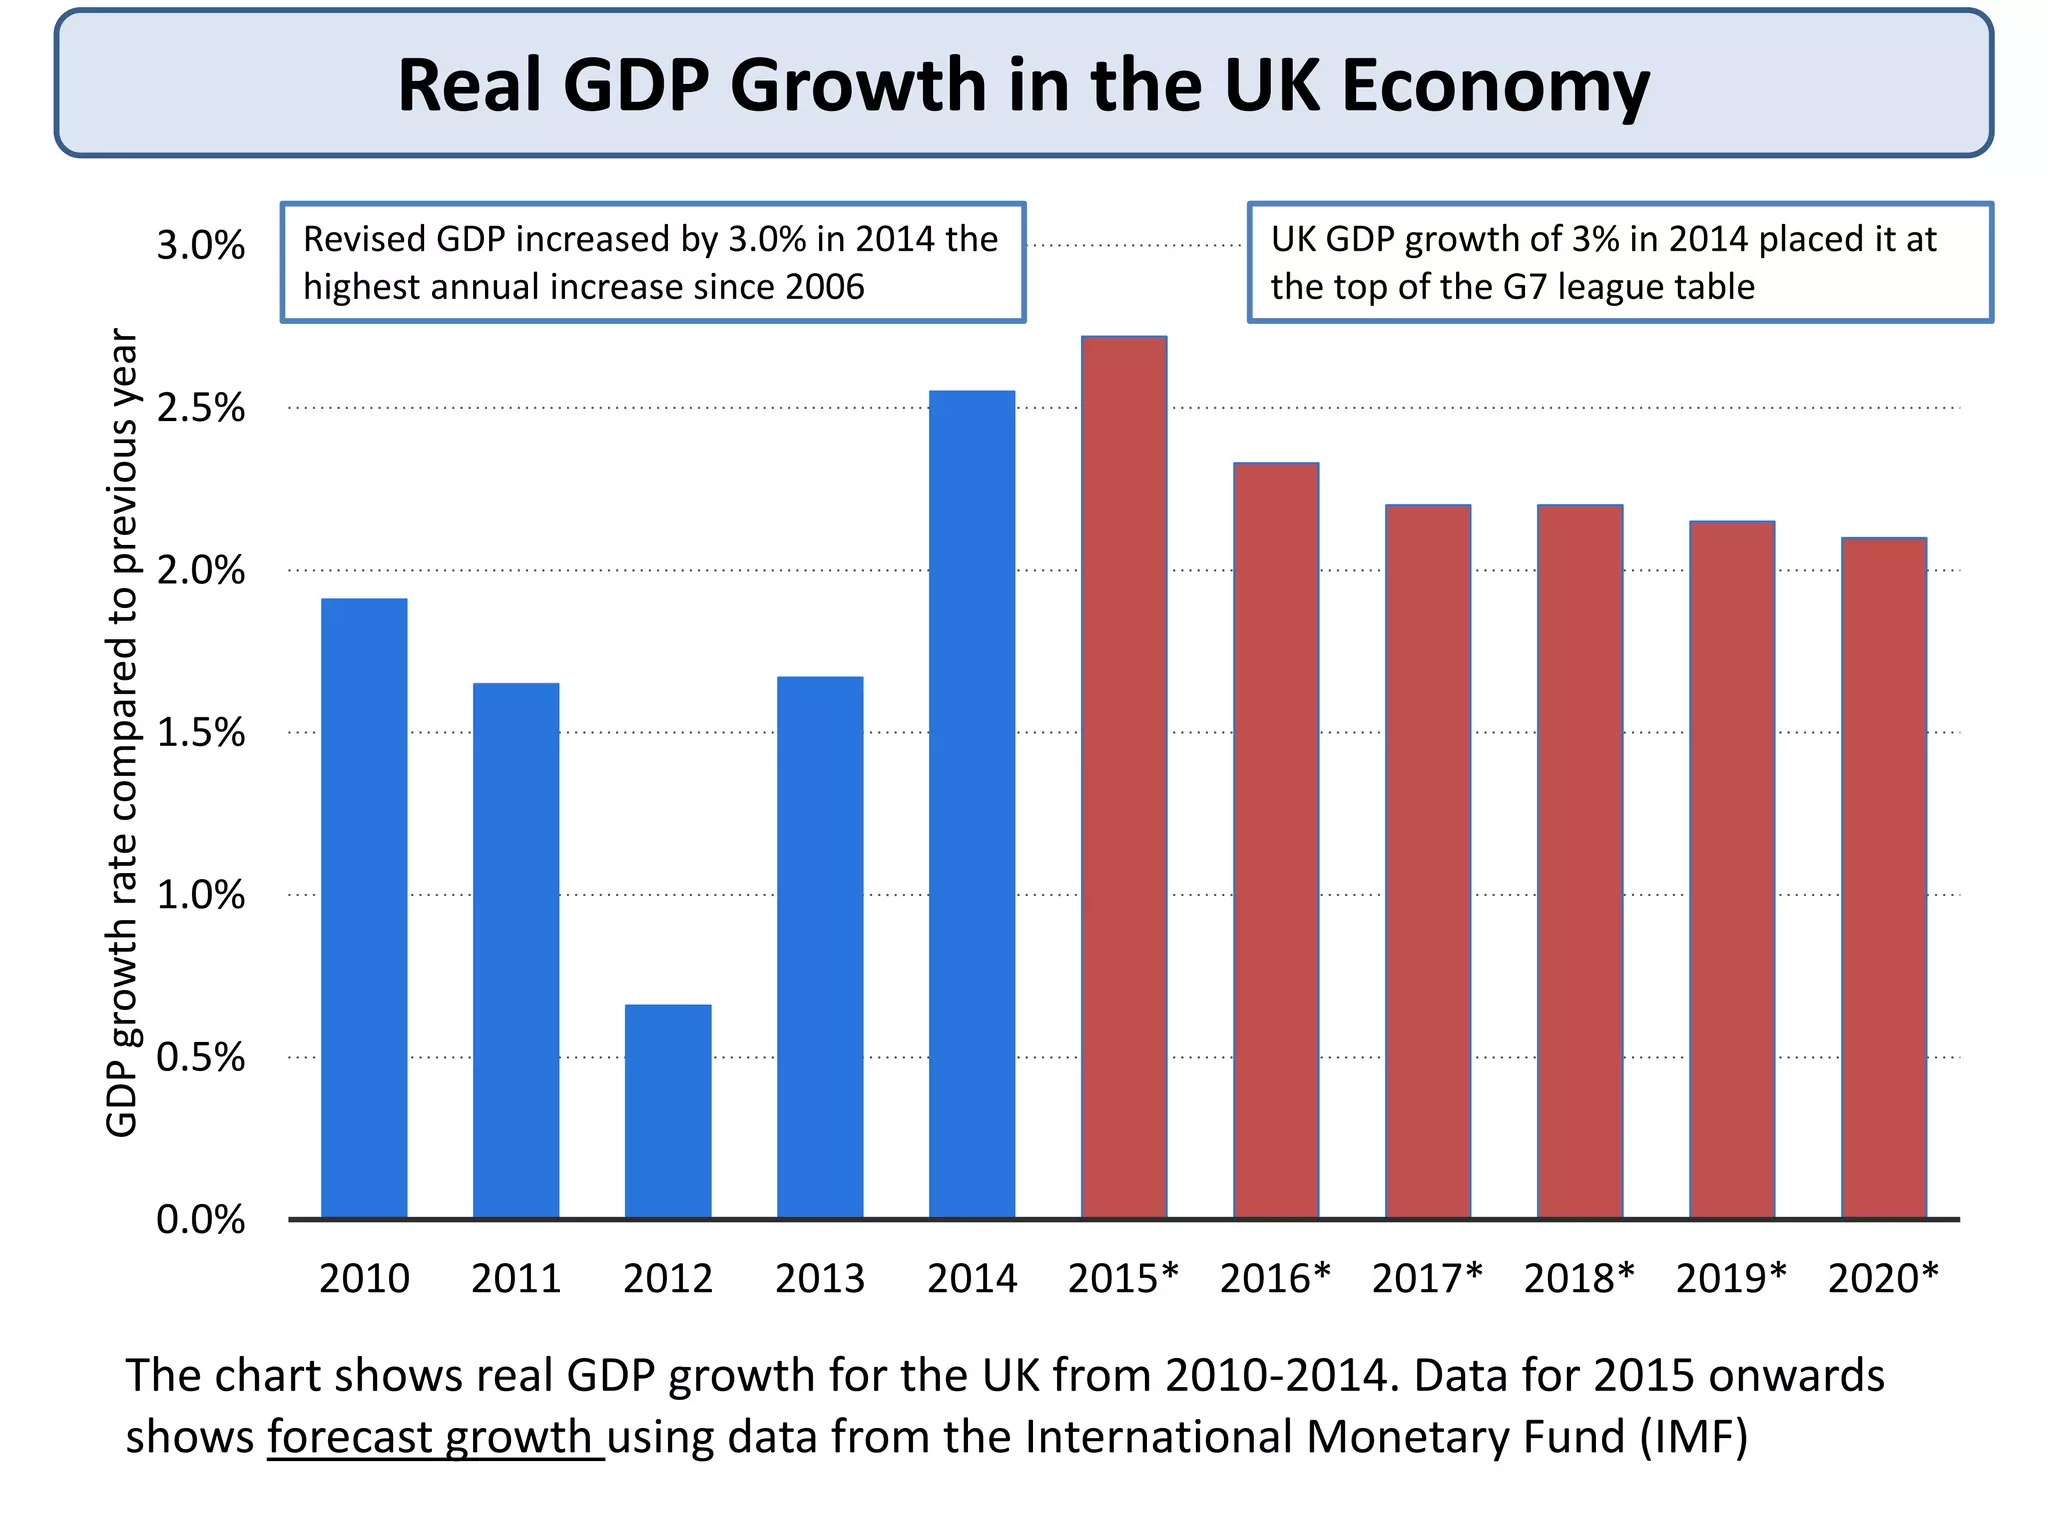
Real GDP Growthin the UK Economy
0.0%
0.5%
1.0%
1.5%
2.0%
2.5%
3.0%
2010 2011 2012 2013 2014 2015* 2016* 2017* 2018* 2019* 2020*
GDPgrowthratecomparedtopreviousyear
The chart shows real GDP growth for the UK from 2010-2014. Data for 2015 onwards
shows forecast growth using data from the International Monetary Fund (IMF)
UK GDP growth of 3% in 2014 placed it at
the top of the G7 league table
Revised GDP increased by 3.0% in 2014 the
highest annual increase since 2006
4.
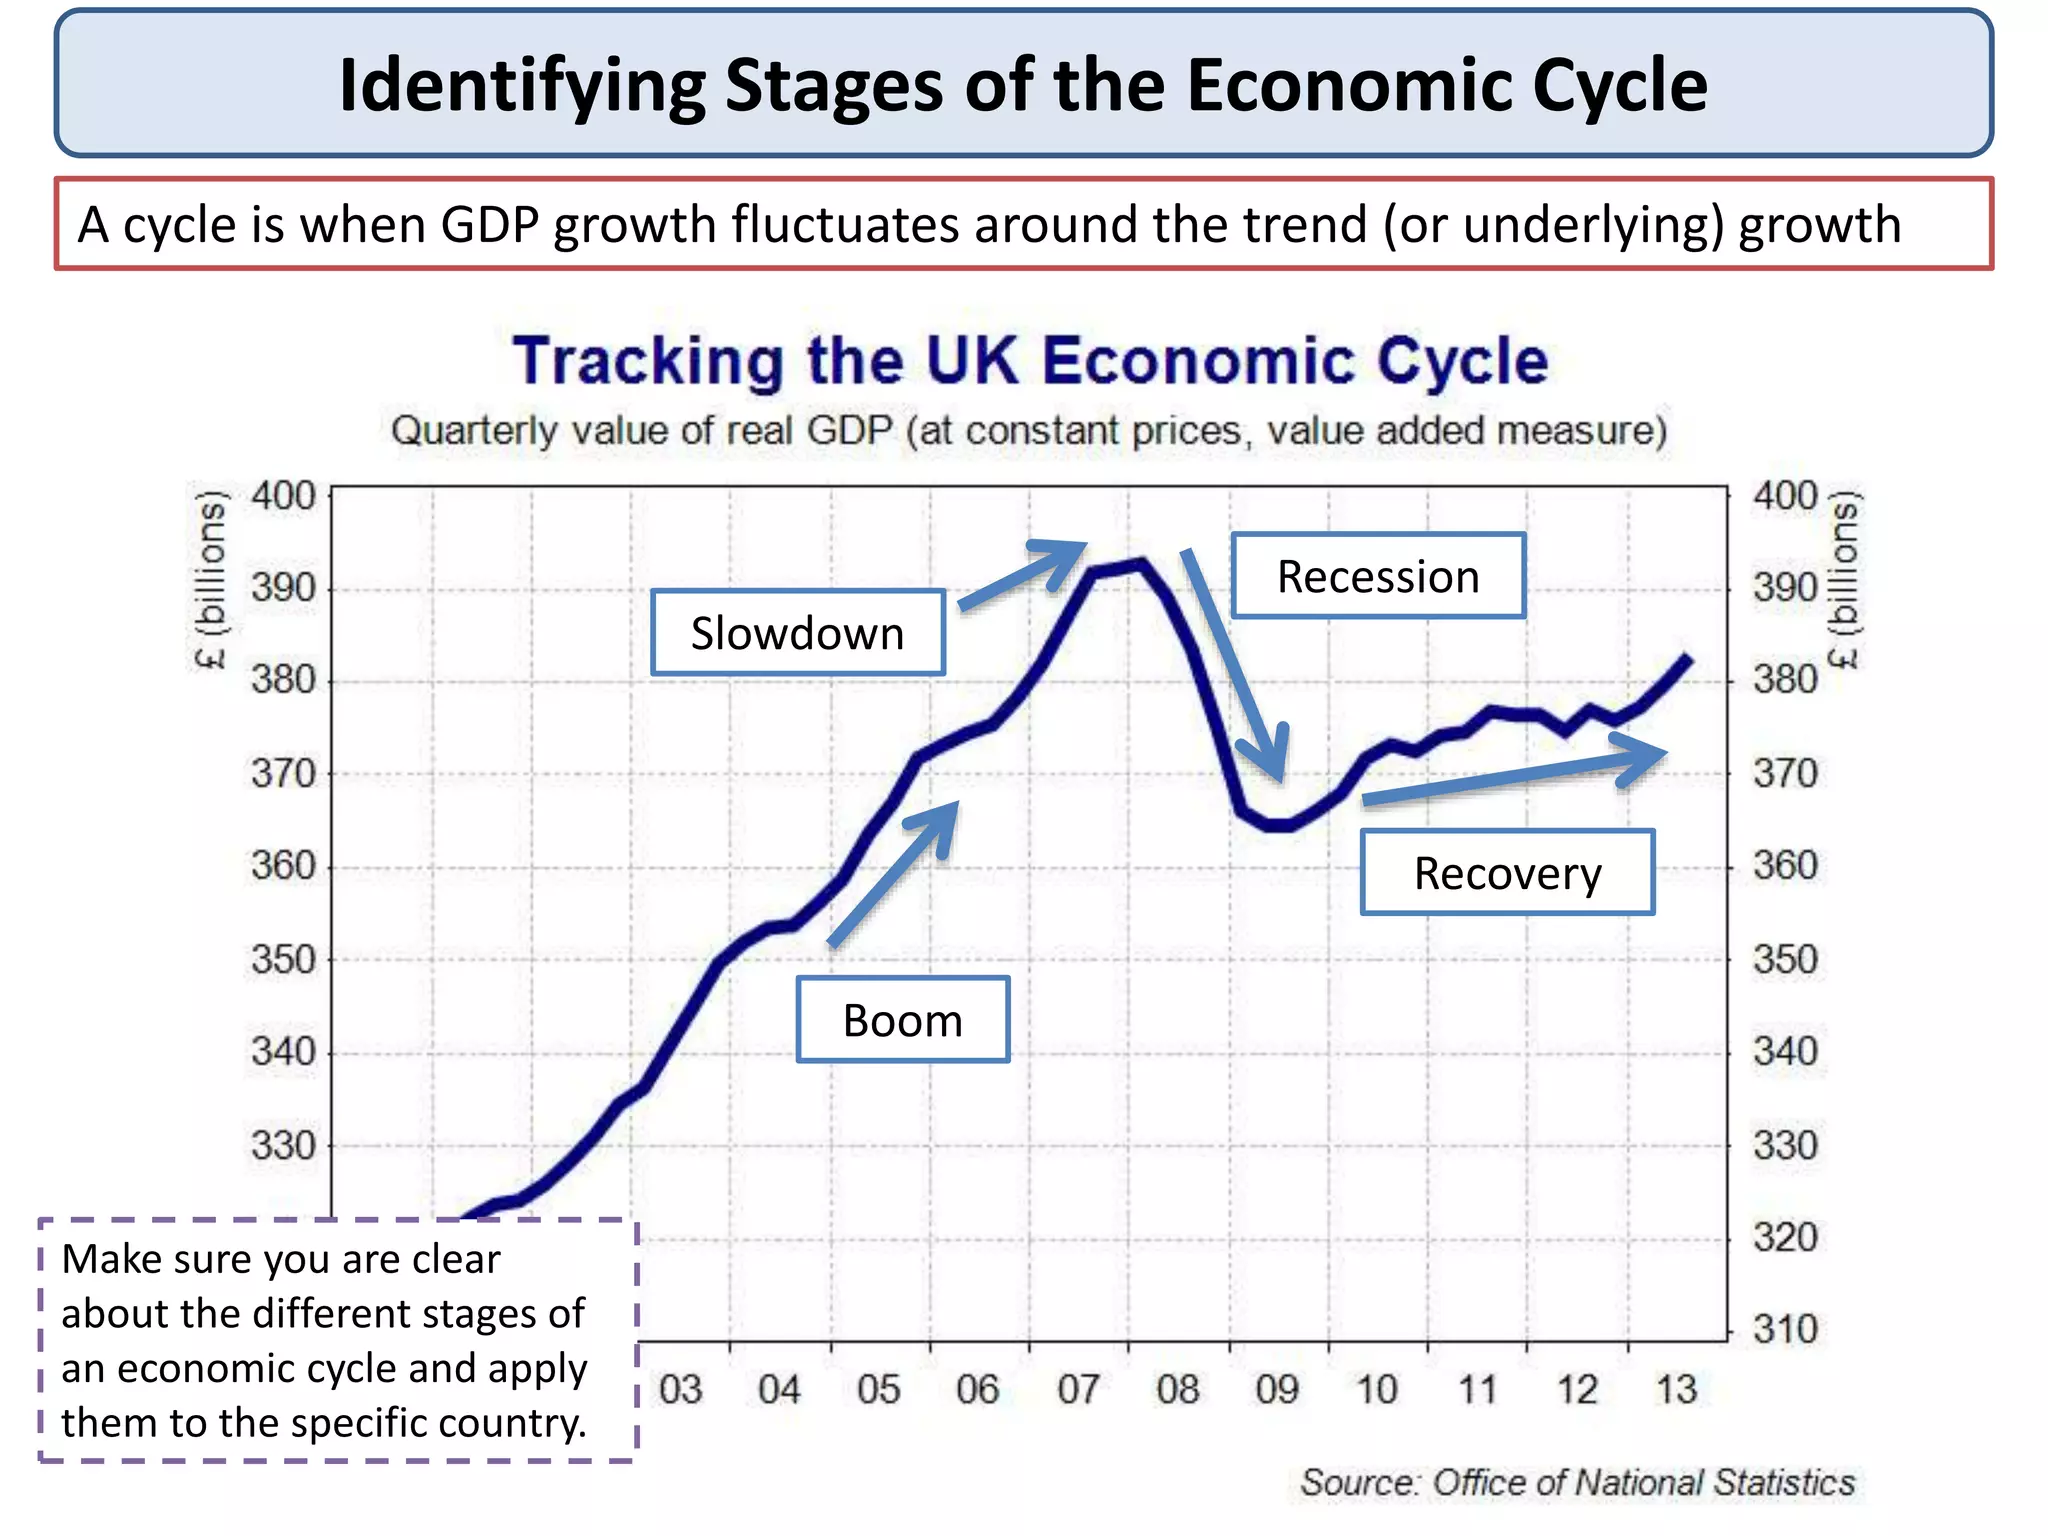
Identifying Stages ofthe Economic Cycle
Boom
Slowdown
Recession
Recovery
A cycle is when GDP growth fluctuates around the trend (or underlying) growth
Make sure you are clear
about the different stages of
an economic cycle and apply
them to the specific country.
5.
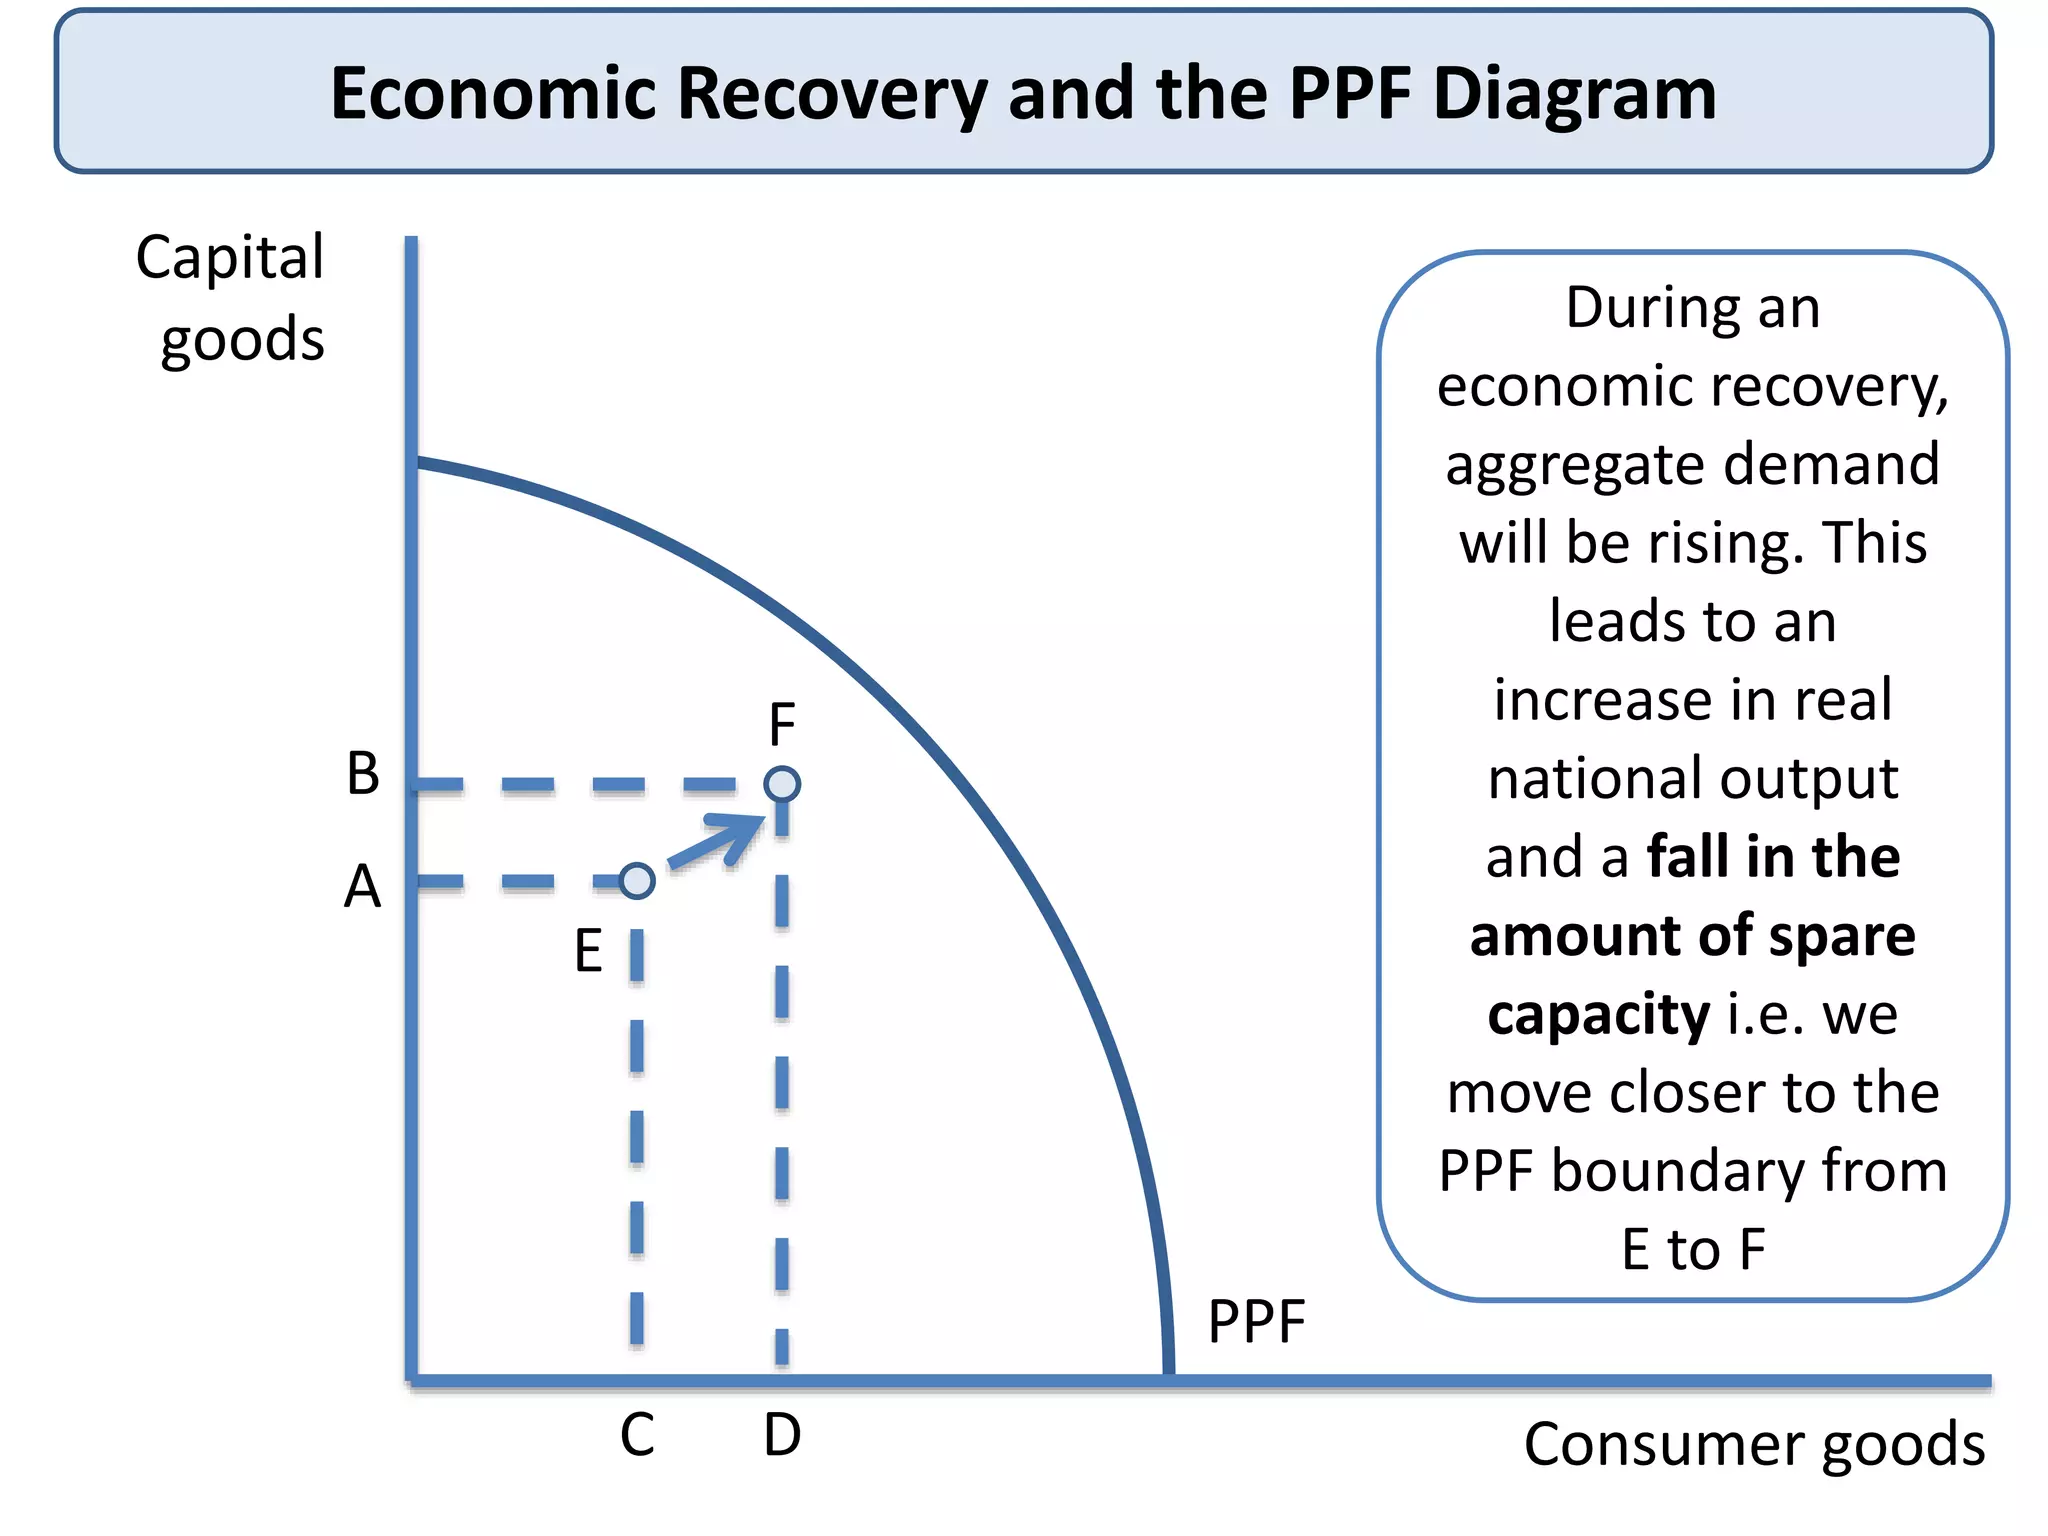
Economic Recovery andthe PPF Diagram
During an
economic recovery,
aggregate demand
will be rising. This
leads to an
increase in real
national output
and a fall in the
amount of spare
capacity i.e. we
move closer to the
PPF boundary from
E to F
Capital
goods
Consumer goods
PPF
A
B
C D
E
F
6.
-8% -6% -4%-2% 0% 2% 4% 6% 8%
Mining, oil, etc
Finance/insurance
Electricity & gas
Agriculture
Water & waste
Manufacturing
Other services
Construction
Hotels & restaurants
Property services
Transport & comms
Retail & wholesale
Prof & business services
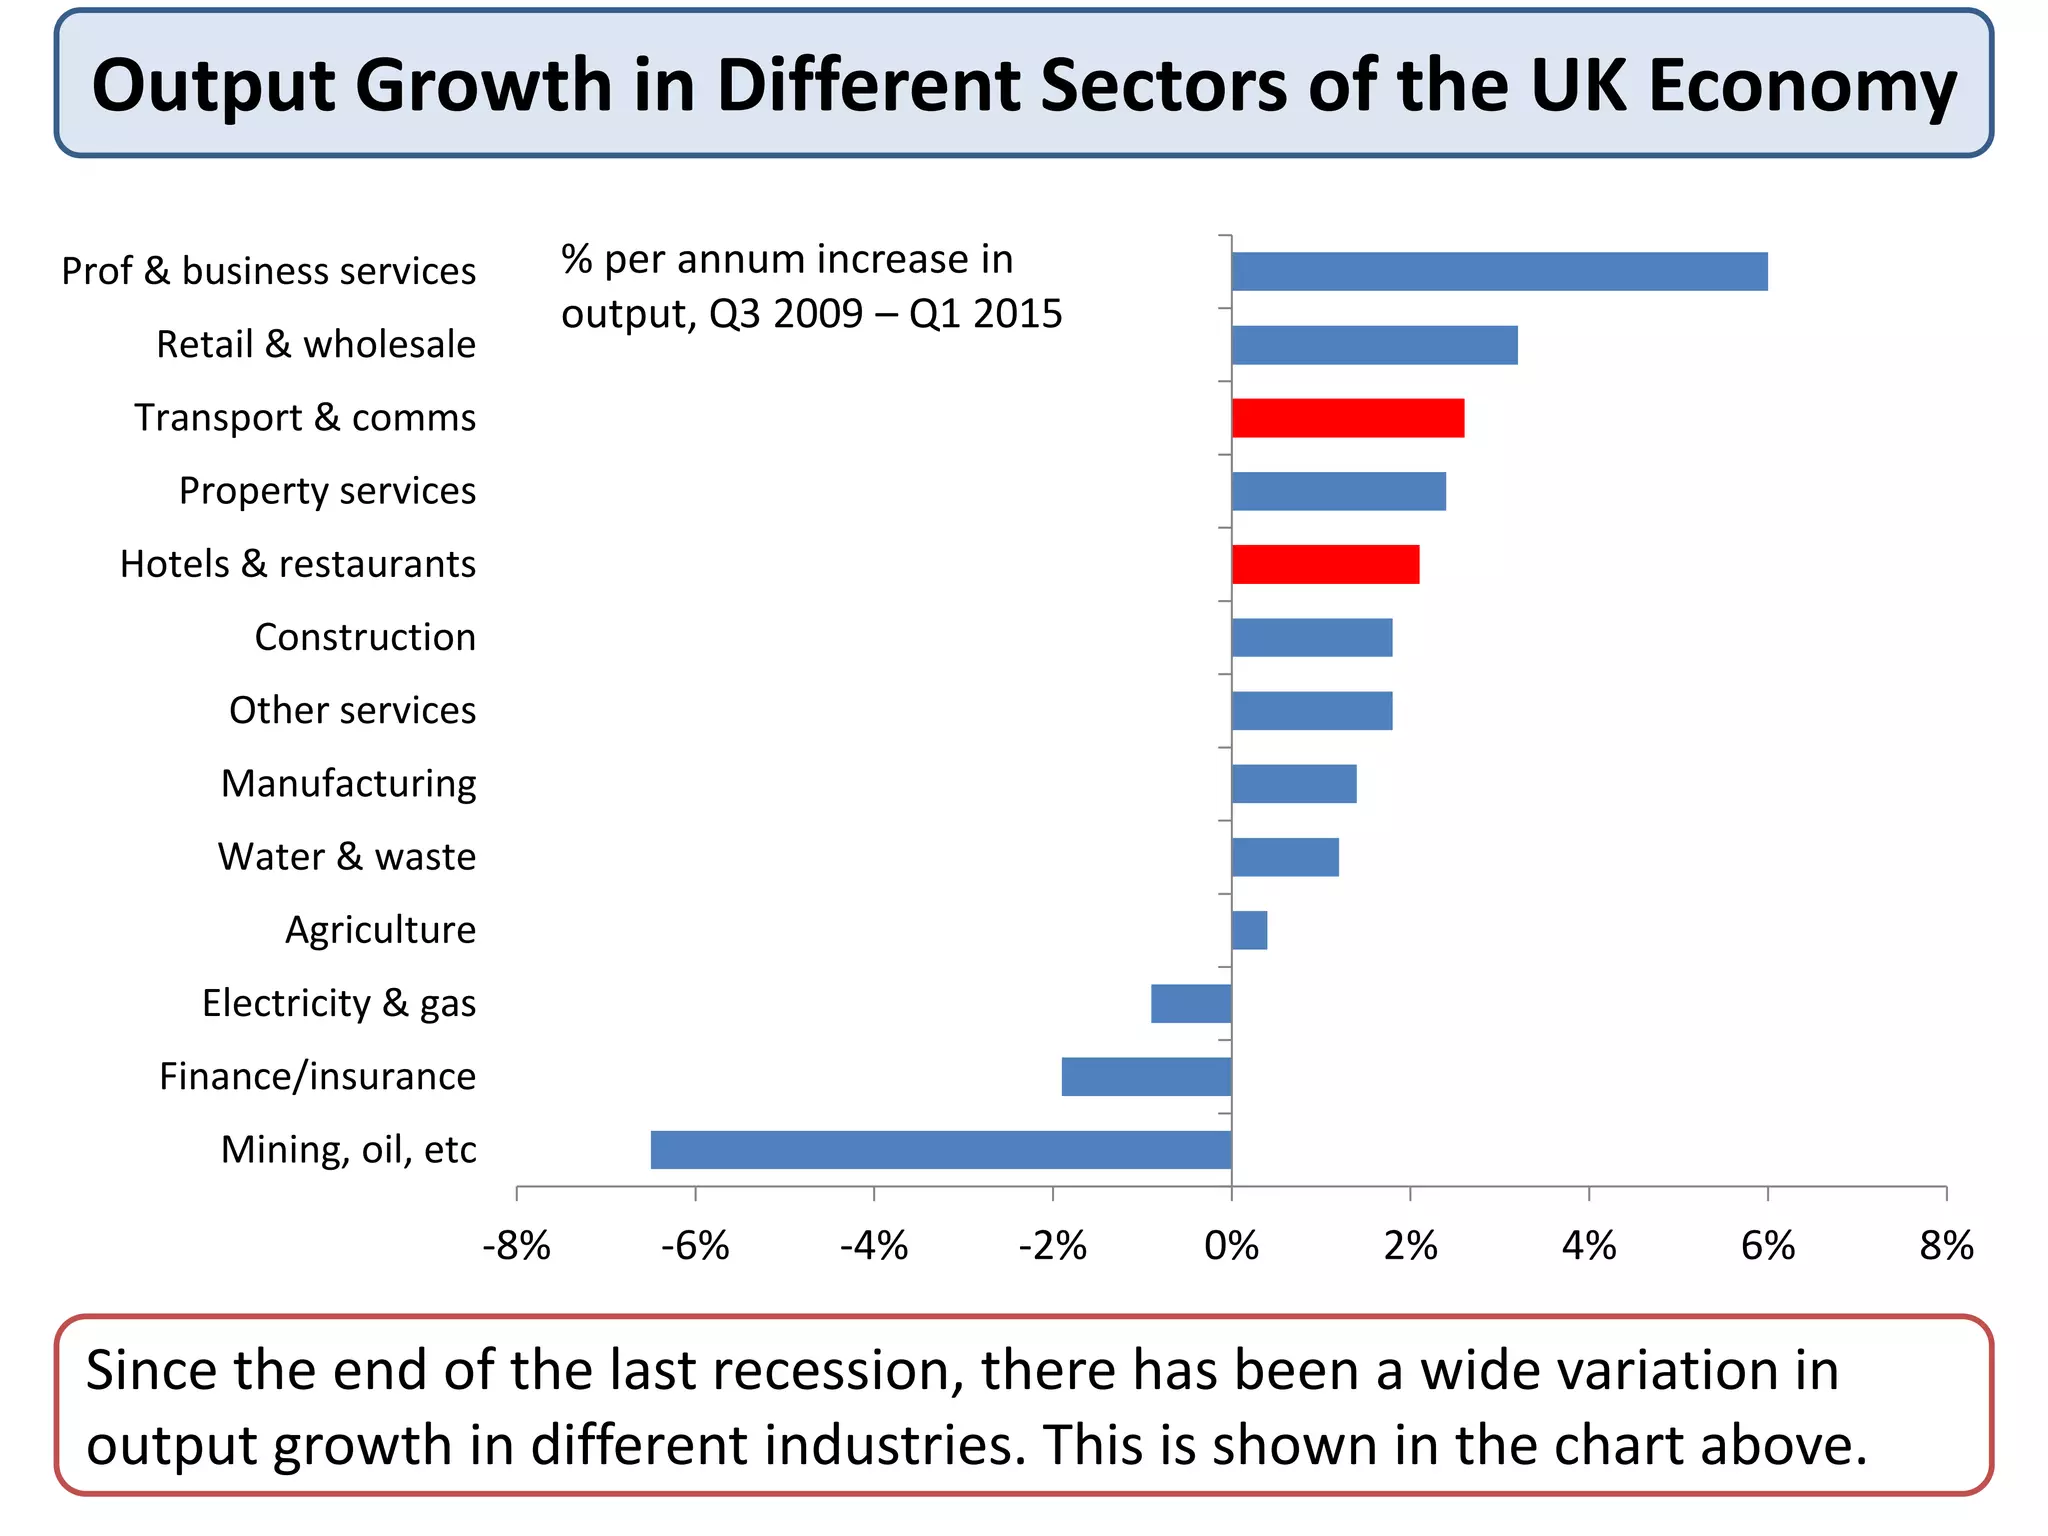
Output Growth in Different Sectors of the UK Economy
Since the end of the last recession, there has been a wide variation in
output growth in different industries. This is shown in the chart above.
% per annum increase in
output, Q3 2009 – Q1 2015
7.
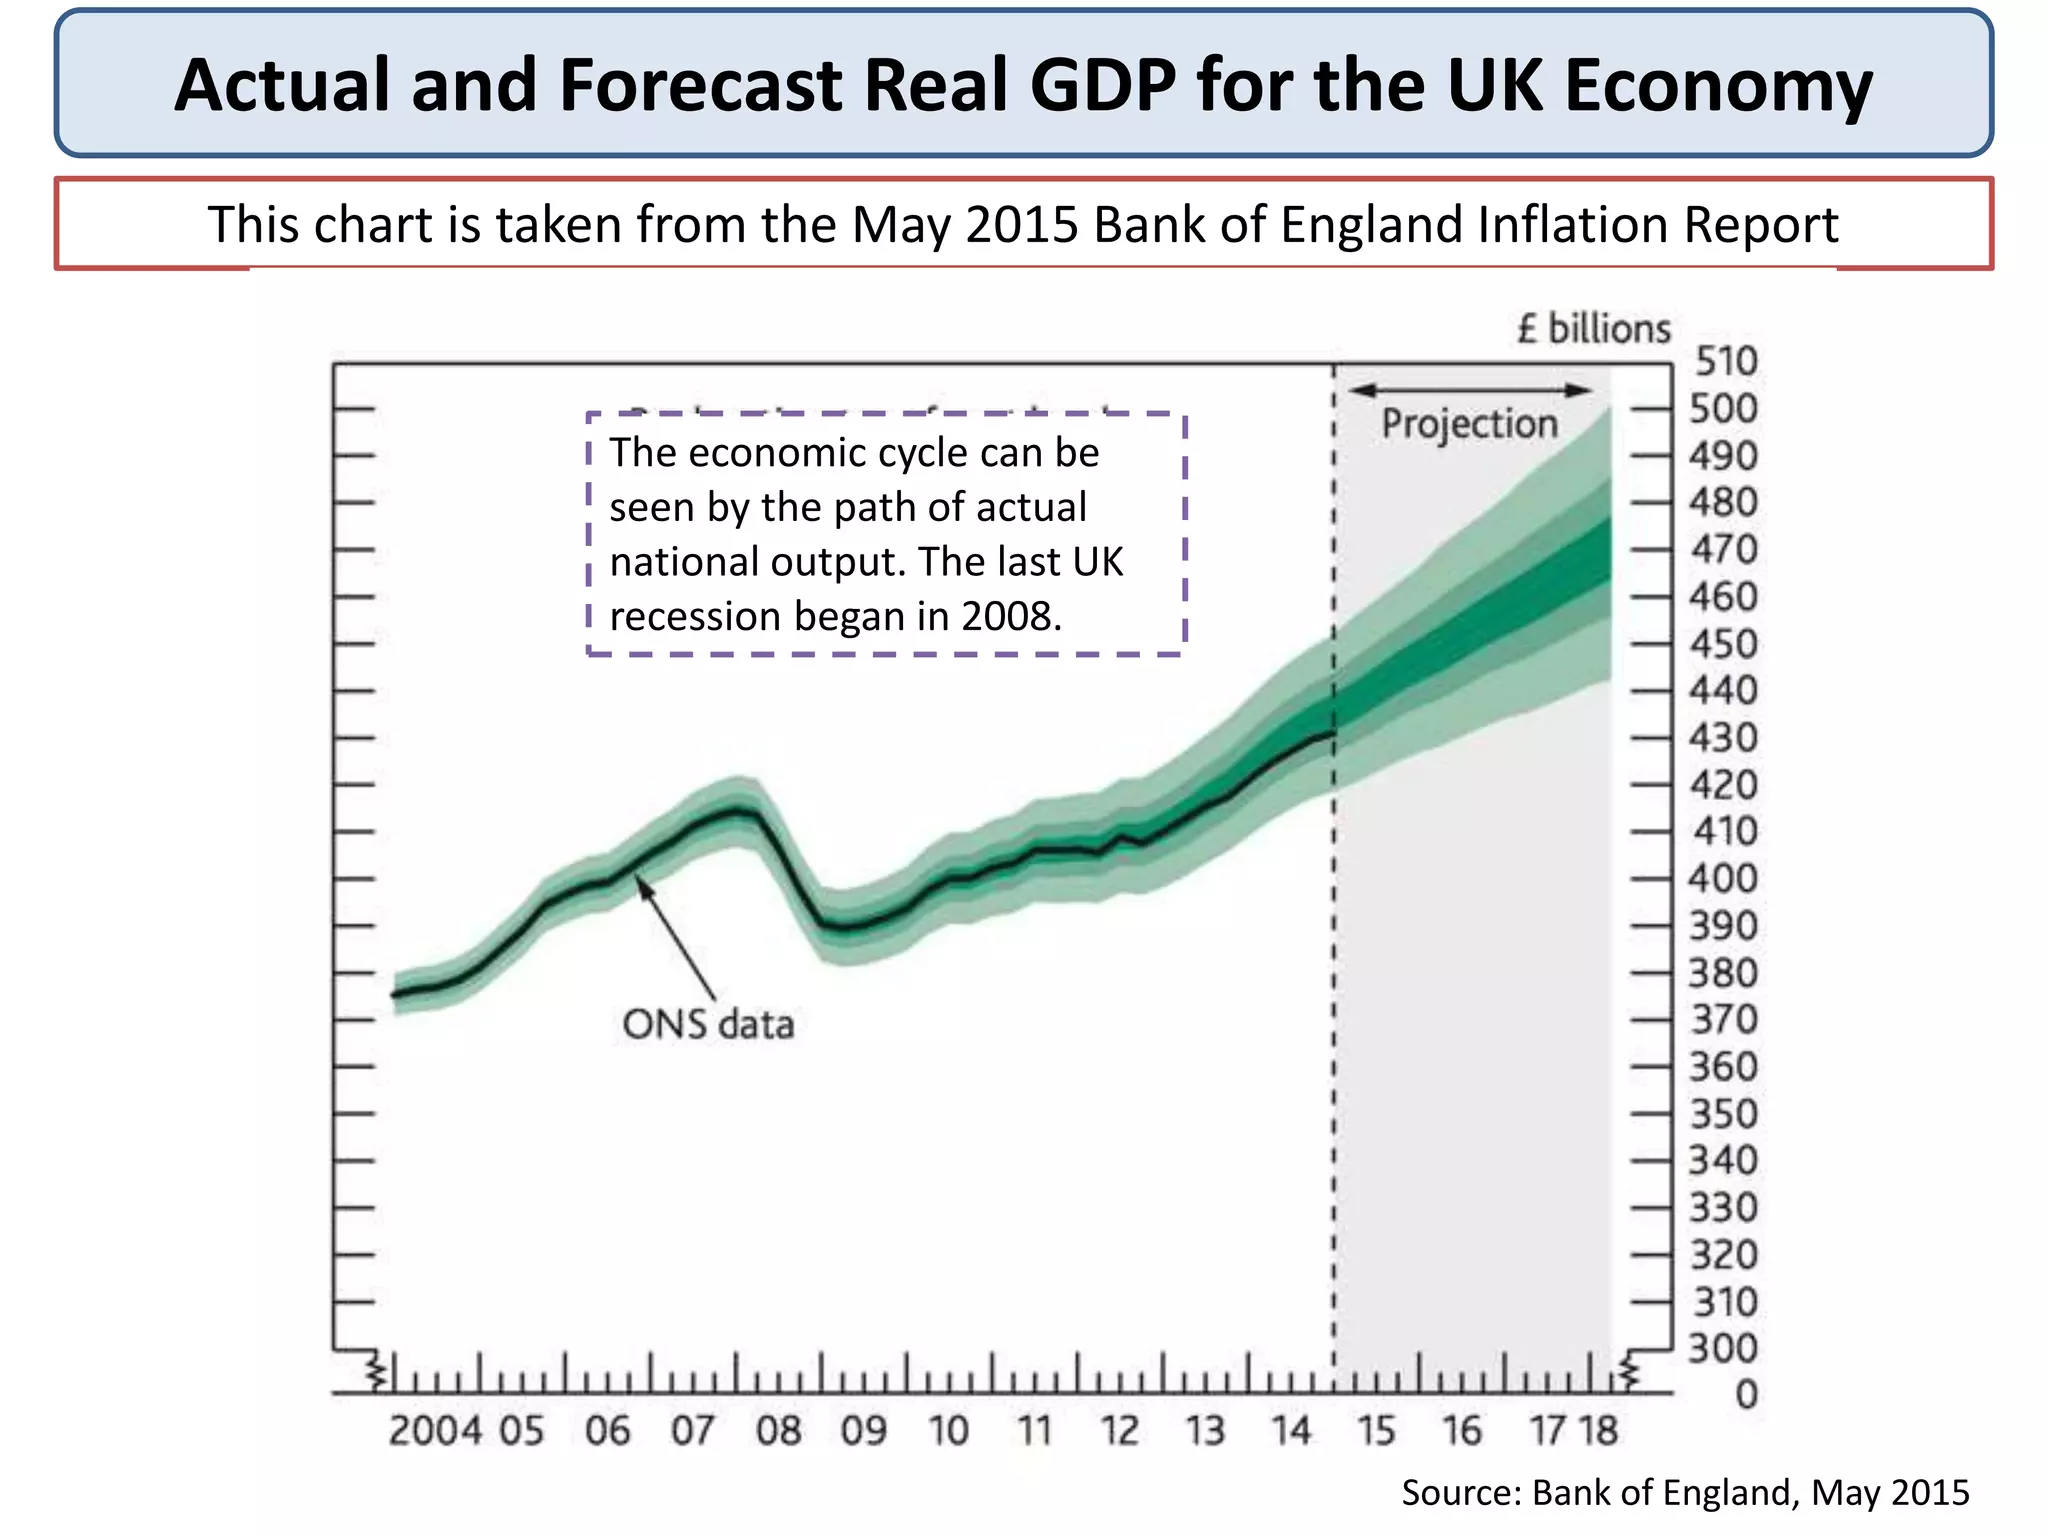
Actual and ForecastReal GDP for the UK Economy
This chart is taken from the May 2015 Bank of England Inflation Report
The economic cycle can be
seen by the path of actual
national output. The last UK
recession began in 2008.
Source: Bank of England, May 2015
8.
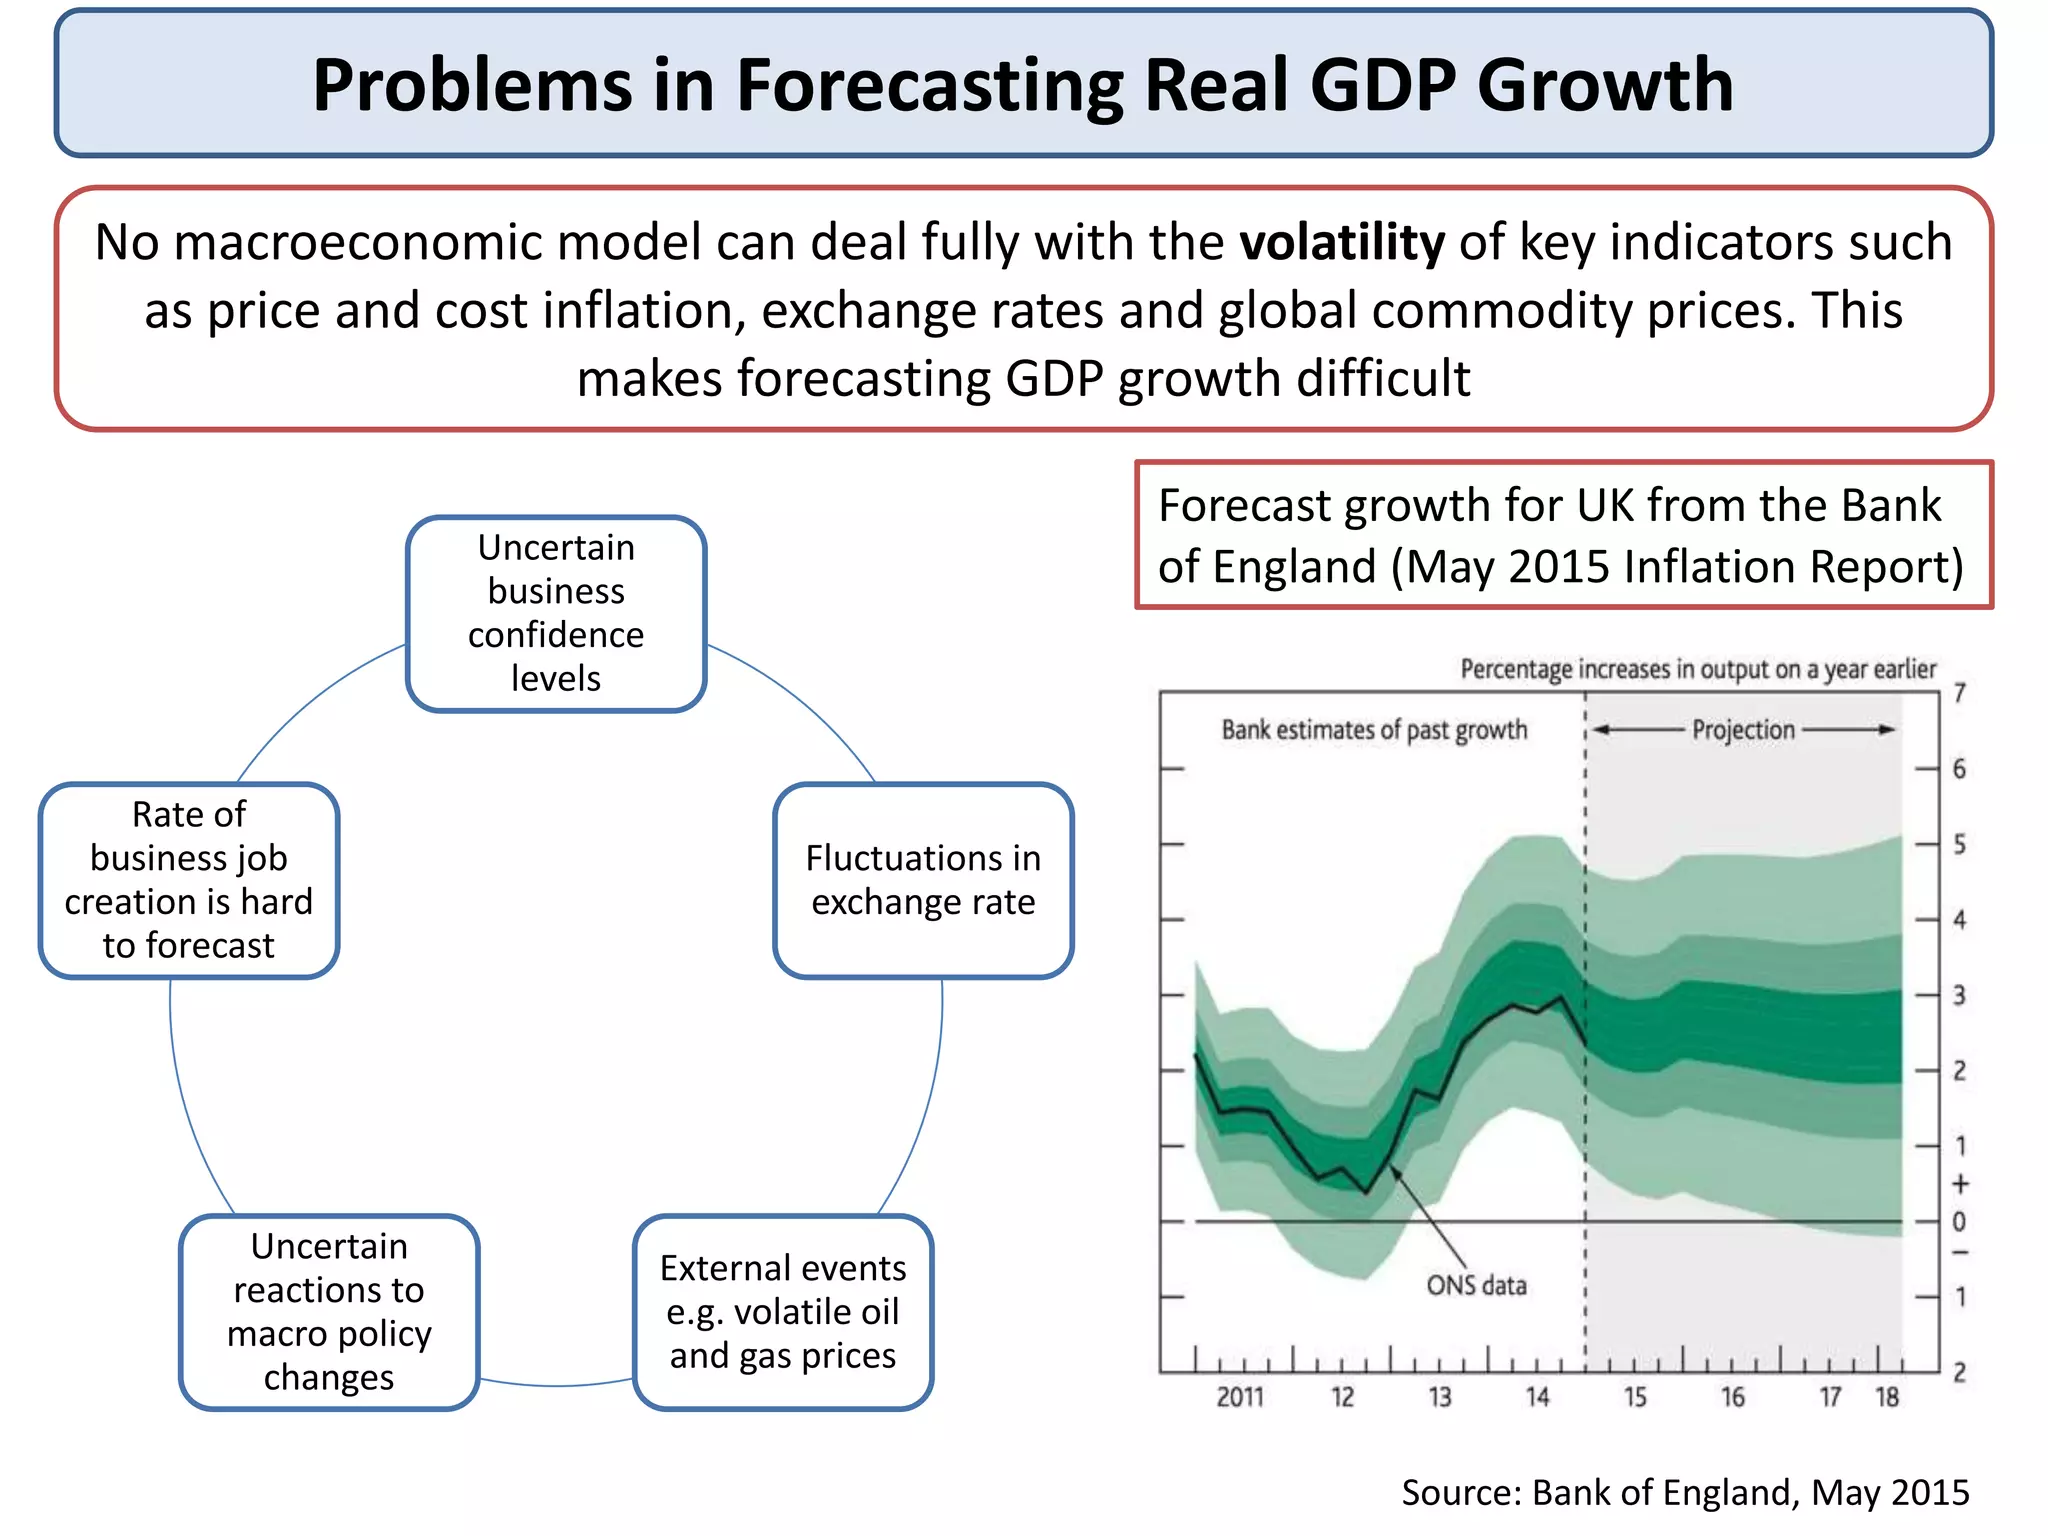
Problems in ForecastingReal GDP Growth
No macroeconomic model can deal fully with the volatility of key indicators such
as price and cost inflation, exchange rates and global commodity prices. This
makes forecasting GDP growth difficult
Uncertain
business
confidence
levels
Fluctuations in
exchange rate
External events
e.g. volatile oil
and gas prices
Uncertain
reactions to
macro policy
changes
Rate of
business job
creation is hard
to forecast
Forecast growth for UK from the Bank
of England (May 2015 Inflation Report)
Source: Bank of England, May 2015
9.
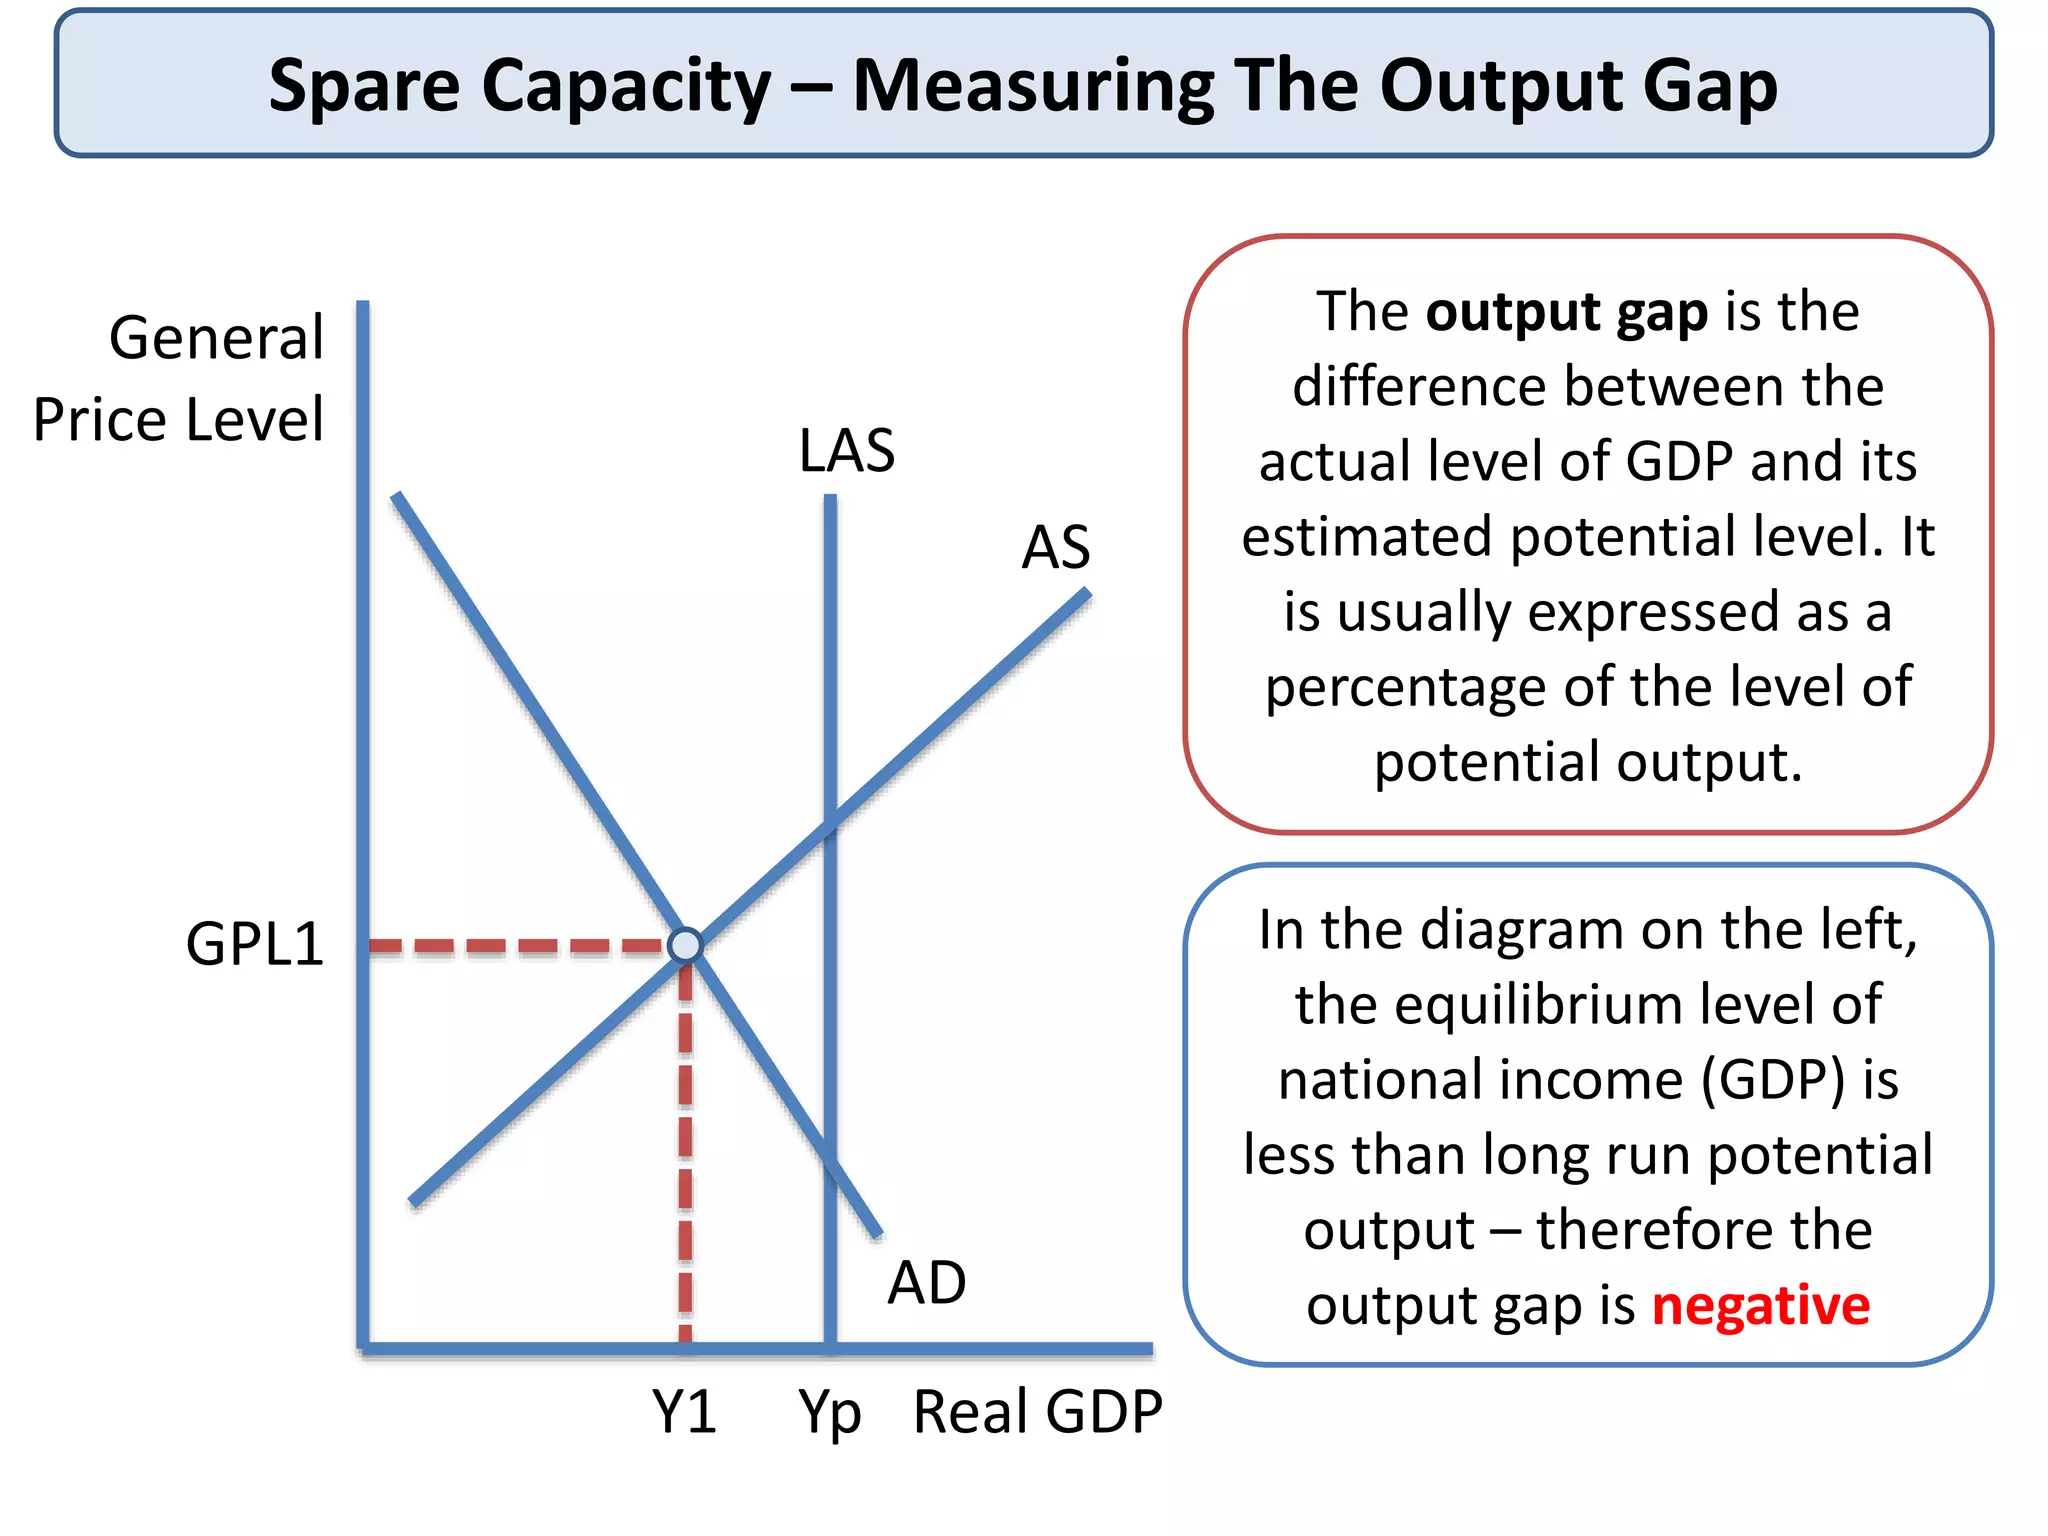
Spare Capacity –Measuring The Output Gap
The output gap is the
difference between the
actual level of GDP and its
estimated potential level. It
is usually expressed as a
percentage of the level of
potential output.
General
Price Level
Real GDP
GPL1
AS
Y1
AD
Yp
LAS
In the diagram on the left,
the equilibrium level of
national income (GDP) is
less than long run potential
output – therefore the
output gap is negative
10.
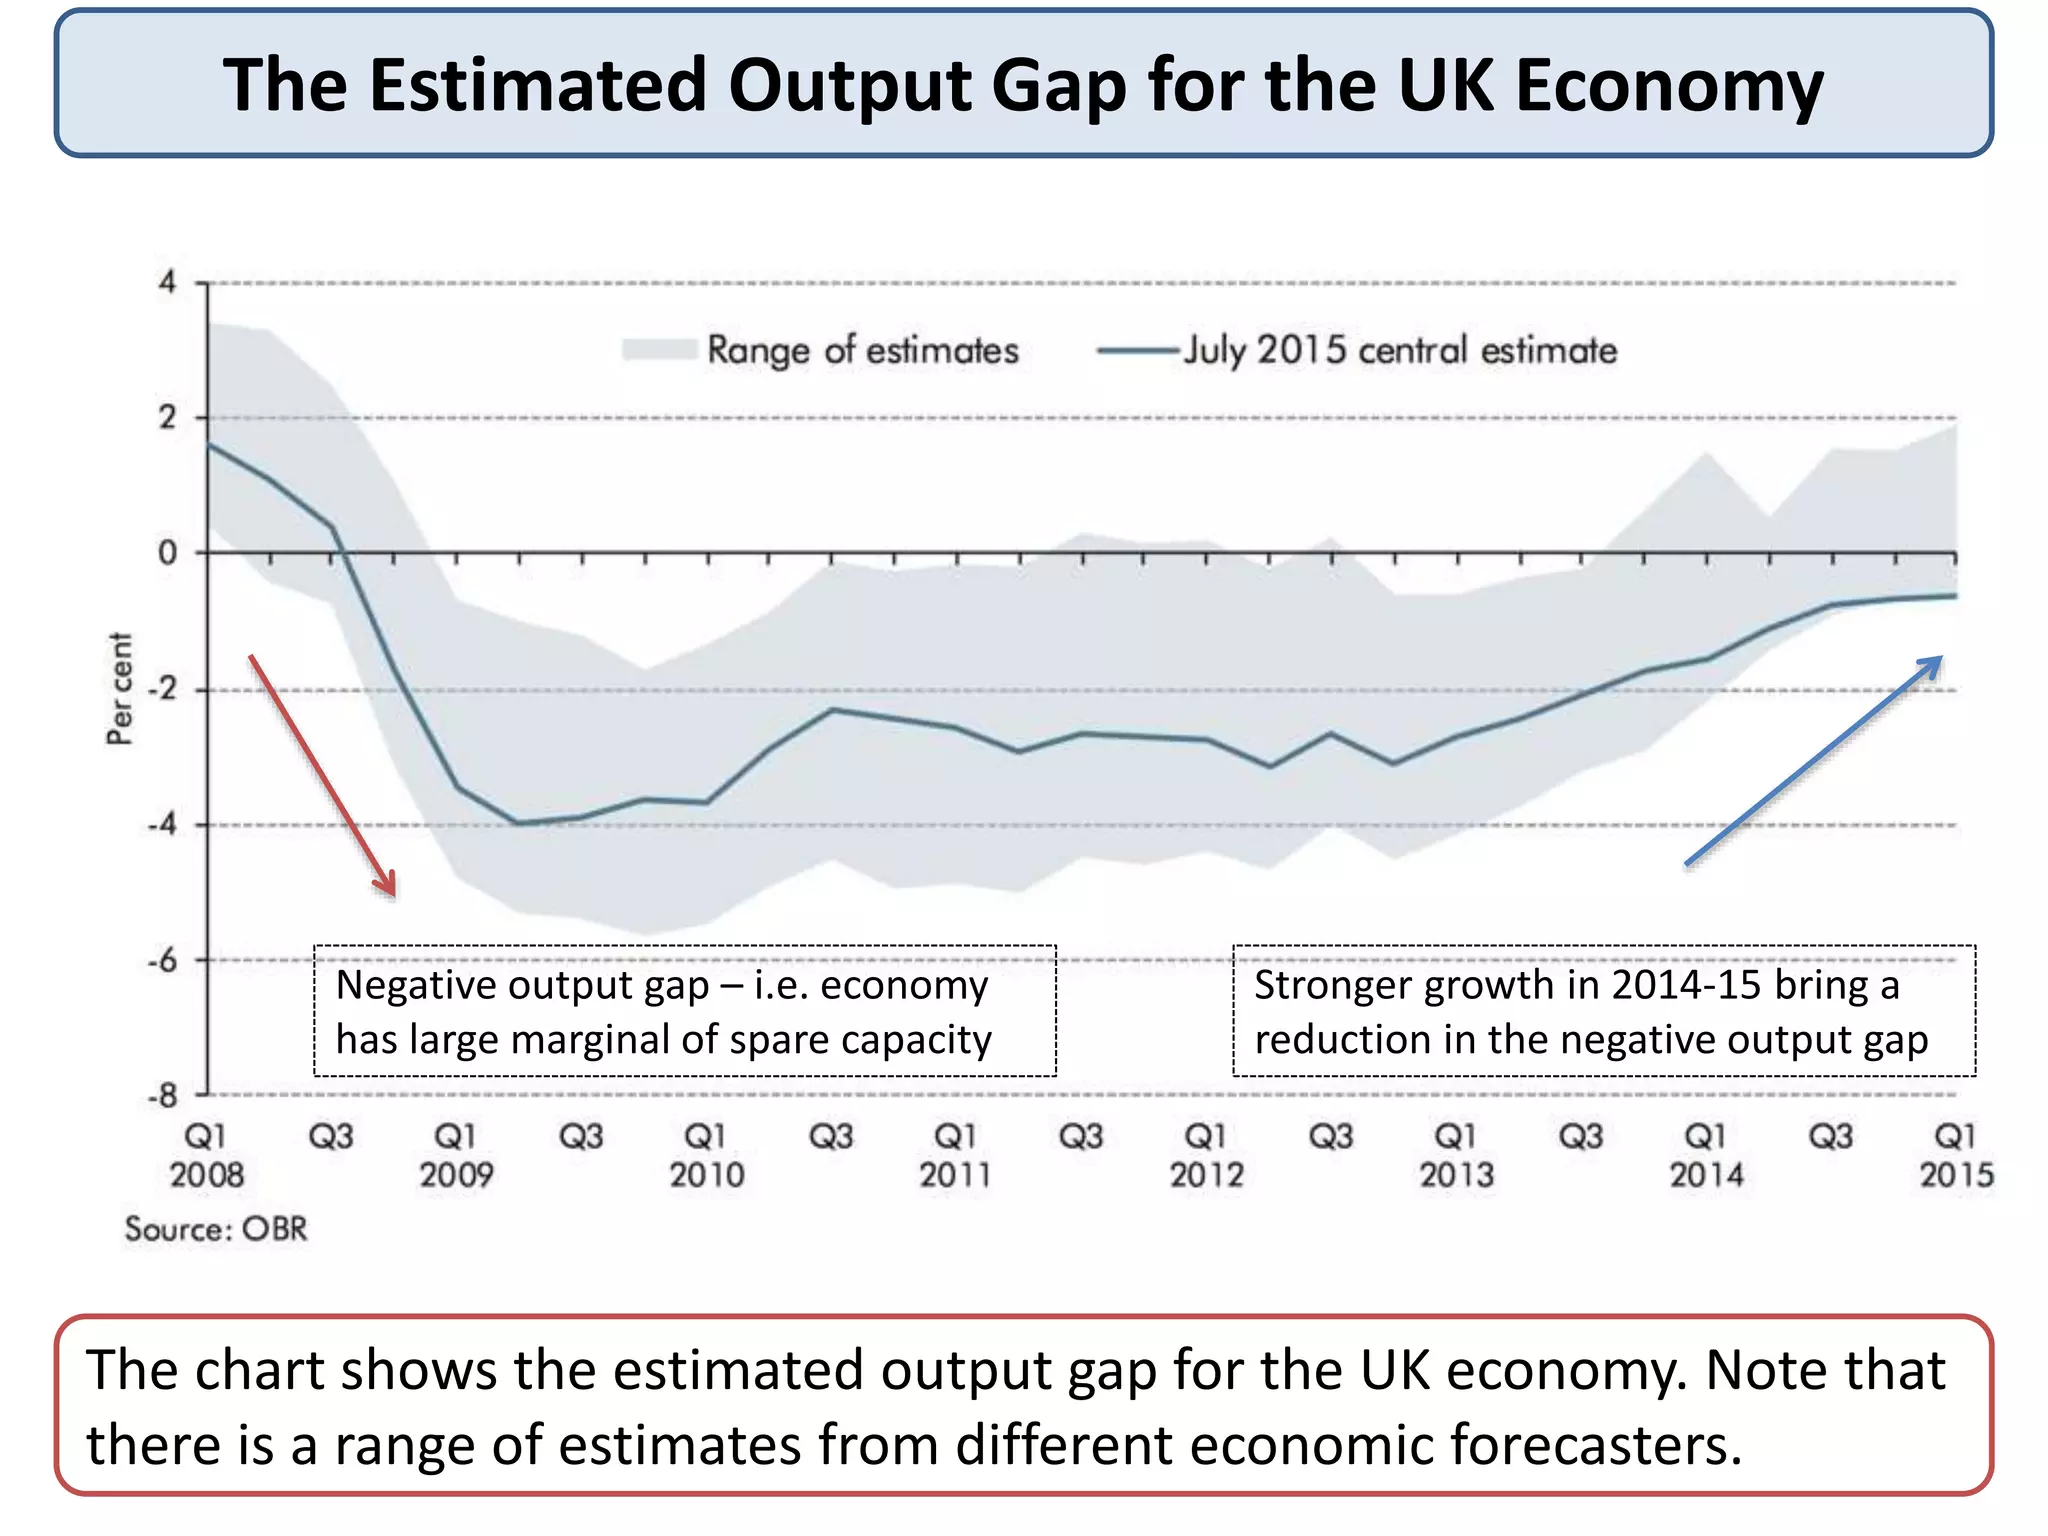
The Estimated OutputGap for the UK Economy
The chart shows the estimated output gap for the UK economy. Note that
there is a range of estimates from different economic forecasters.
Negative output gap – i.e. economy
has large marginal of spare capacity
Stronger growth in 2014-15 bring a
reduction in the negative output gap
11.
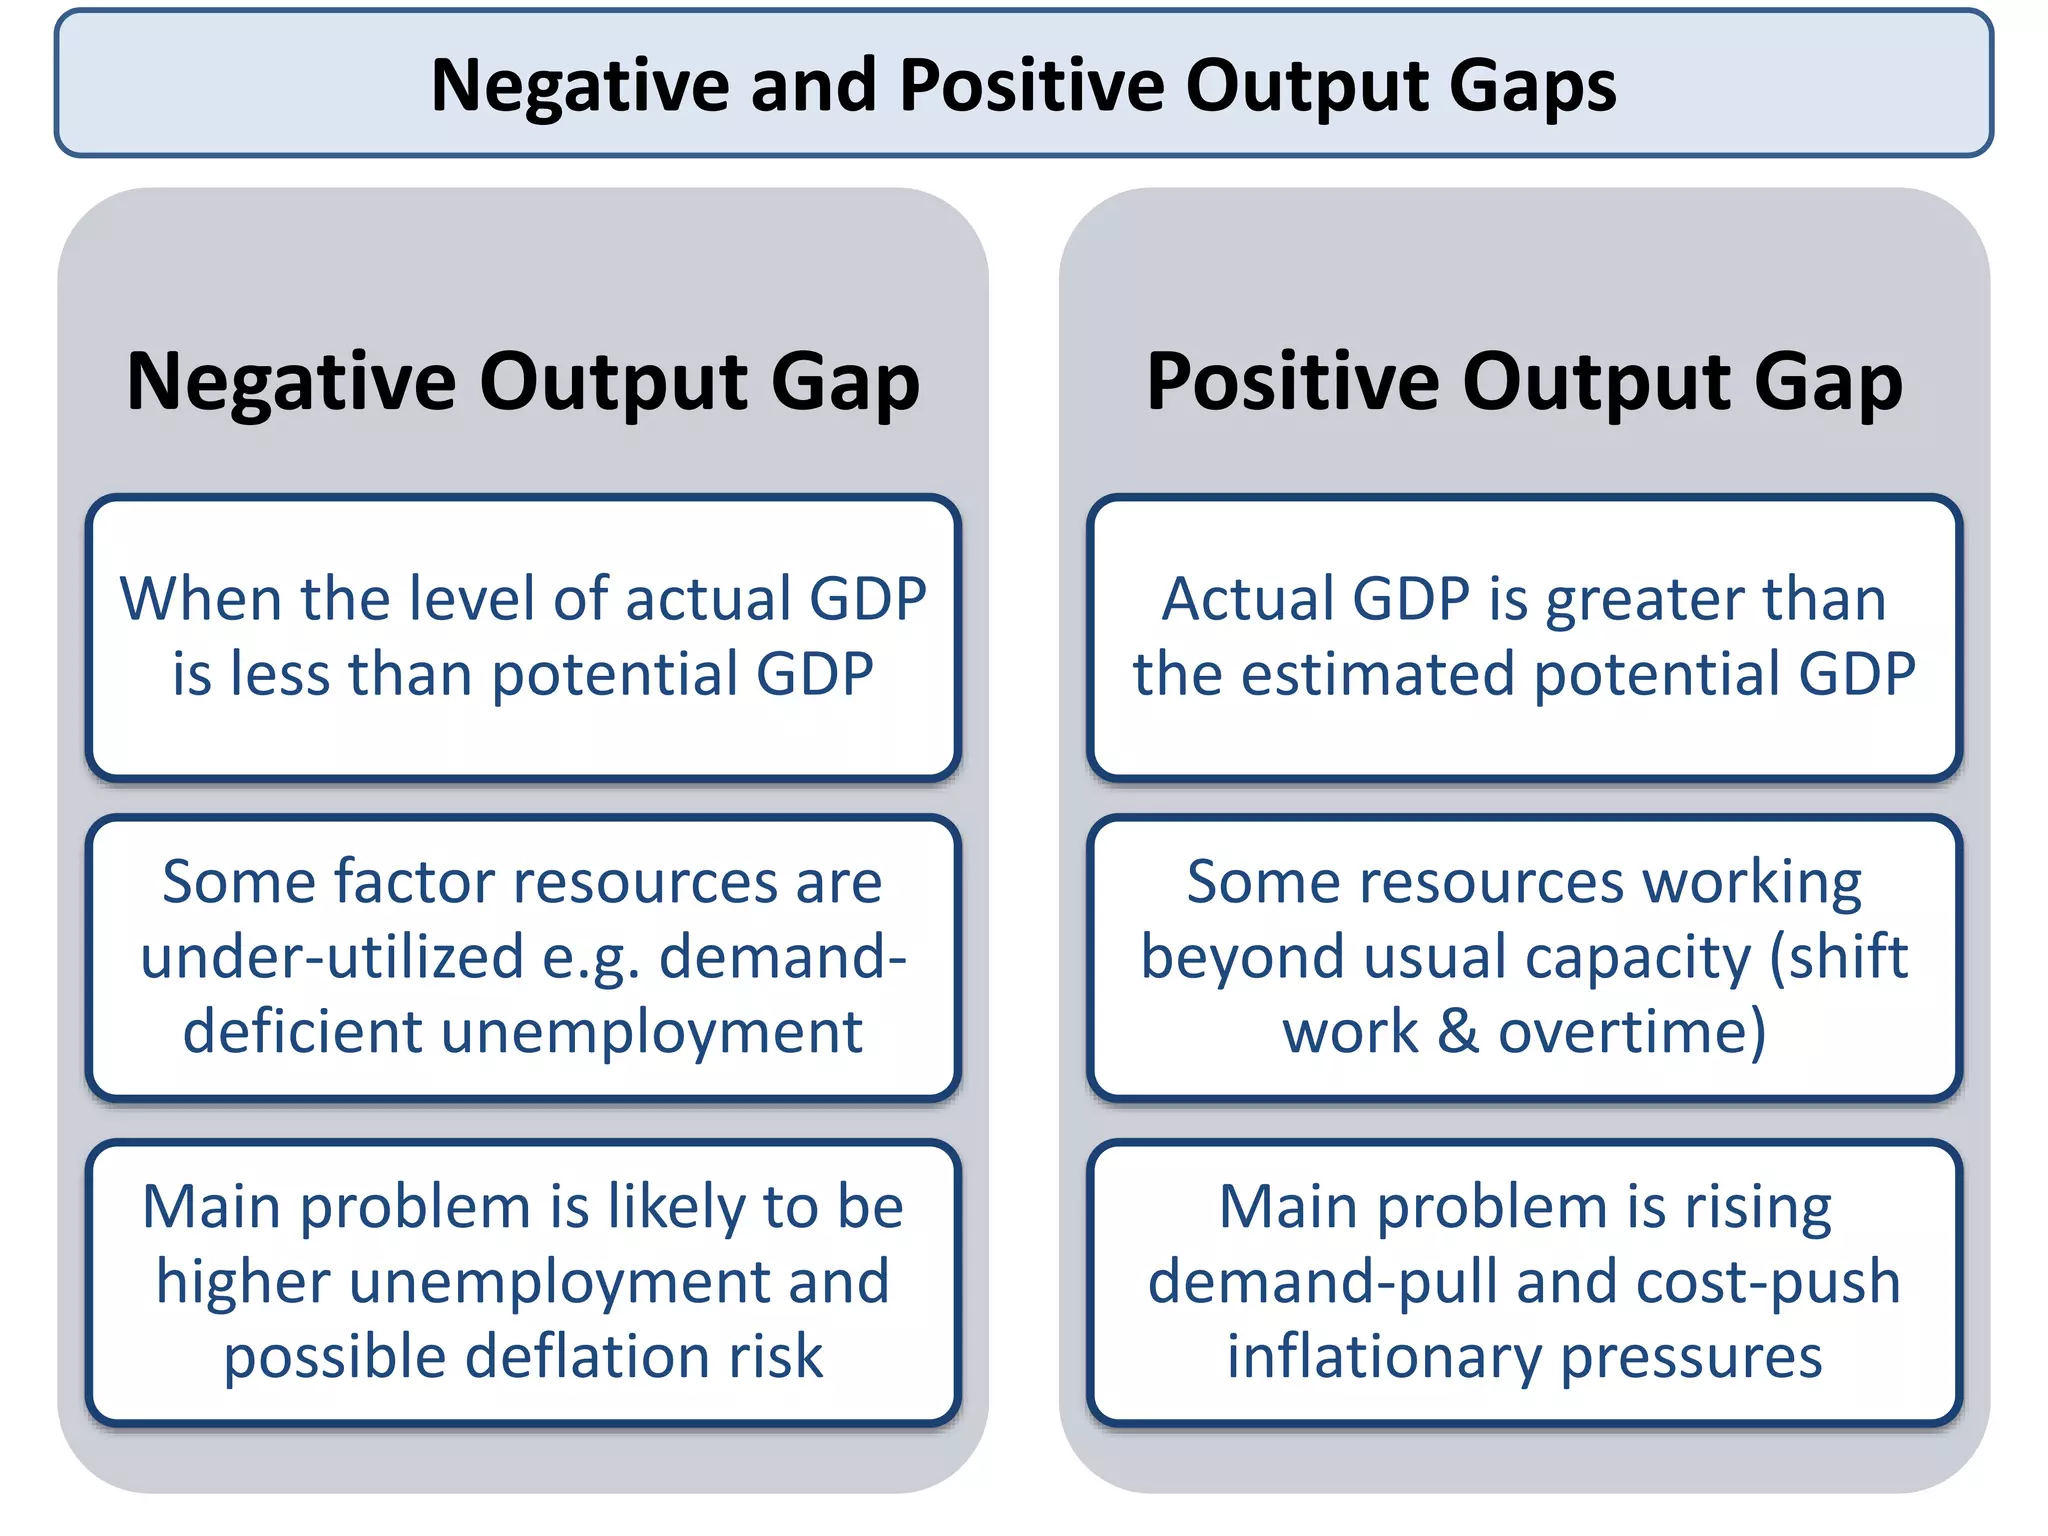
Negative and PositiveOutput Gaps
Negative Output Gap
When the level of actual GDP
is less than potential GDP
Some factor resources are
under-utilized e.g. demand-
deficient unemployment
Main problem is likely to be
higher unemployment and
possible deflation risk
Positive Output Gap
Actual GDP is greater than
the estimated potential GDP
Some resources working
beyond usual capacity (shift
work & overtime)
Main problem is rising
demand-pull and cost-push
inflationary pressures
12.
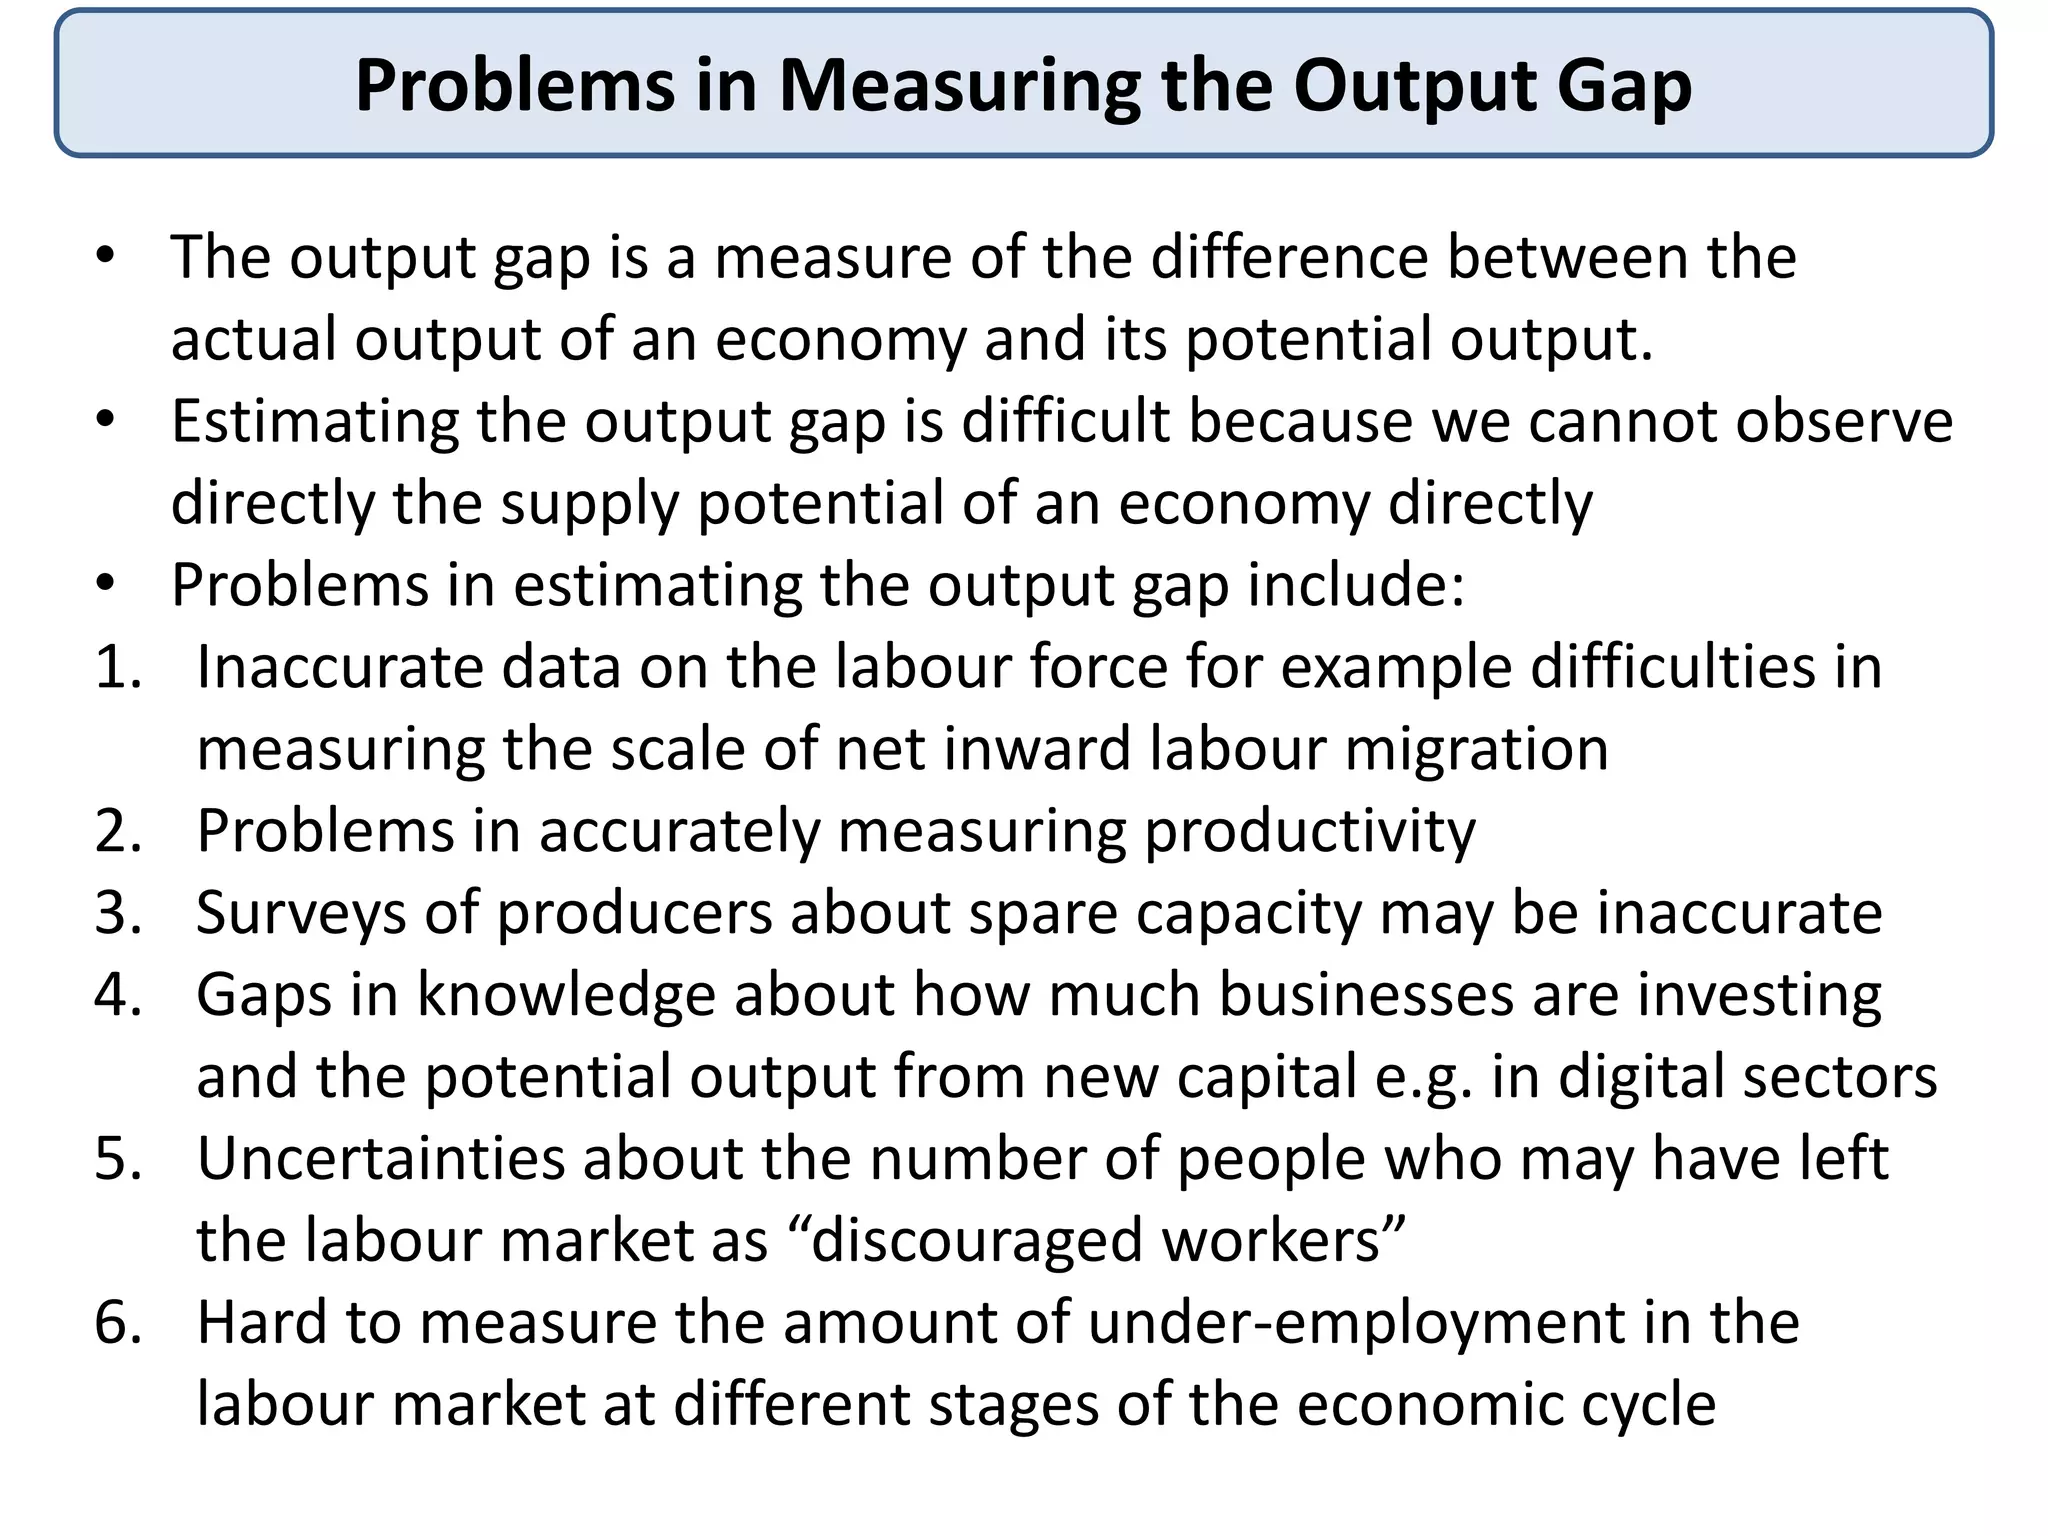
Problems in Measuringthe Output Gap
• The output gap is a measure of the difference between the
actual output of an economy and its potential output.
• Estimating the output gap is difficult because we cannot observe
directly the supply potential of an economy directly
• Problems in estimating the output gap include:
1. Inaccurate data on the labour force for example difficulties in
measuring the scale of net inward labour migration
2. Problems in accurately measuring productivity
3. Surveys of producers about spare capacity may be inaccurate
4. Gaps in knowledge about how much businesses are investing
and the potential output from new capital e.g. in digital sectors
5. Uncertainties about the number of people who may have left
the labour market as “discouraged workers”
6. Hard to measure the amount of under-employment in the
labour market at different stages of the economic cycle
13.
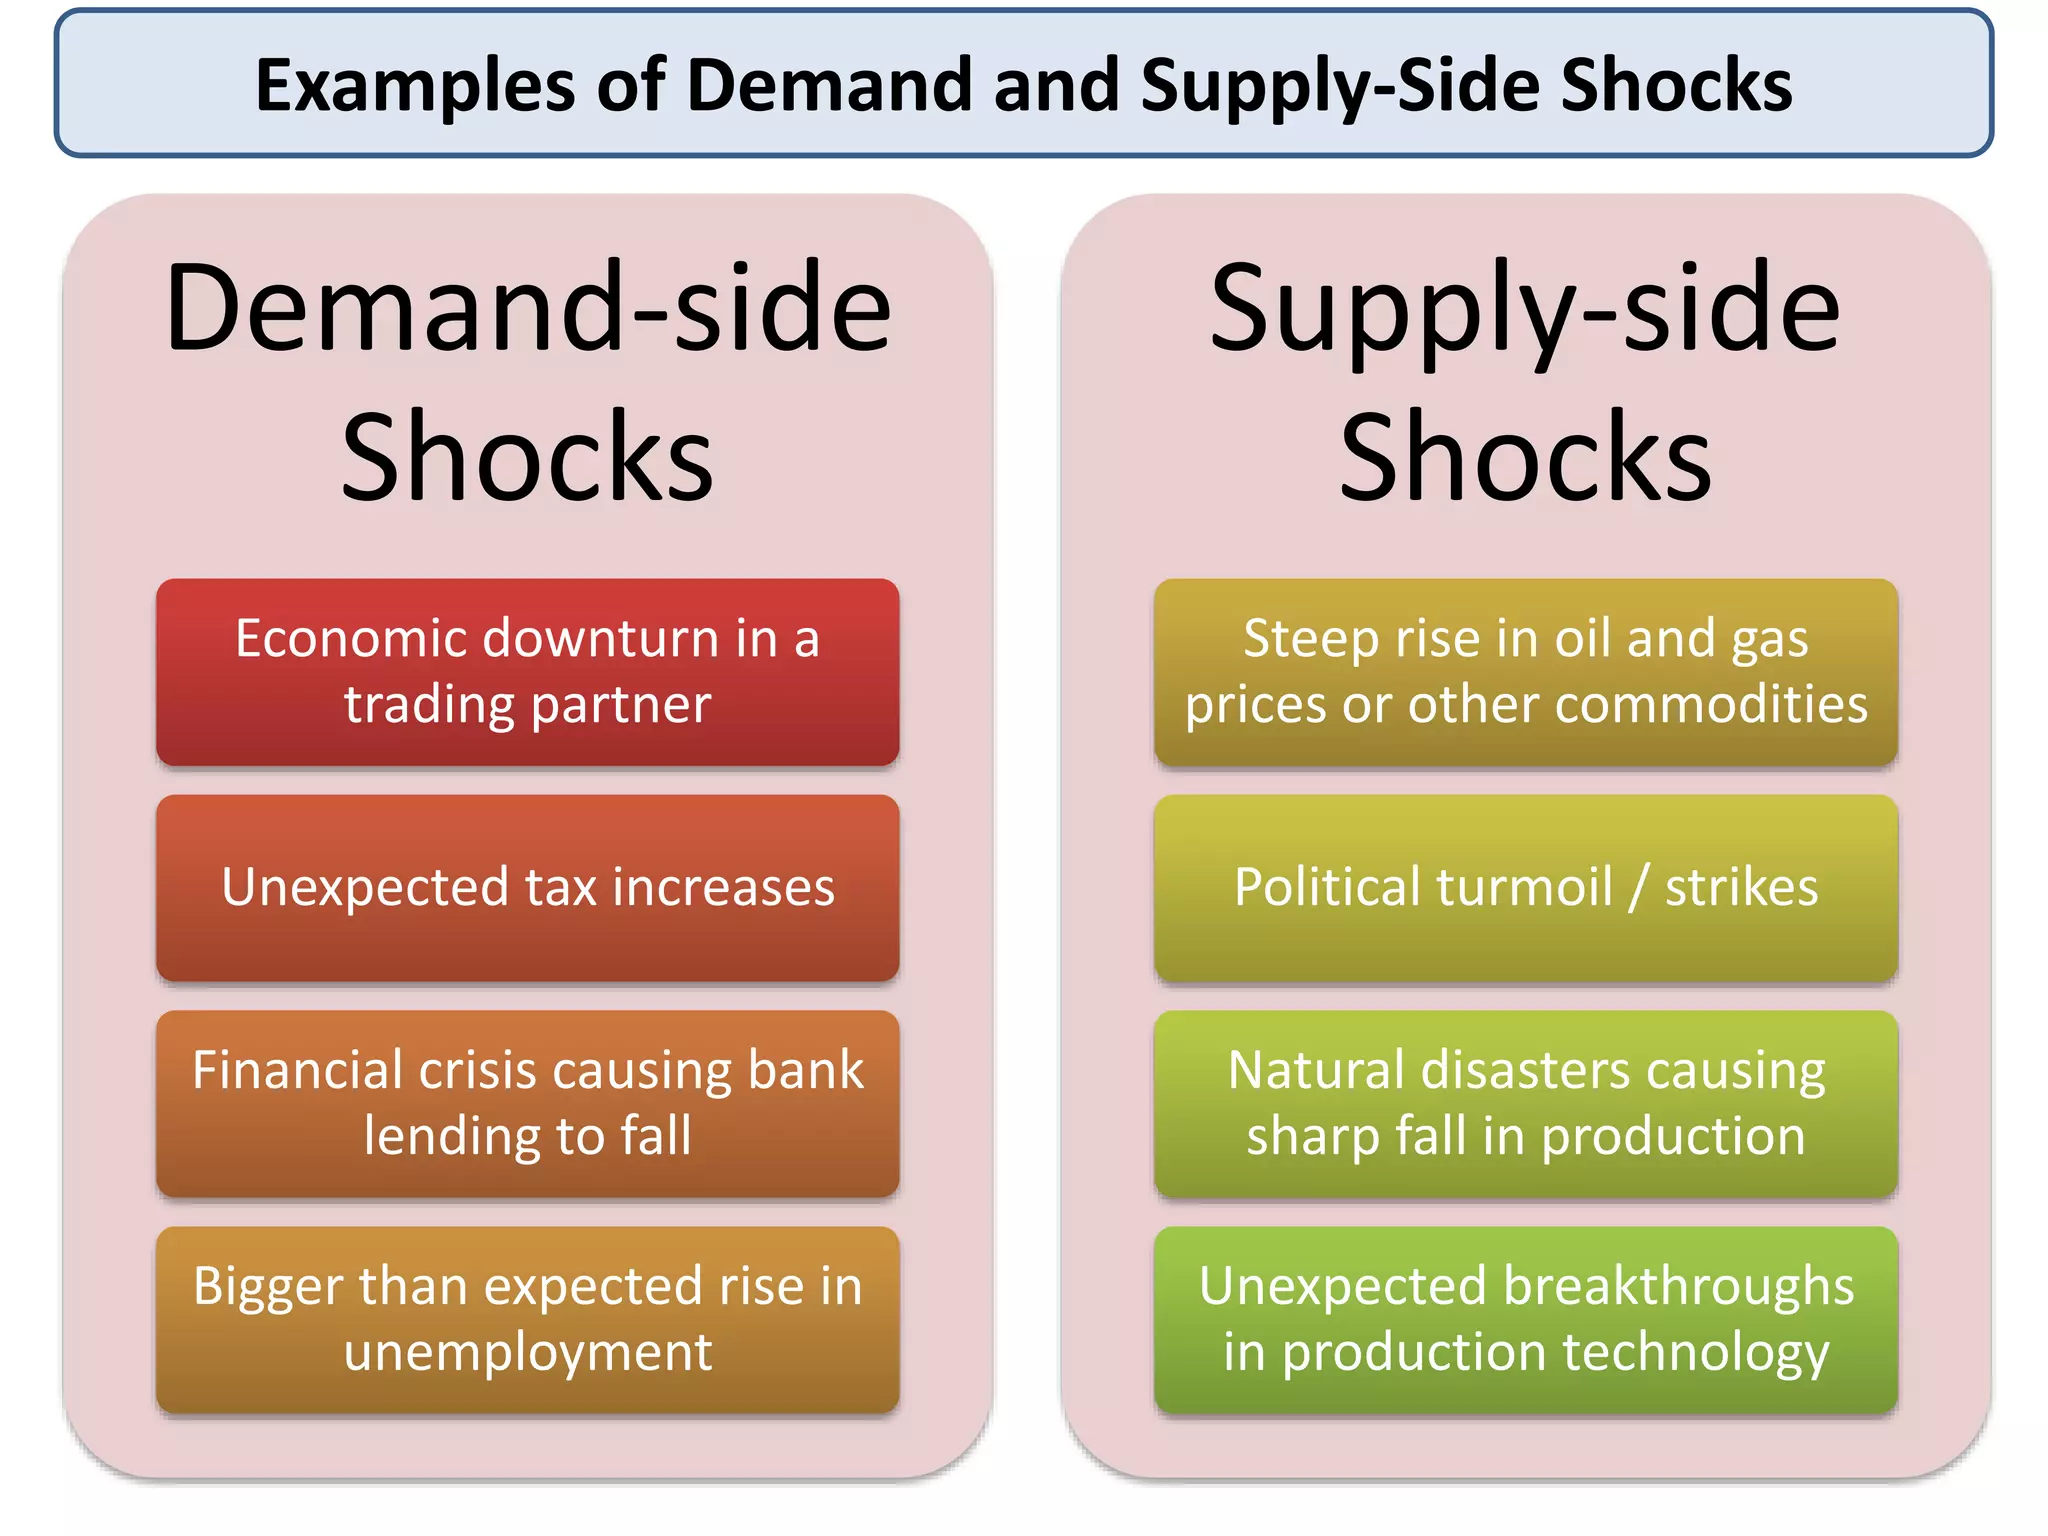
Examples of Demandand Supply-Side Shocks
Demand-side
Shocks
Economic downturn in a
trading partner
Unexpected tax increases
Financial crisis causing bank
lending to fall
Bigger than expected rise in
unemployment
Supply-side
Shocks
Steep rise in oil and gas
prices or other commodities
Political turmoil / strikes
Natural disasters causing
sharp fall in production
Unexpected breakthroughs
in production technology
14.
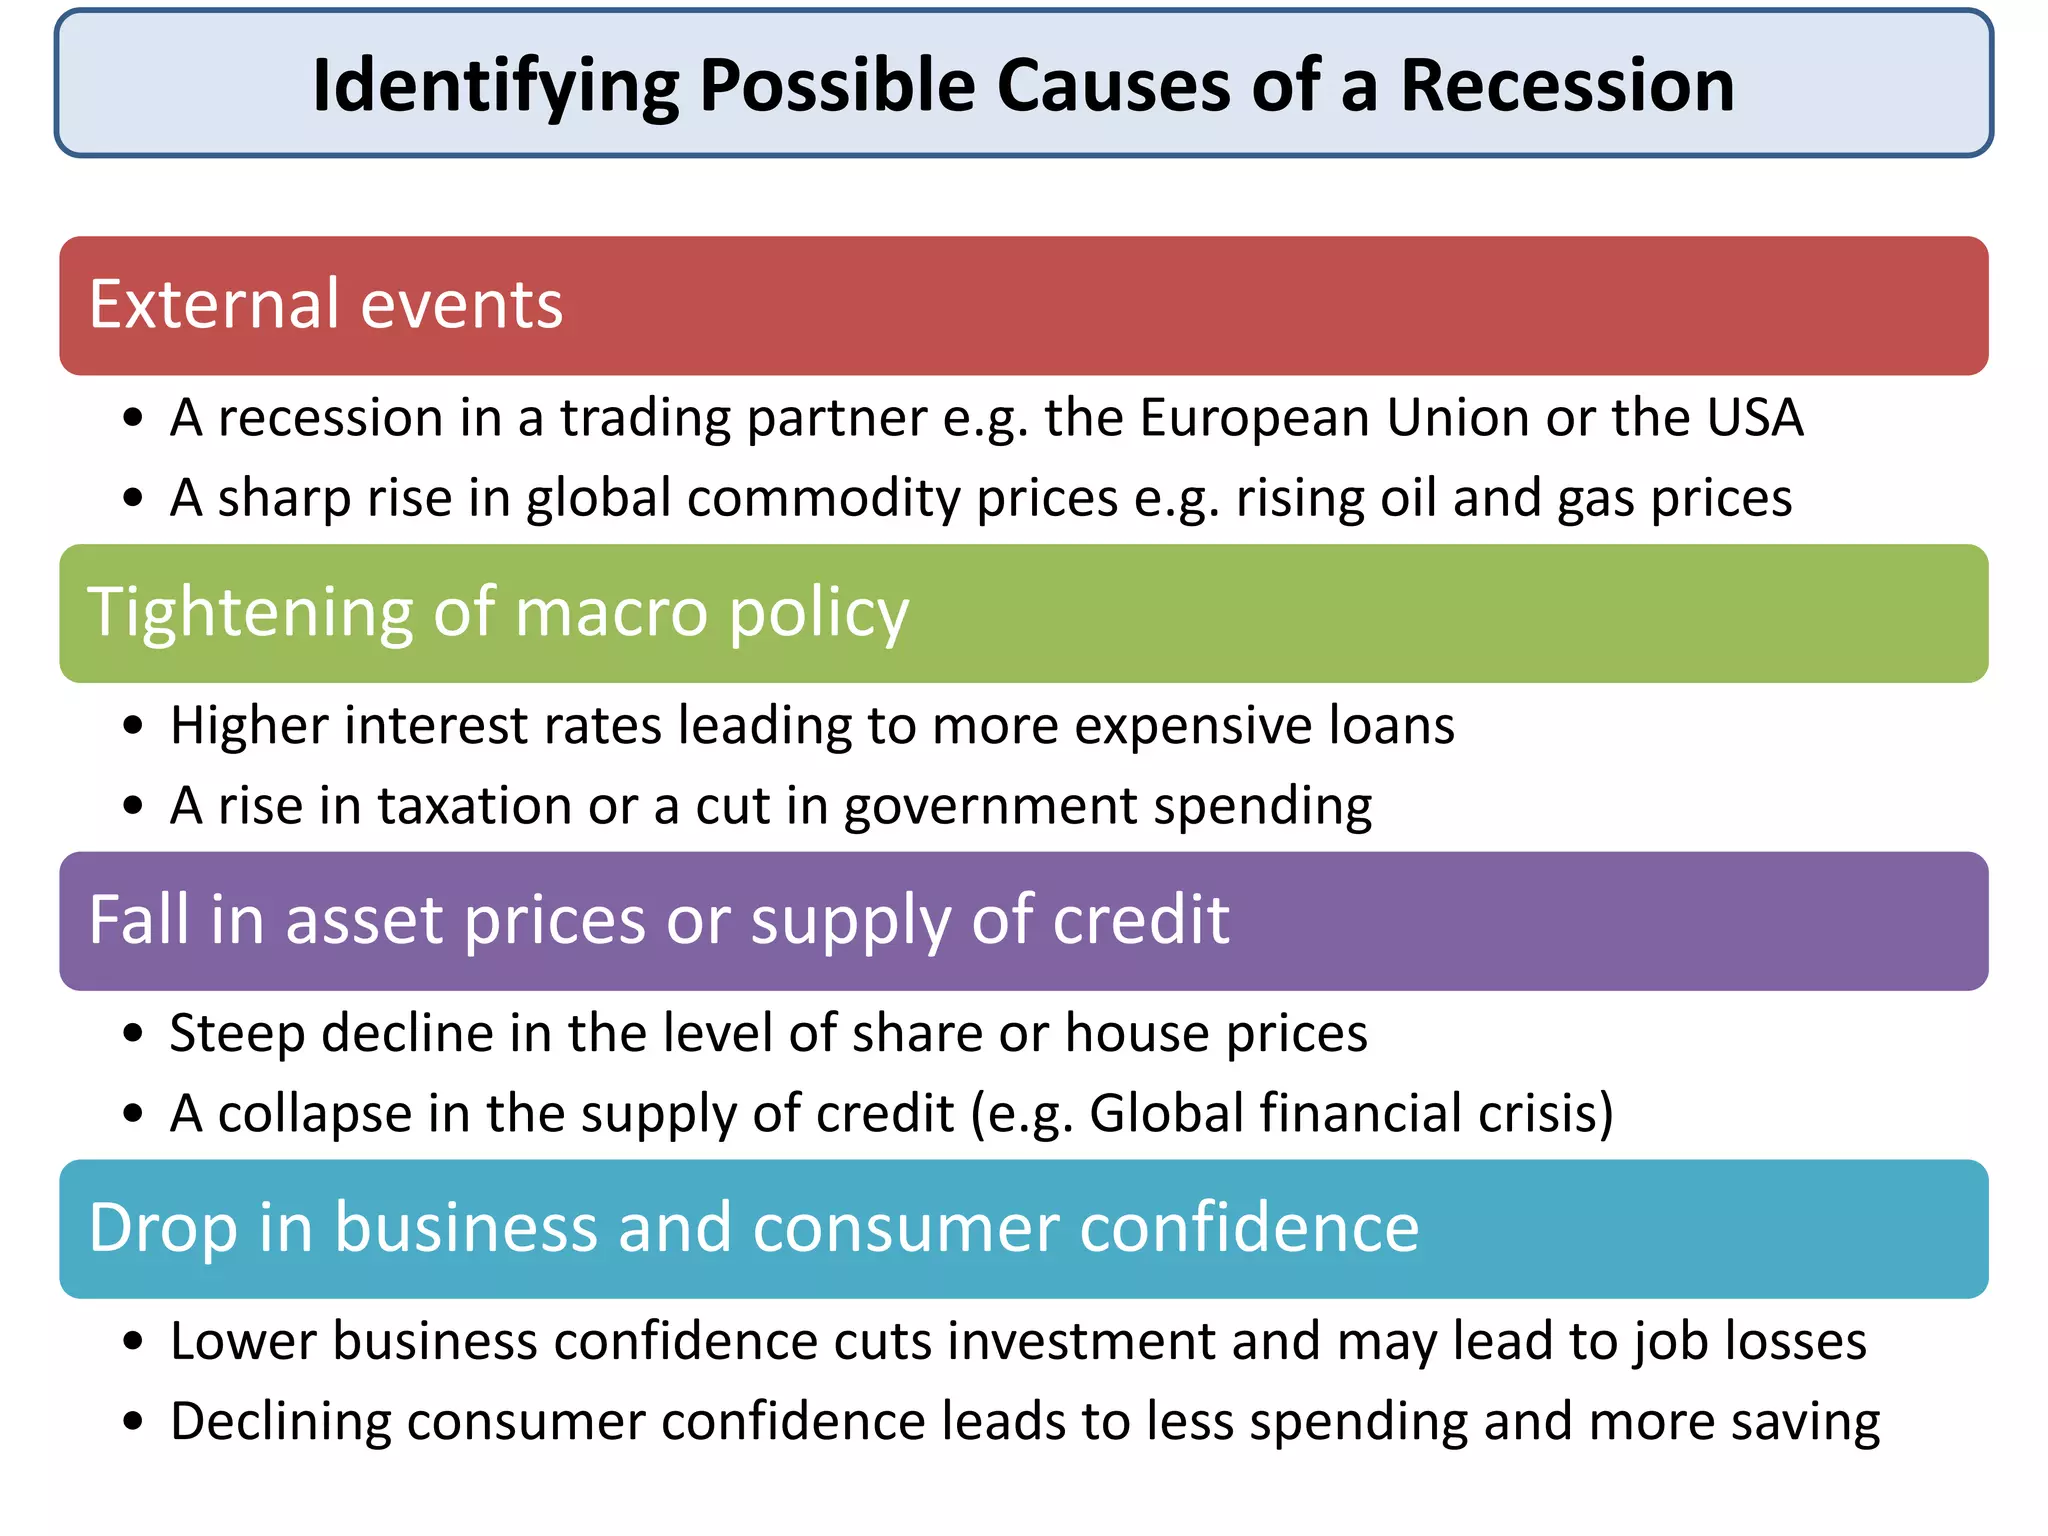
Identifying Possible Causesof a Recession
External events
• A recession in a trading partner e.g. the European Union or the USA
• A sharp rise in global commodity prices e.g. rising oil and gas prices
Tightening of macro policy
• Higher interest rates leading to more expensive loans
• A rise in taxation or a cut in government spending
Fall in asset prices or supply of credit
• Steep decline in the level of share or house prices
• A collapse in the supply of credit (e.g. Global financial crisis)
Drop in business and consumer confidence
• Lower business confidence cuts investment and may lead to job losses
• Declining consumer confidence leads to less spending and more saving
15.
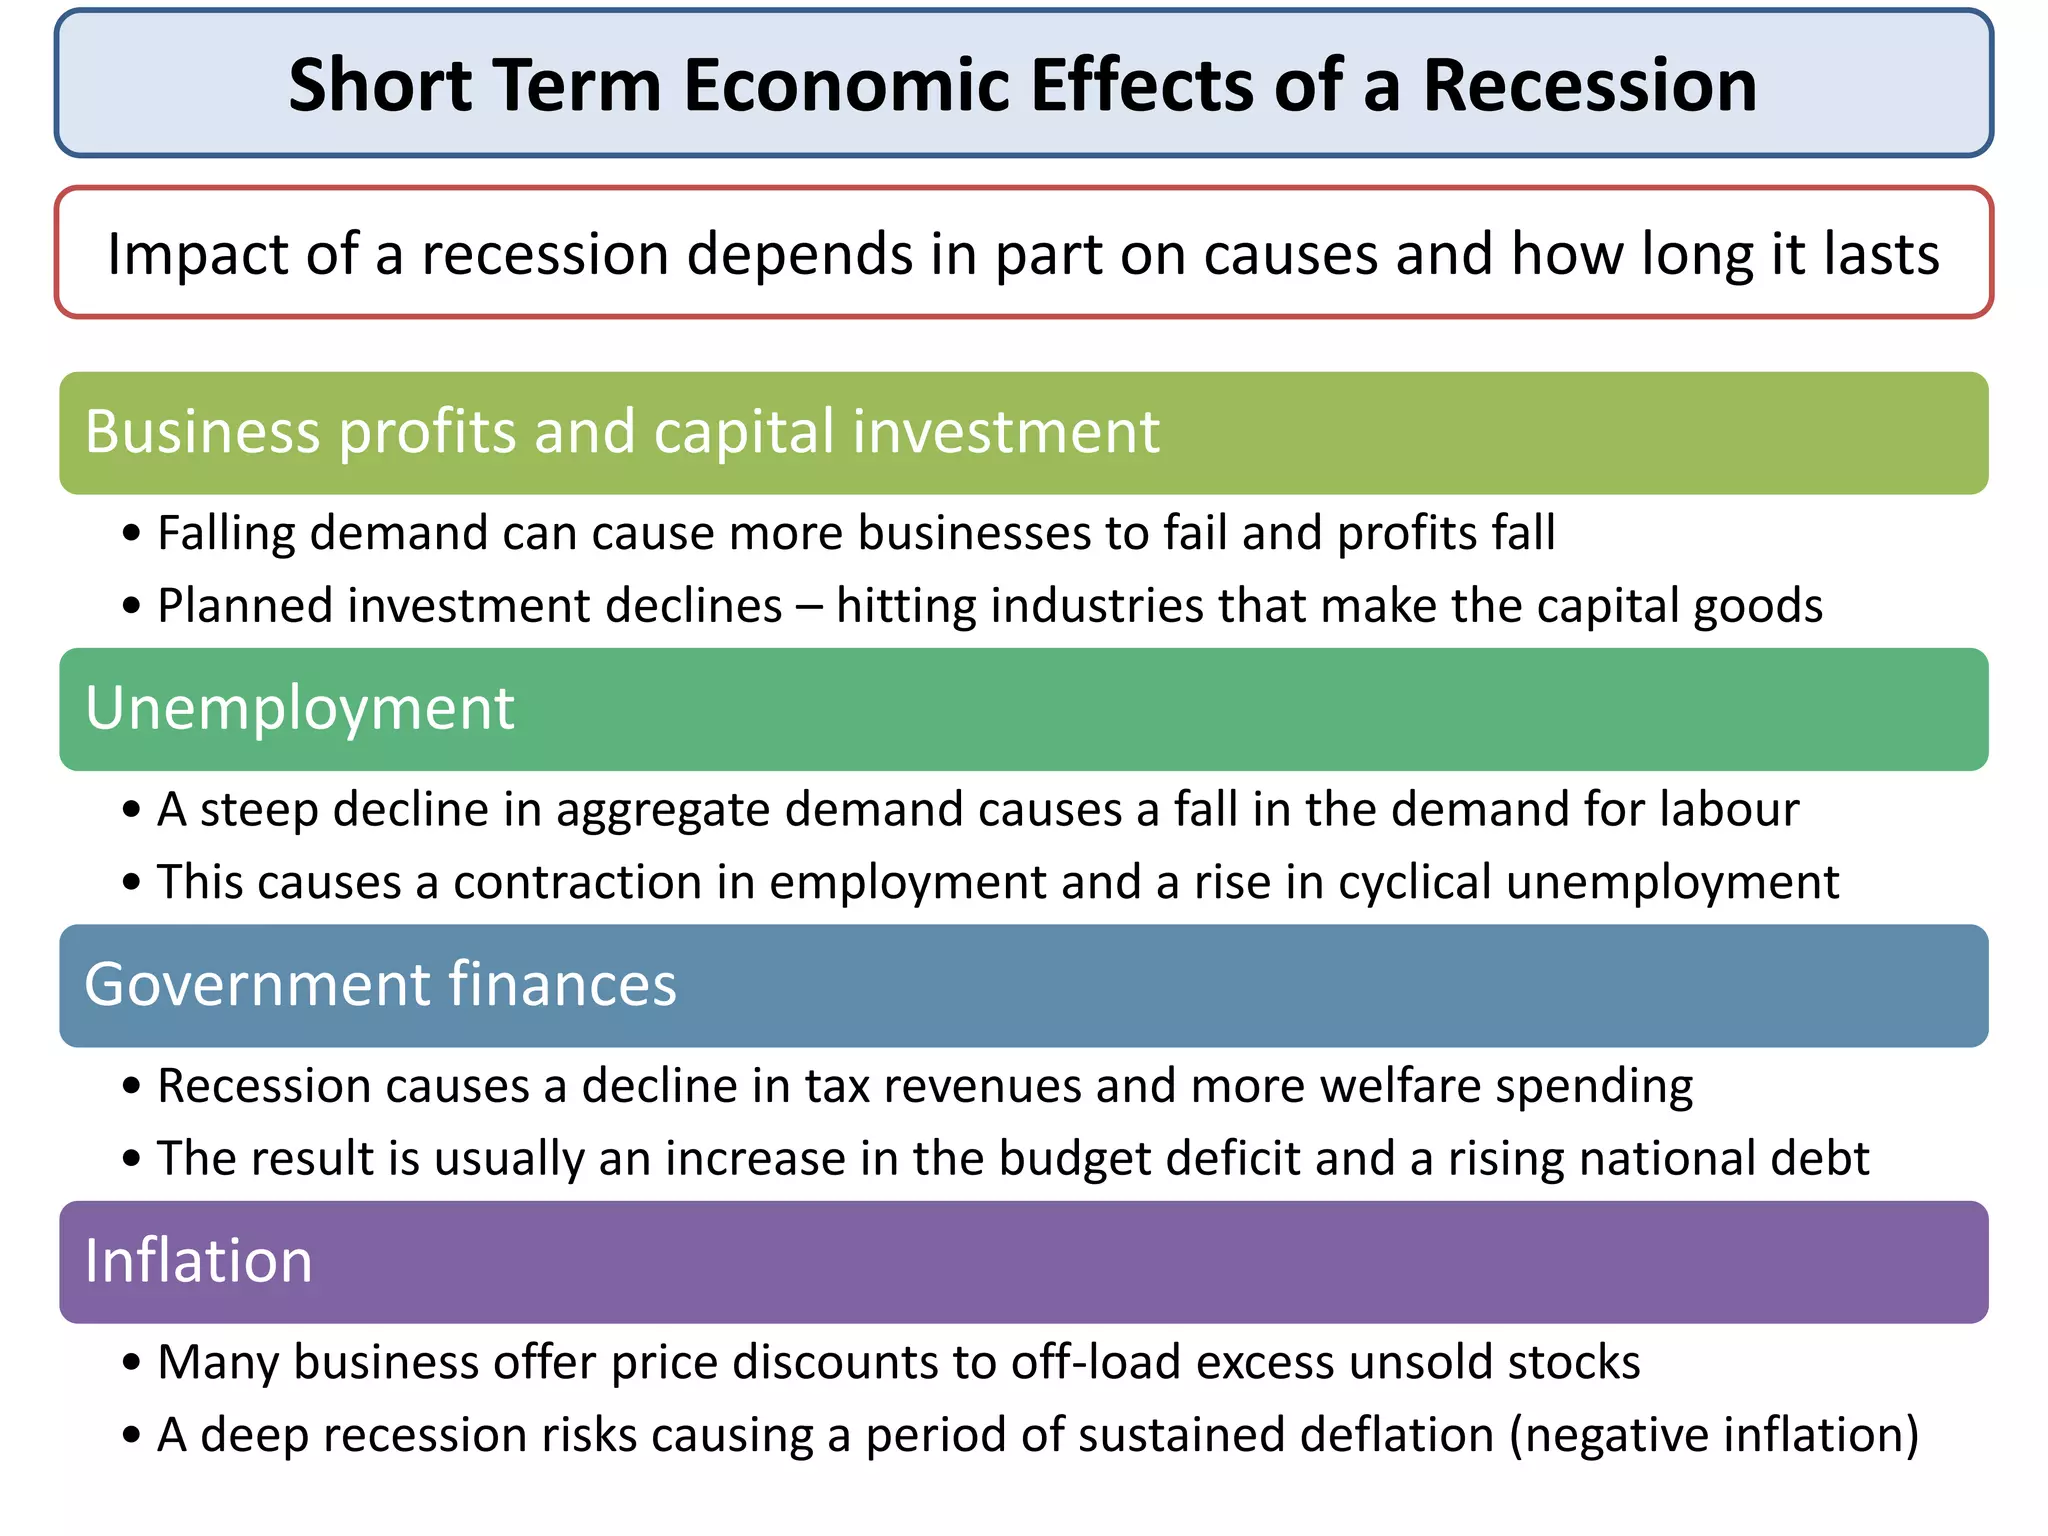
Short Term EconomicEffects of a Recession
Impact of a recession depends in part on causes and how long it lasts
Business profits and capital investment
• Falling demand can cause more businesses to fail and profits fall
• Planned investment declines – hitting industries that make the capital goods
Unemployment
• A steep decline in aggregate demand causes a fall in the demand for labour
• This causes a contraction in employment and a rise in cyclical unemployment
Government finances
• Recession causes a decline in tax revenues and more welfare spending
• The result is usually an increase in the budget deficit and a rising national debt
Inflation
• Many business offer price discounts to off-load excess unsold stocks
• A deep recession risks causing a period of sustained deflation (negative inflation)
16.
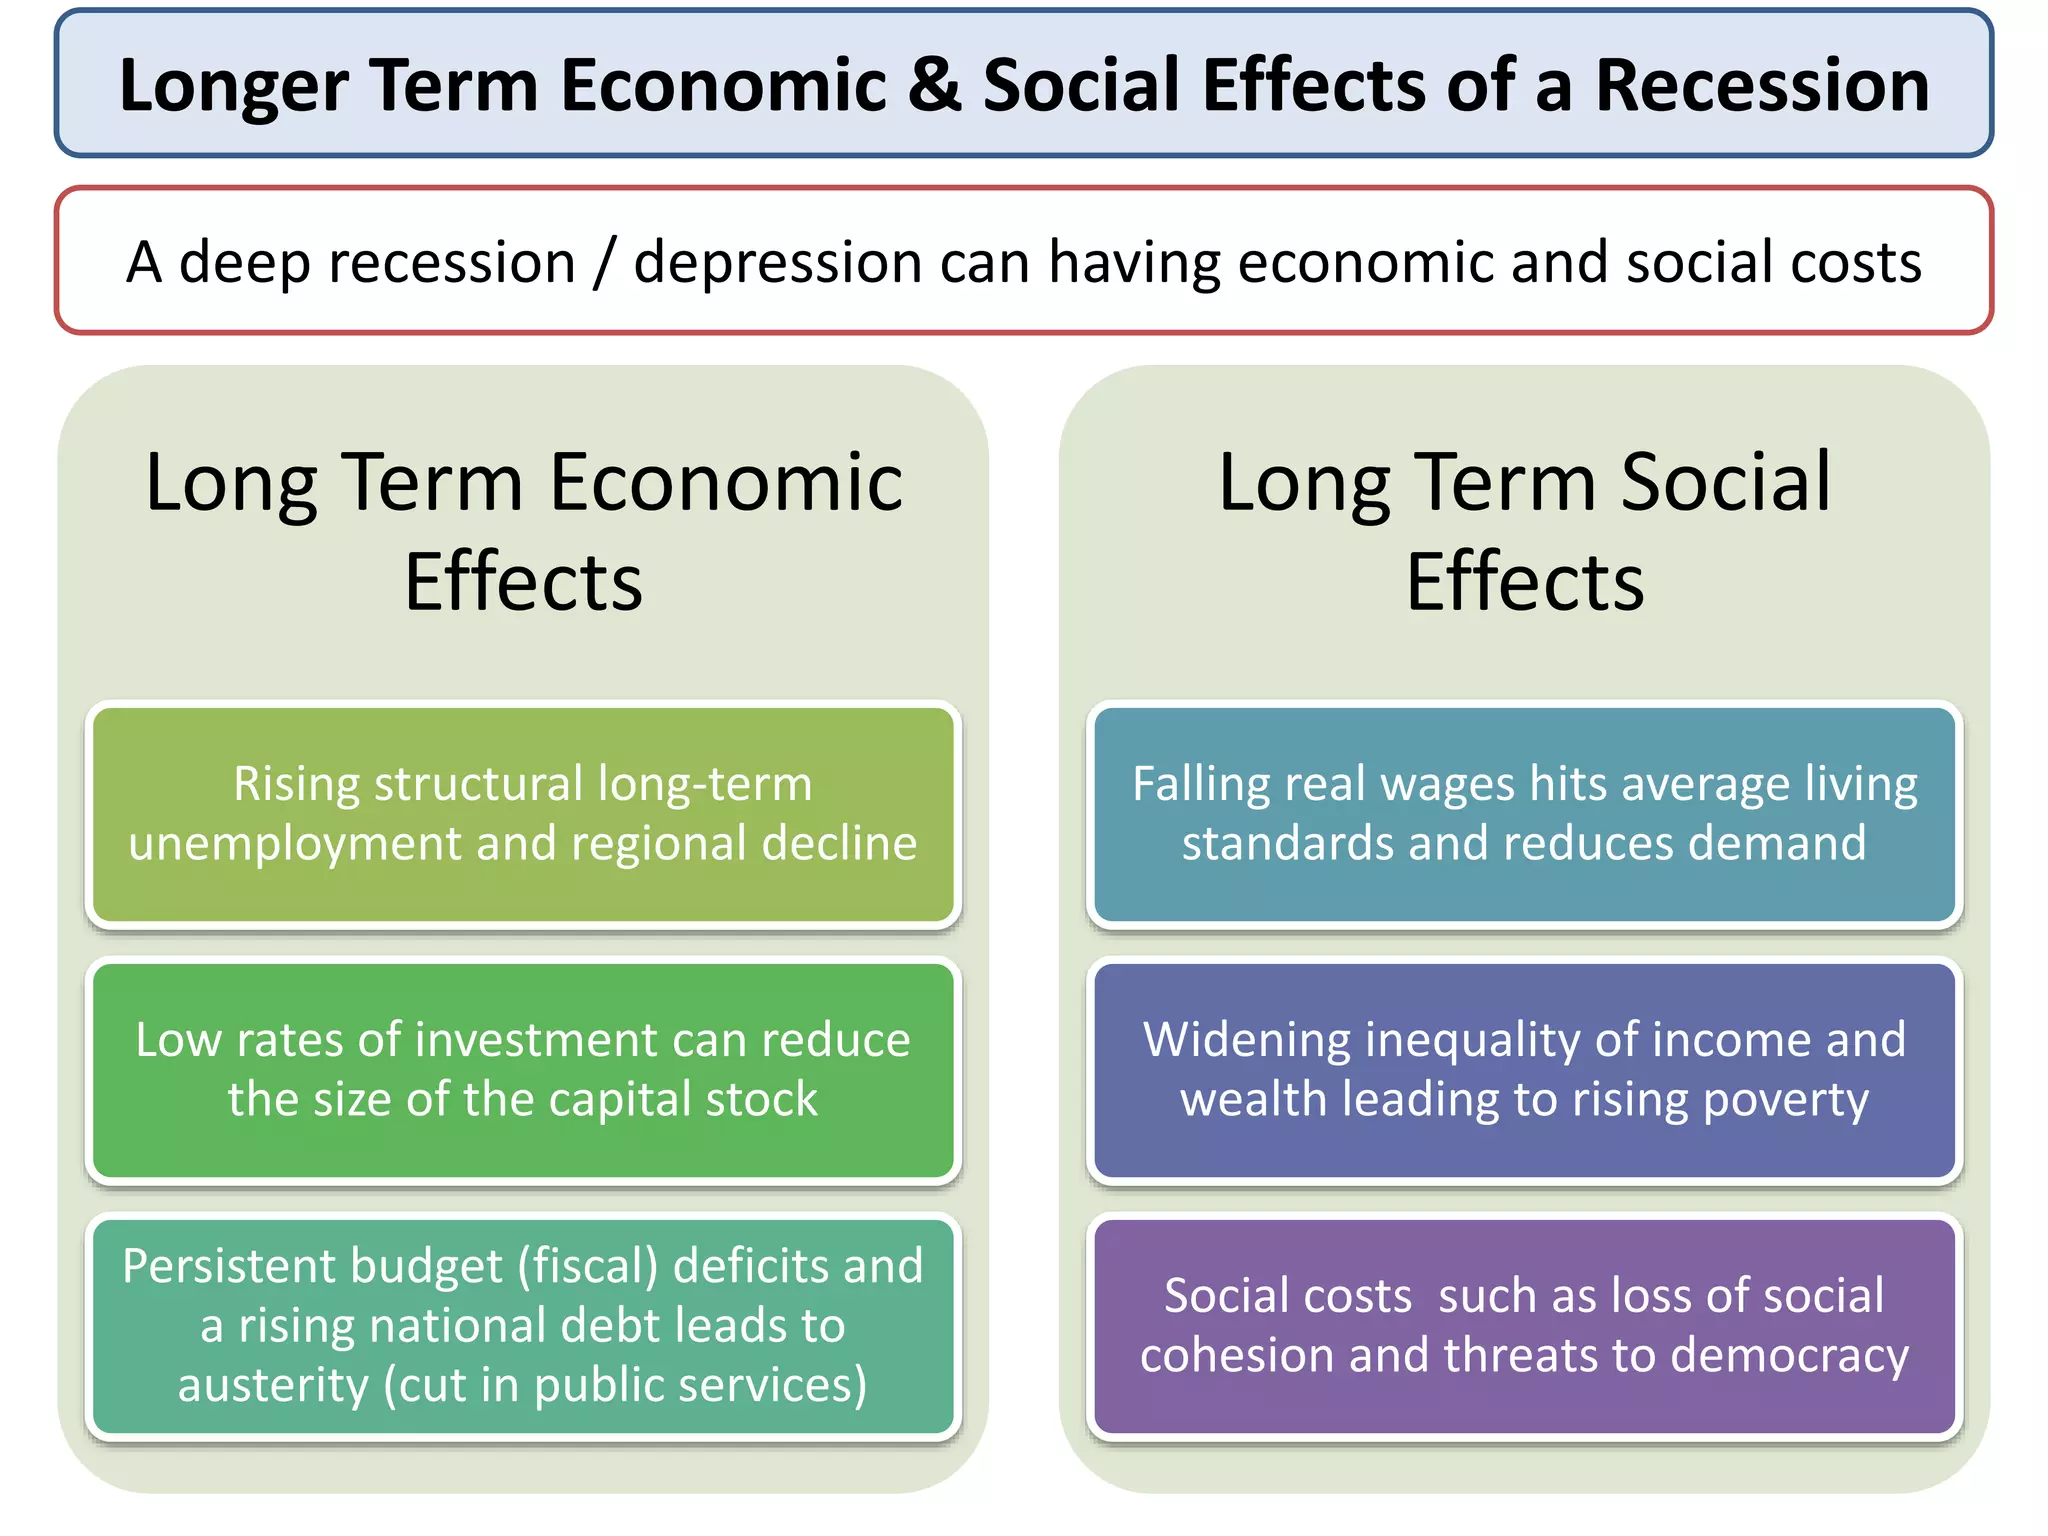
Longer Term Economic& Social Effects of a Recession
A deep recession / depression can having economic and social costs
Long Term Economic
Effects
Rising structural long-term
unemployment and regional decline
Low rates of investment can reduce
the size of the capital stock
Persistent budget (fiscal) deficits and
a rising national debt leads to
austerity (cut in public services)
Long Term Social
Effects
Falling real wages hits average living
standards and reduces demand
Widening inequality of income and
wealth leading to rising poverty
Social costs such as loss of social
cohesion and threats to democracy
17.
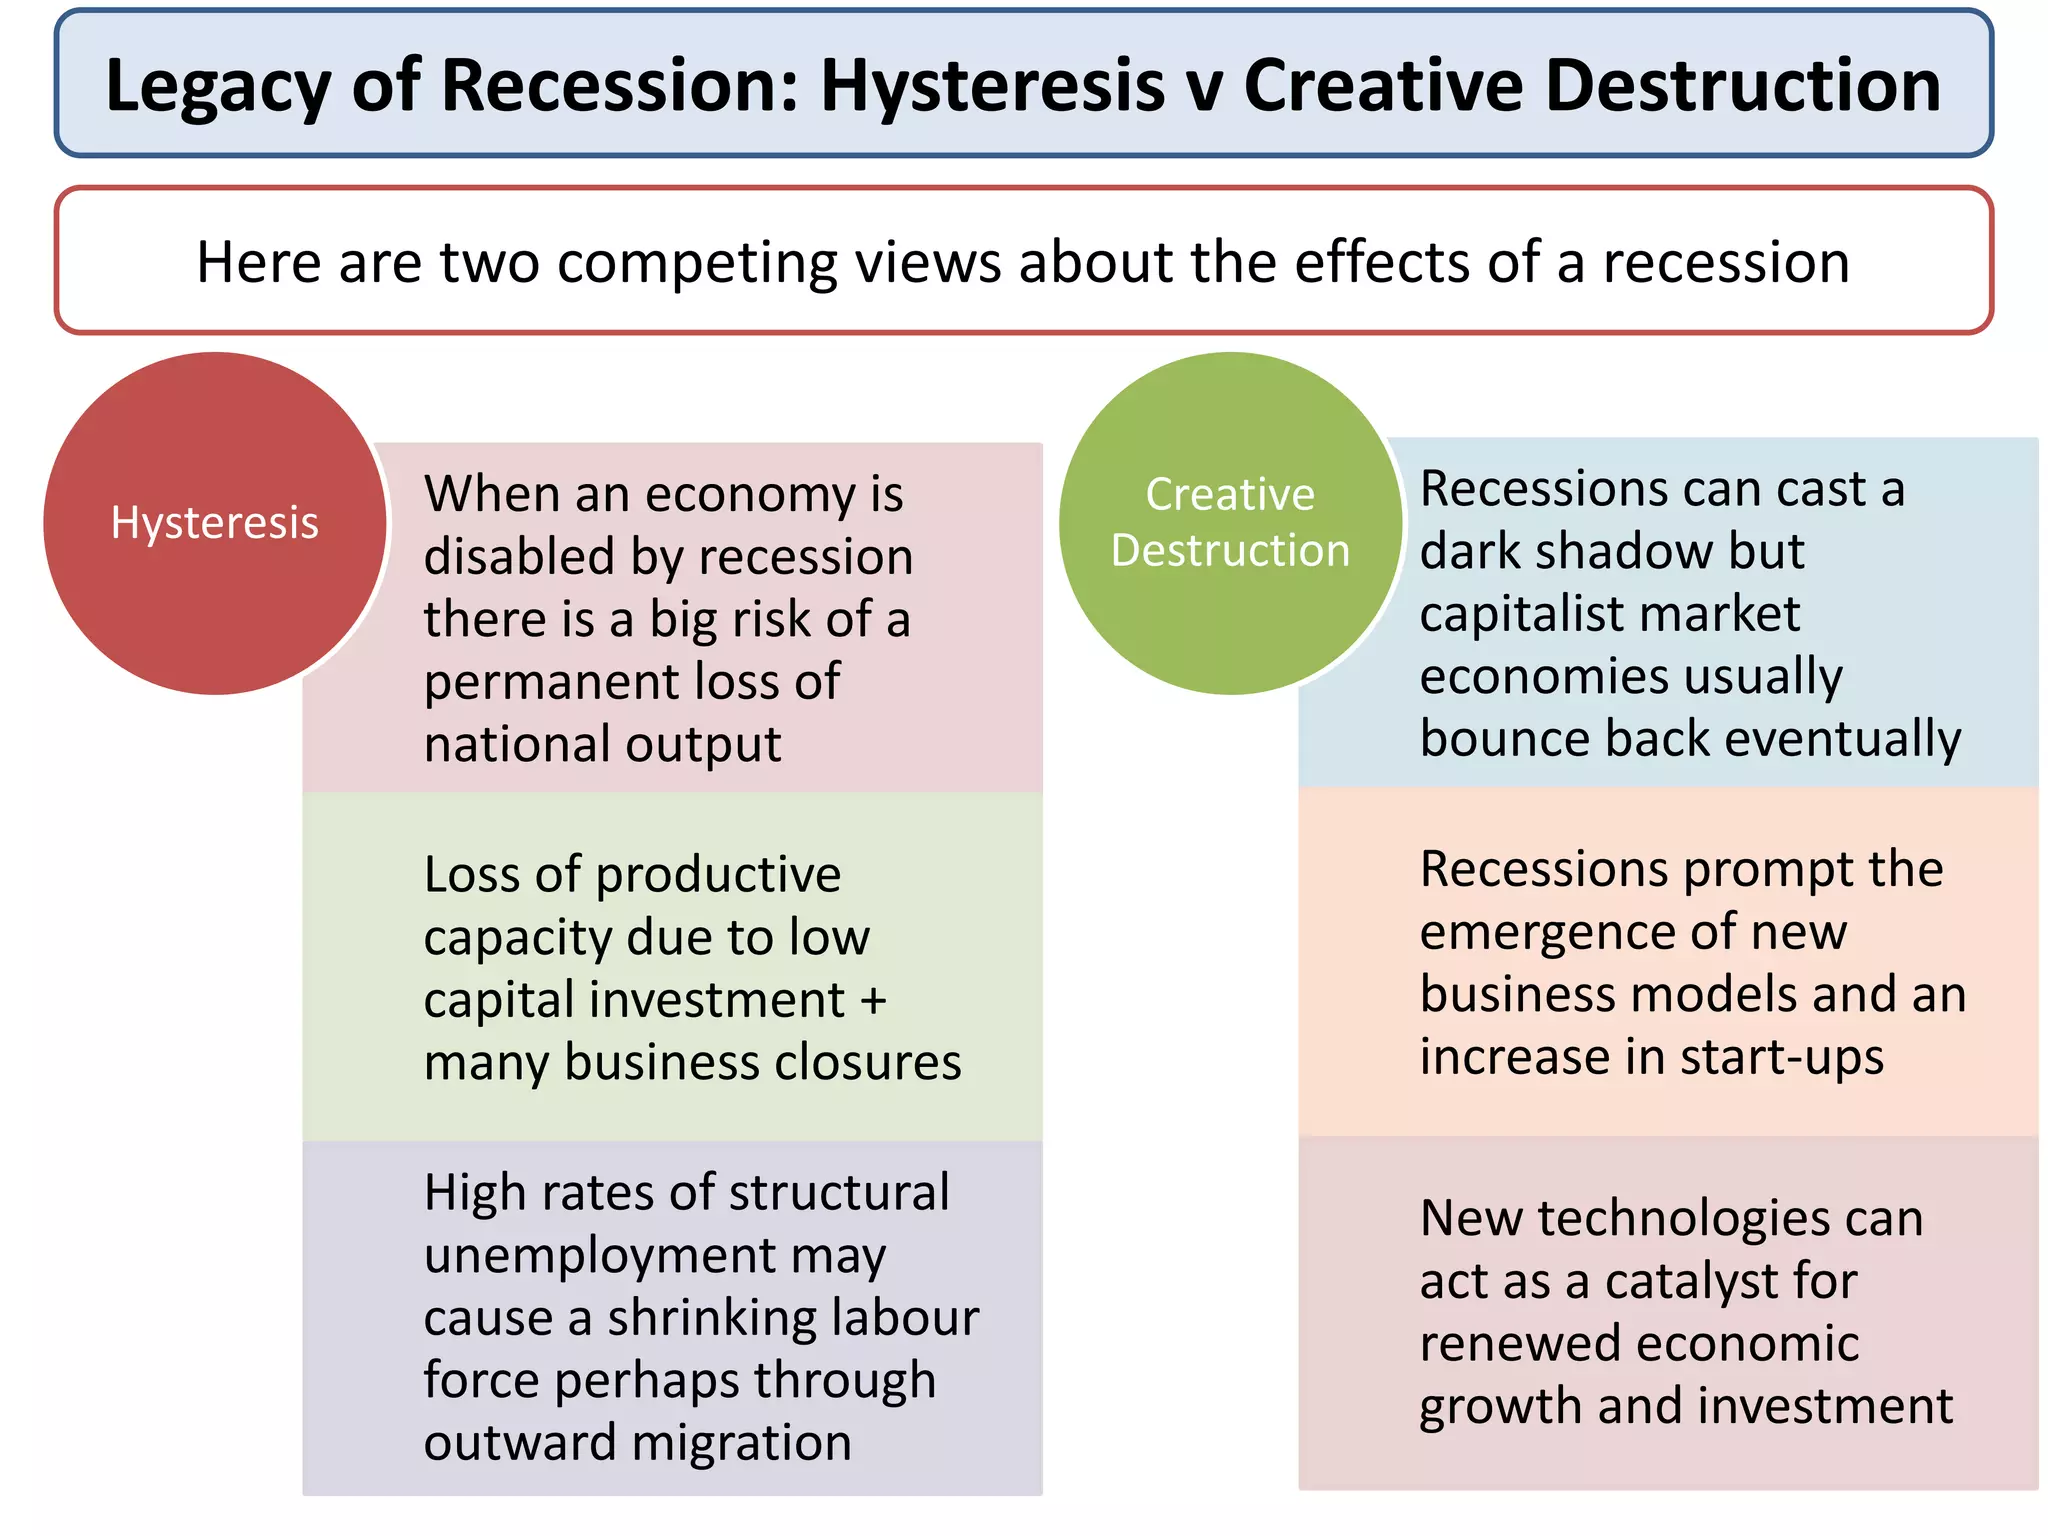
Legacy of Recession:Hysteresis v Creative Destruction
Here are two competing views about the effects of a recession
When an economy is
disabled by recession
there is a big risk of a
permanent loss of
national output
Loss of productive
capacity due to low
capital investment +
many business closures
High rates of structural
unemployment may
cause a shrinking labour
force perhaps through
outward migration
Hysteresis
Recessions can cast a
dark shadow but
capitalist market
economies usually
bounce back eventually
Recessions prompt the
emergence of new
business models and an
increase in start-ups
New technologies can
act as a catalyst for
renewed economic
growth and investment
Creative
Destruction
18.
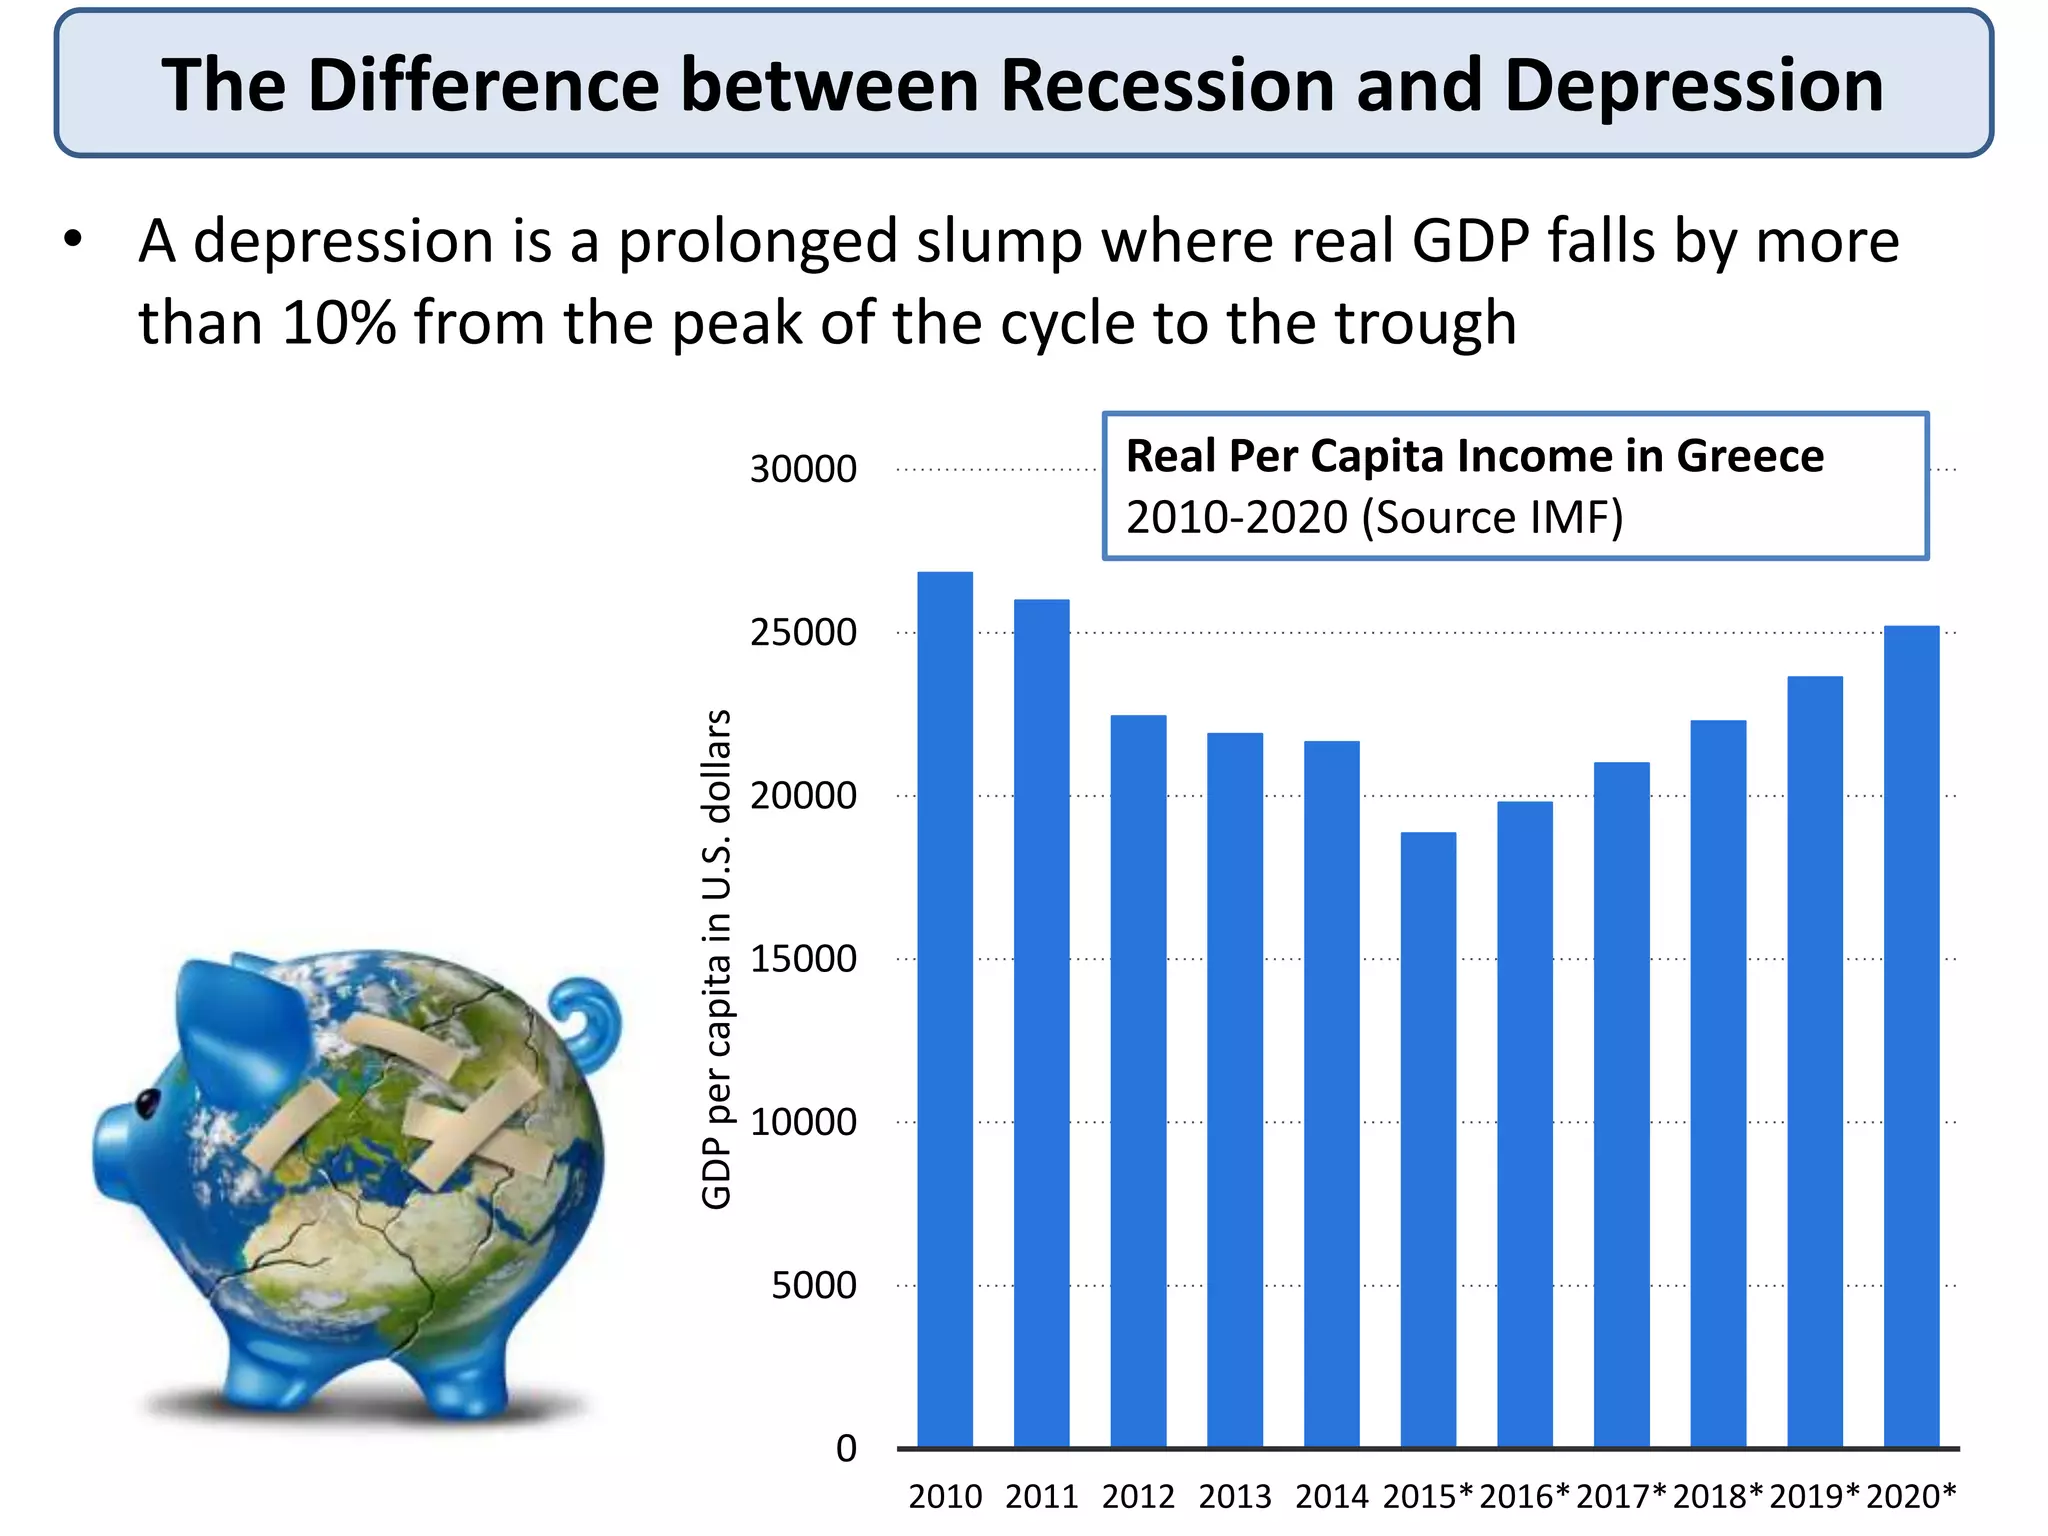
The Difference betweenRecession and Depression
• A depression is a prolonged slump where real GDP falls by more
than 10% from the peak of the cycle to the trough
0
5000
10000
15000
20000
25000
30000
2010 2011 2012 2013 2014 2015*2016*2017*2018*2019*2020*
GDPpercapitainU.S.dollars
Real Per Capita Income in Greece
2010-2020 (Source IMF)