Download as PDF, PPTX
![Device Distribution
Q2. Which of the following devices do you currently own? [Check all that apply]
Laptop computer 80%
Desktop computer 80%
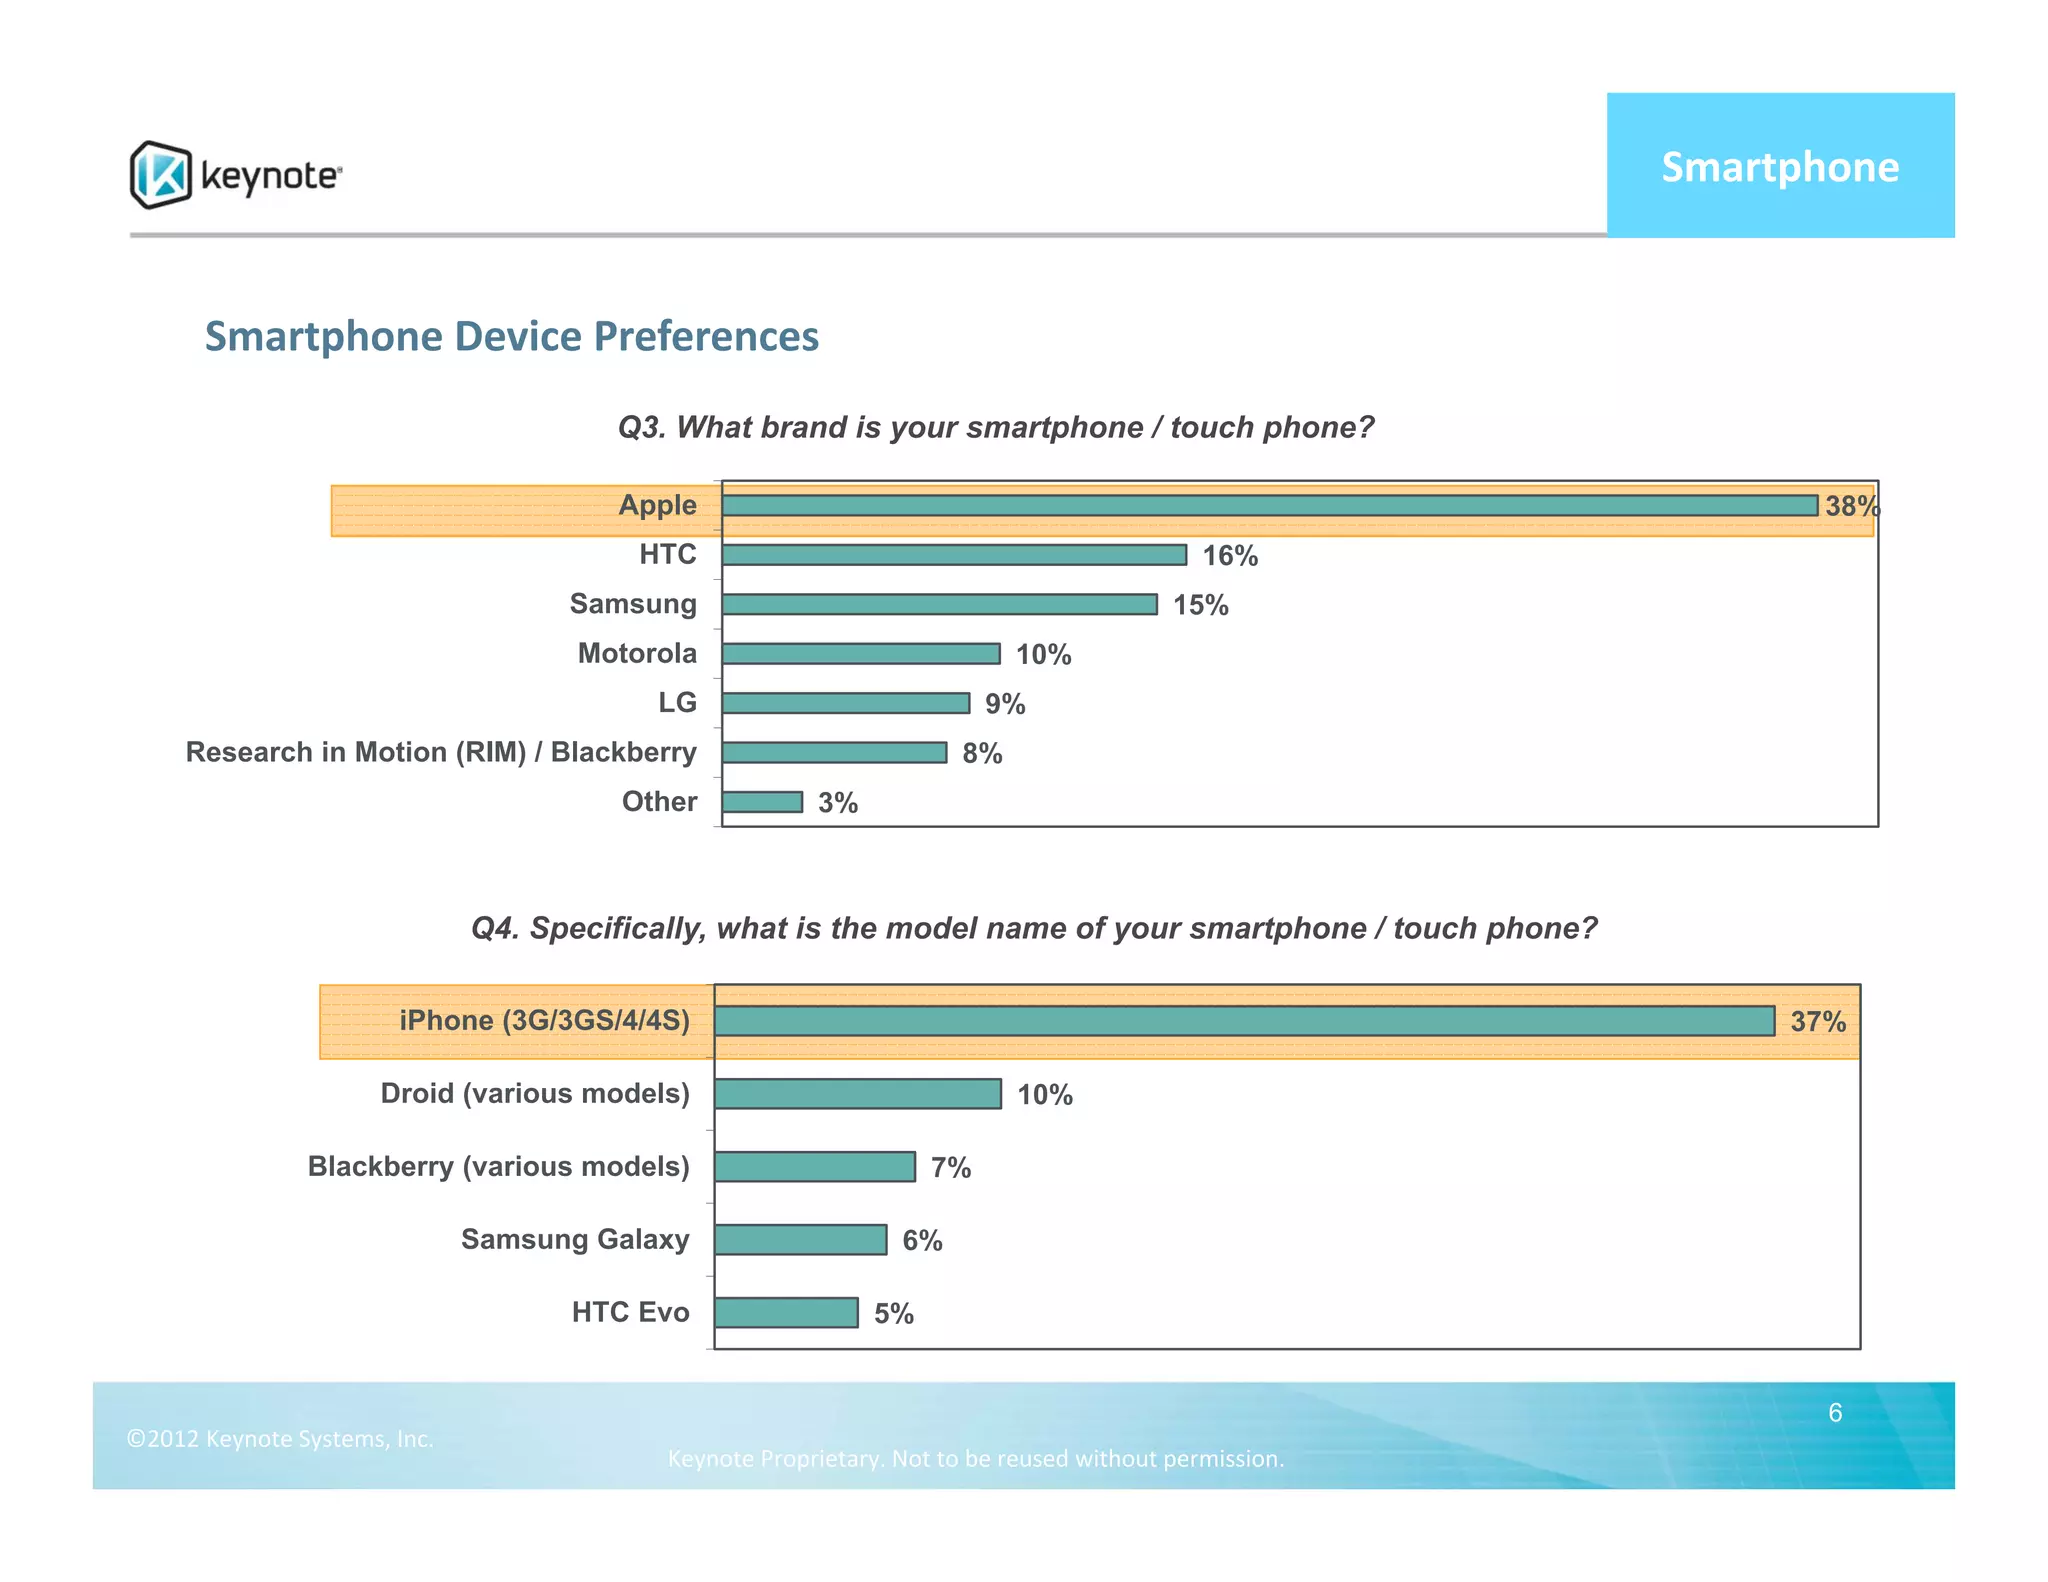
Smartphone / touch phone 58%
Tablet 37%
5
©2012 Keynote Systems, Inc.
Keynote Proprietary. Not to be reused without permission.](https://image.slidesharecdn.com/keynotemobileusersurvey1h2012-120813164743-phpapp02/75/Keynote-mobile-user-survey-1-h2012-5-2048.jpg)
![Smartphone
Smartphone User Habits – Activity Preferences
Q7. Which of the activities below do you typically perform on your smartphone / touch phone?
[Check all that apply]
Access local information 88%
Search for information 82%
Participate in social media / networking sites 76%
Read news and entertainment 75%
Find local services 74%
Research products and services 62%
Watch videos 59%
Perform banking activities 56%
Purchase products and services 47%
Read or post to blogs 45%
Check sports news, scores, manage fantasy leagues 45%
Read or post product/service reviews 42%
Research travel destinations 41%
Book travel arrangements 29%
Other 10%
• Check e‐mail (4%)
• Play games (3%)
• Call/text (2%)
8
©2012 Keynote Systems, Inc.
Keynote Proprietary. Not to be reused without permission.](https://image.slidesharecdn.com/keynotemobileusersurvey1h2012-120813164743-phpapp02/75/Keynote-mobile-user-survey-1-h2012-8-2048.jpg)
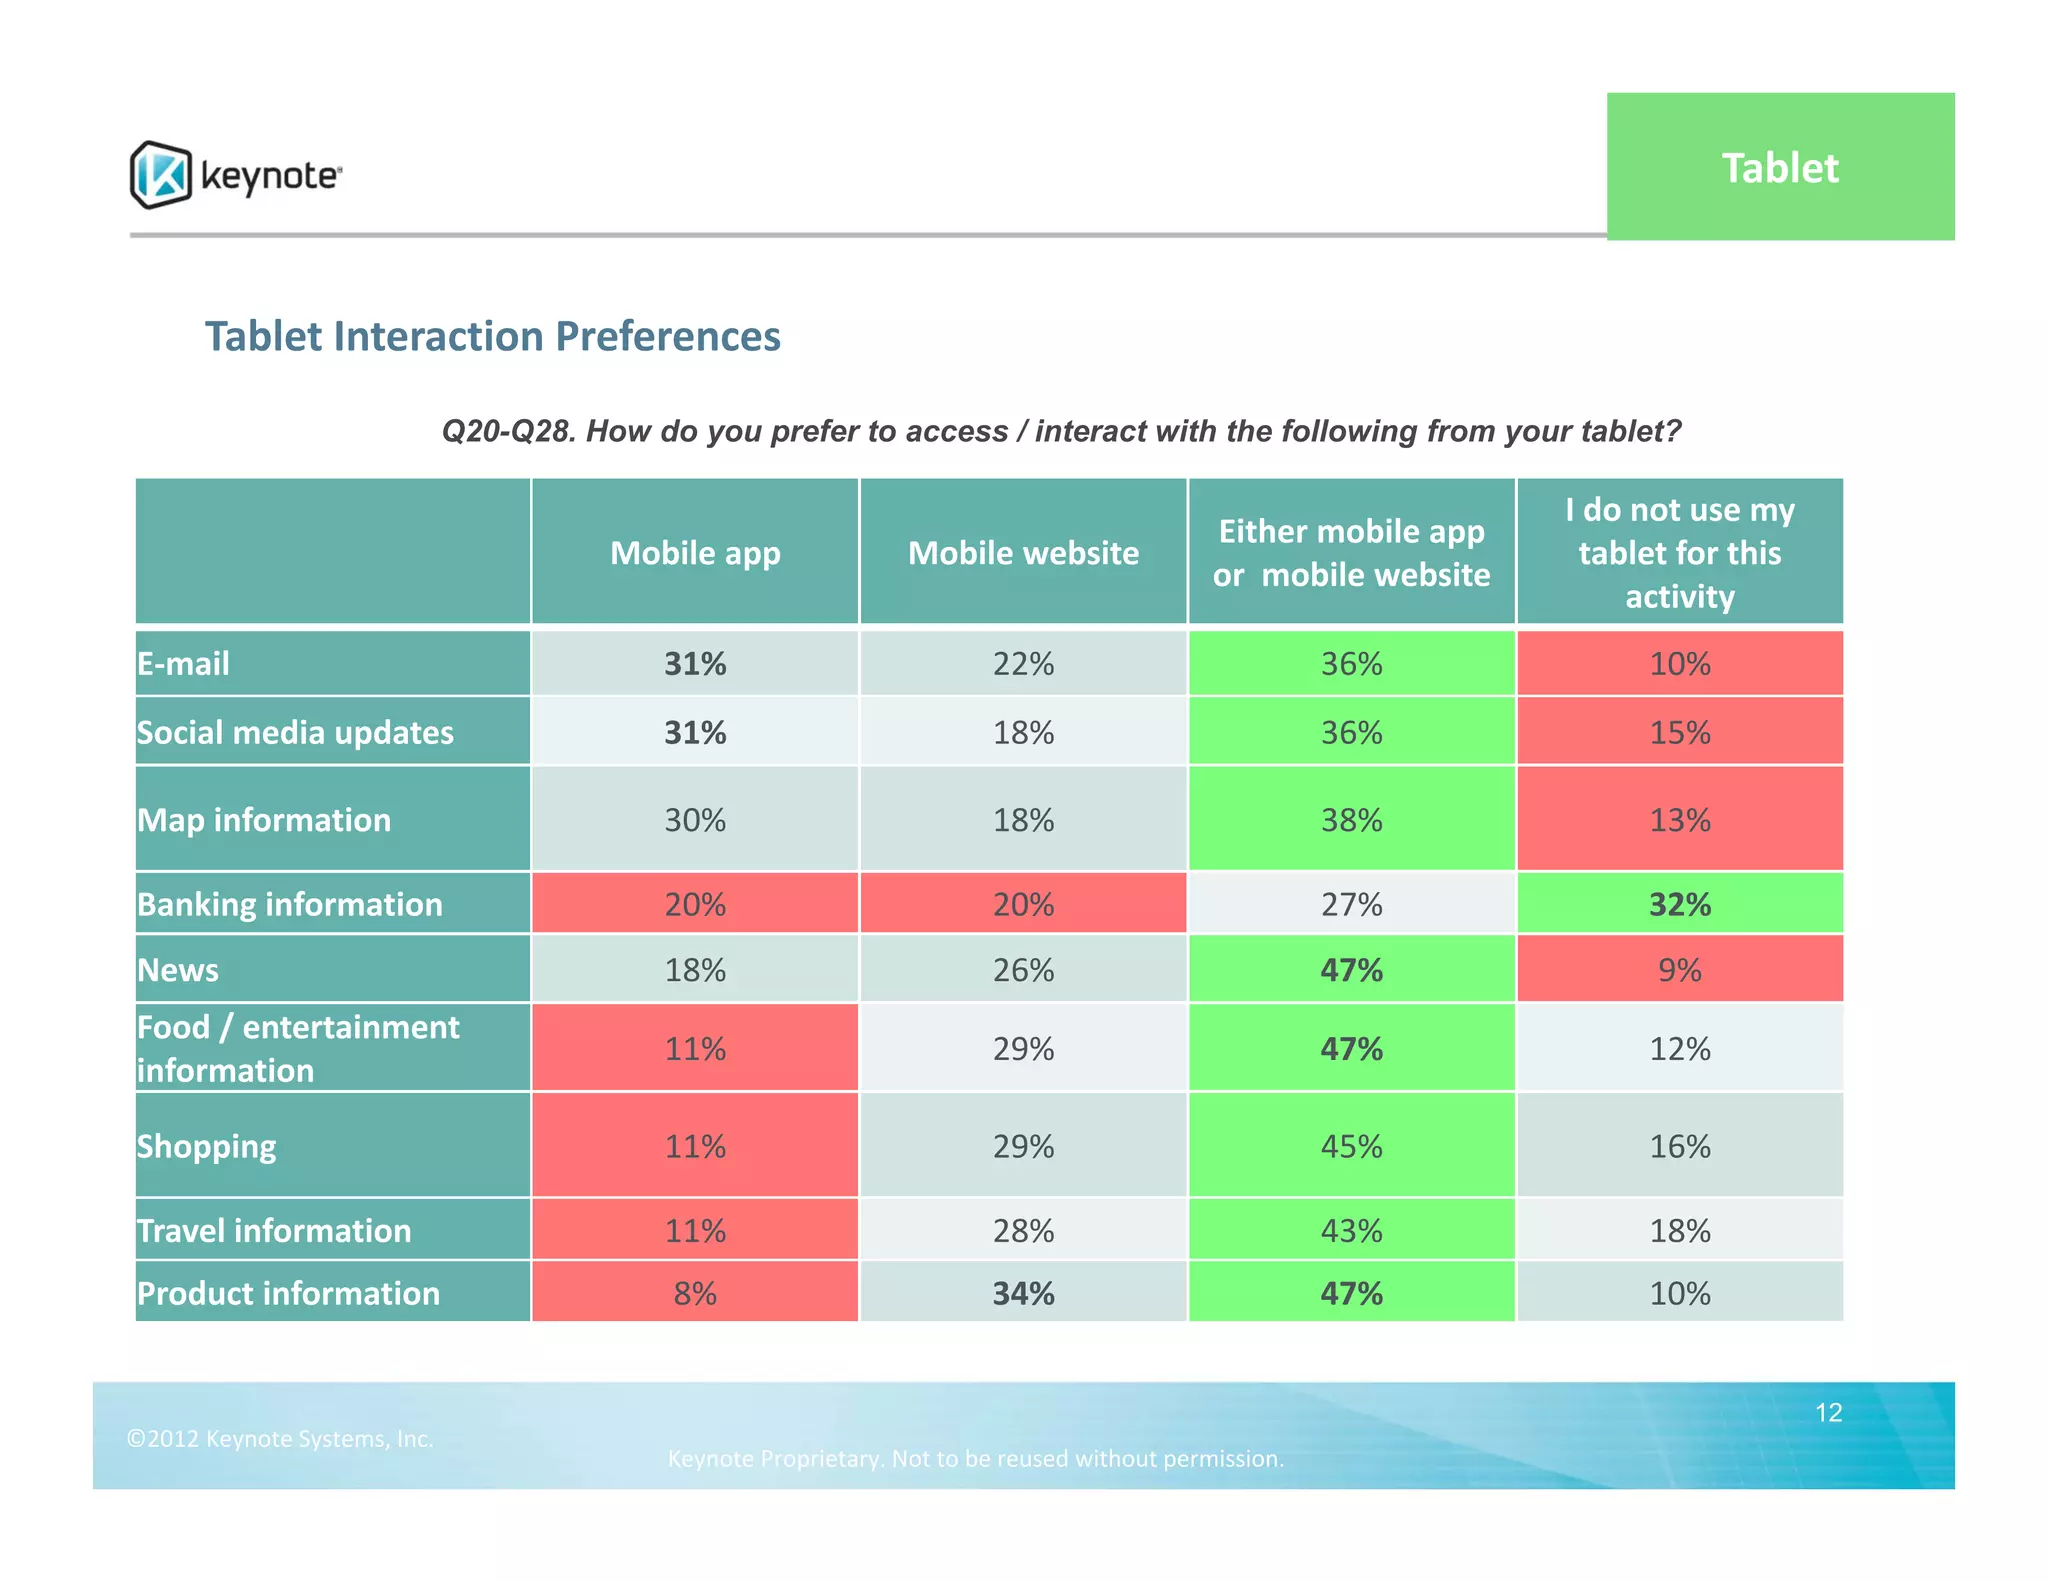
![Tablet
Tablet User Habits – Activity Preferences
Q19. Which of the activities below do you typically perform on your tablet? [Check all that apply]
Read news and entertainment 79%
Search for information 77%
Watch videos 76%
Access local information 75%
Participate in social media / networking sites 75%
Research products and services 69%
Purchase products and services 62%
Read or post to blogs 57%
Find local services 55%
Read or post product/service reviews 55%
Research travel destinations 54%
Perform banking activities 50%
Check sports news, scores, manage fantasy leagues 48%
Book travel arrangements 41%
Other 14%
• Read books (6%)
• Play games (5%)
• Check e‐mail (2%)
11
©2012 Keynote Systems, Inc.
Keynote Proprietary. Not to be reused without permission.](https://image.slidesharecdn.com/keynotemobileusersurvey1h2012-120813164743-phpapp02/75/Keynote-mobile-user-survey-1-h2012-11-2048.jpg)
![Smartphone vs. Tablet ‐ Activities Comparison
Q19. Which of the activities below do you typically perform on your tablet? [Check all that apply]
Read news and entertainment 79%
75%
Search for information 77%
82%
Watch videos 76%
59%
Access local information 75%
88%
Participate in social media / networking sites 75%
76%
Research products and services 69%
62%
Tablet
Purchase products and services 62%
47% n=1976
Read or post to blogs 57% Smartphone
45% n=3145
Find local services 55%
74%
Read or post product/service reviews 55%
42%
Research travel destinations 54%
41%
Perform banking activities 50%
56%
Check sports news, scores, manage fantasy leagues 48%
45%
Book travel arrangements 41%
29%
Other 14%
10%
14
©2012 Keynote Systems, Inc.
Keynote Proprietary. Not to be reused without permission.](https://image.slidesharecdn.com/keynotemobileusersurvey1h2012-120813164743-phpapp02/75/Keynote-mobile-user-survey-1-h2012-14-2048.jpg)
![Website Access Preferences
Q29. How do you typically access a websites on either your smart phone or tablet? [Check all that apply]
Type address into browser 76%
Link from search result in search engine 67%
Bookmarks / favorites 54%
Link from email 53%
Link from text messages (SMS, MMS) 29%
Scan a QR code or other tag code 23%
Other 2%
15
©2012 Keynote Systems, Inc.
Keynote Proprietary. Not to be reused without permission.](https://image.slidesharecdn.com/keynotemobileusersurvey1h2012-120813164743-phpapp02/75/Keynote-mobile-user-survey-1-h2012-15-2048.jpg)
![Mobile Website Problems and Frustrations
Q38. Which of the following problems / frustrations have you experienced in the last 3 months
while using your smartphone and / or tablet? [Check all that apply]
Web pages slow to load 66%
Websites not optimized for smartphones 48%
Loading errors / couldn't open a page 48%
Difficult to interact with a webpage 46%
Navigation on a website was difficult 44%
Difficult to read a webpage on the device 42%
Website didn't the have functionality expected 36%
I haven't experienced any of these problems in… 12%
Other 2%
19
©2012 Keynote Systems, Inc.
Keynote Proprietary. Not to be reused without permission.](https://image.slidesharecdn.com/keynotemobileusersurvey1h2012-120813164743-phpapp02/75/Keynote-mobile-user-survey-1-h2012-19-2048.jpg)

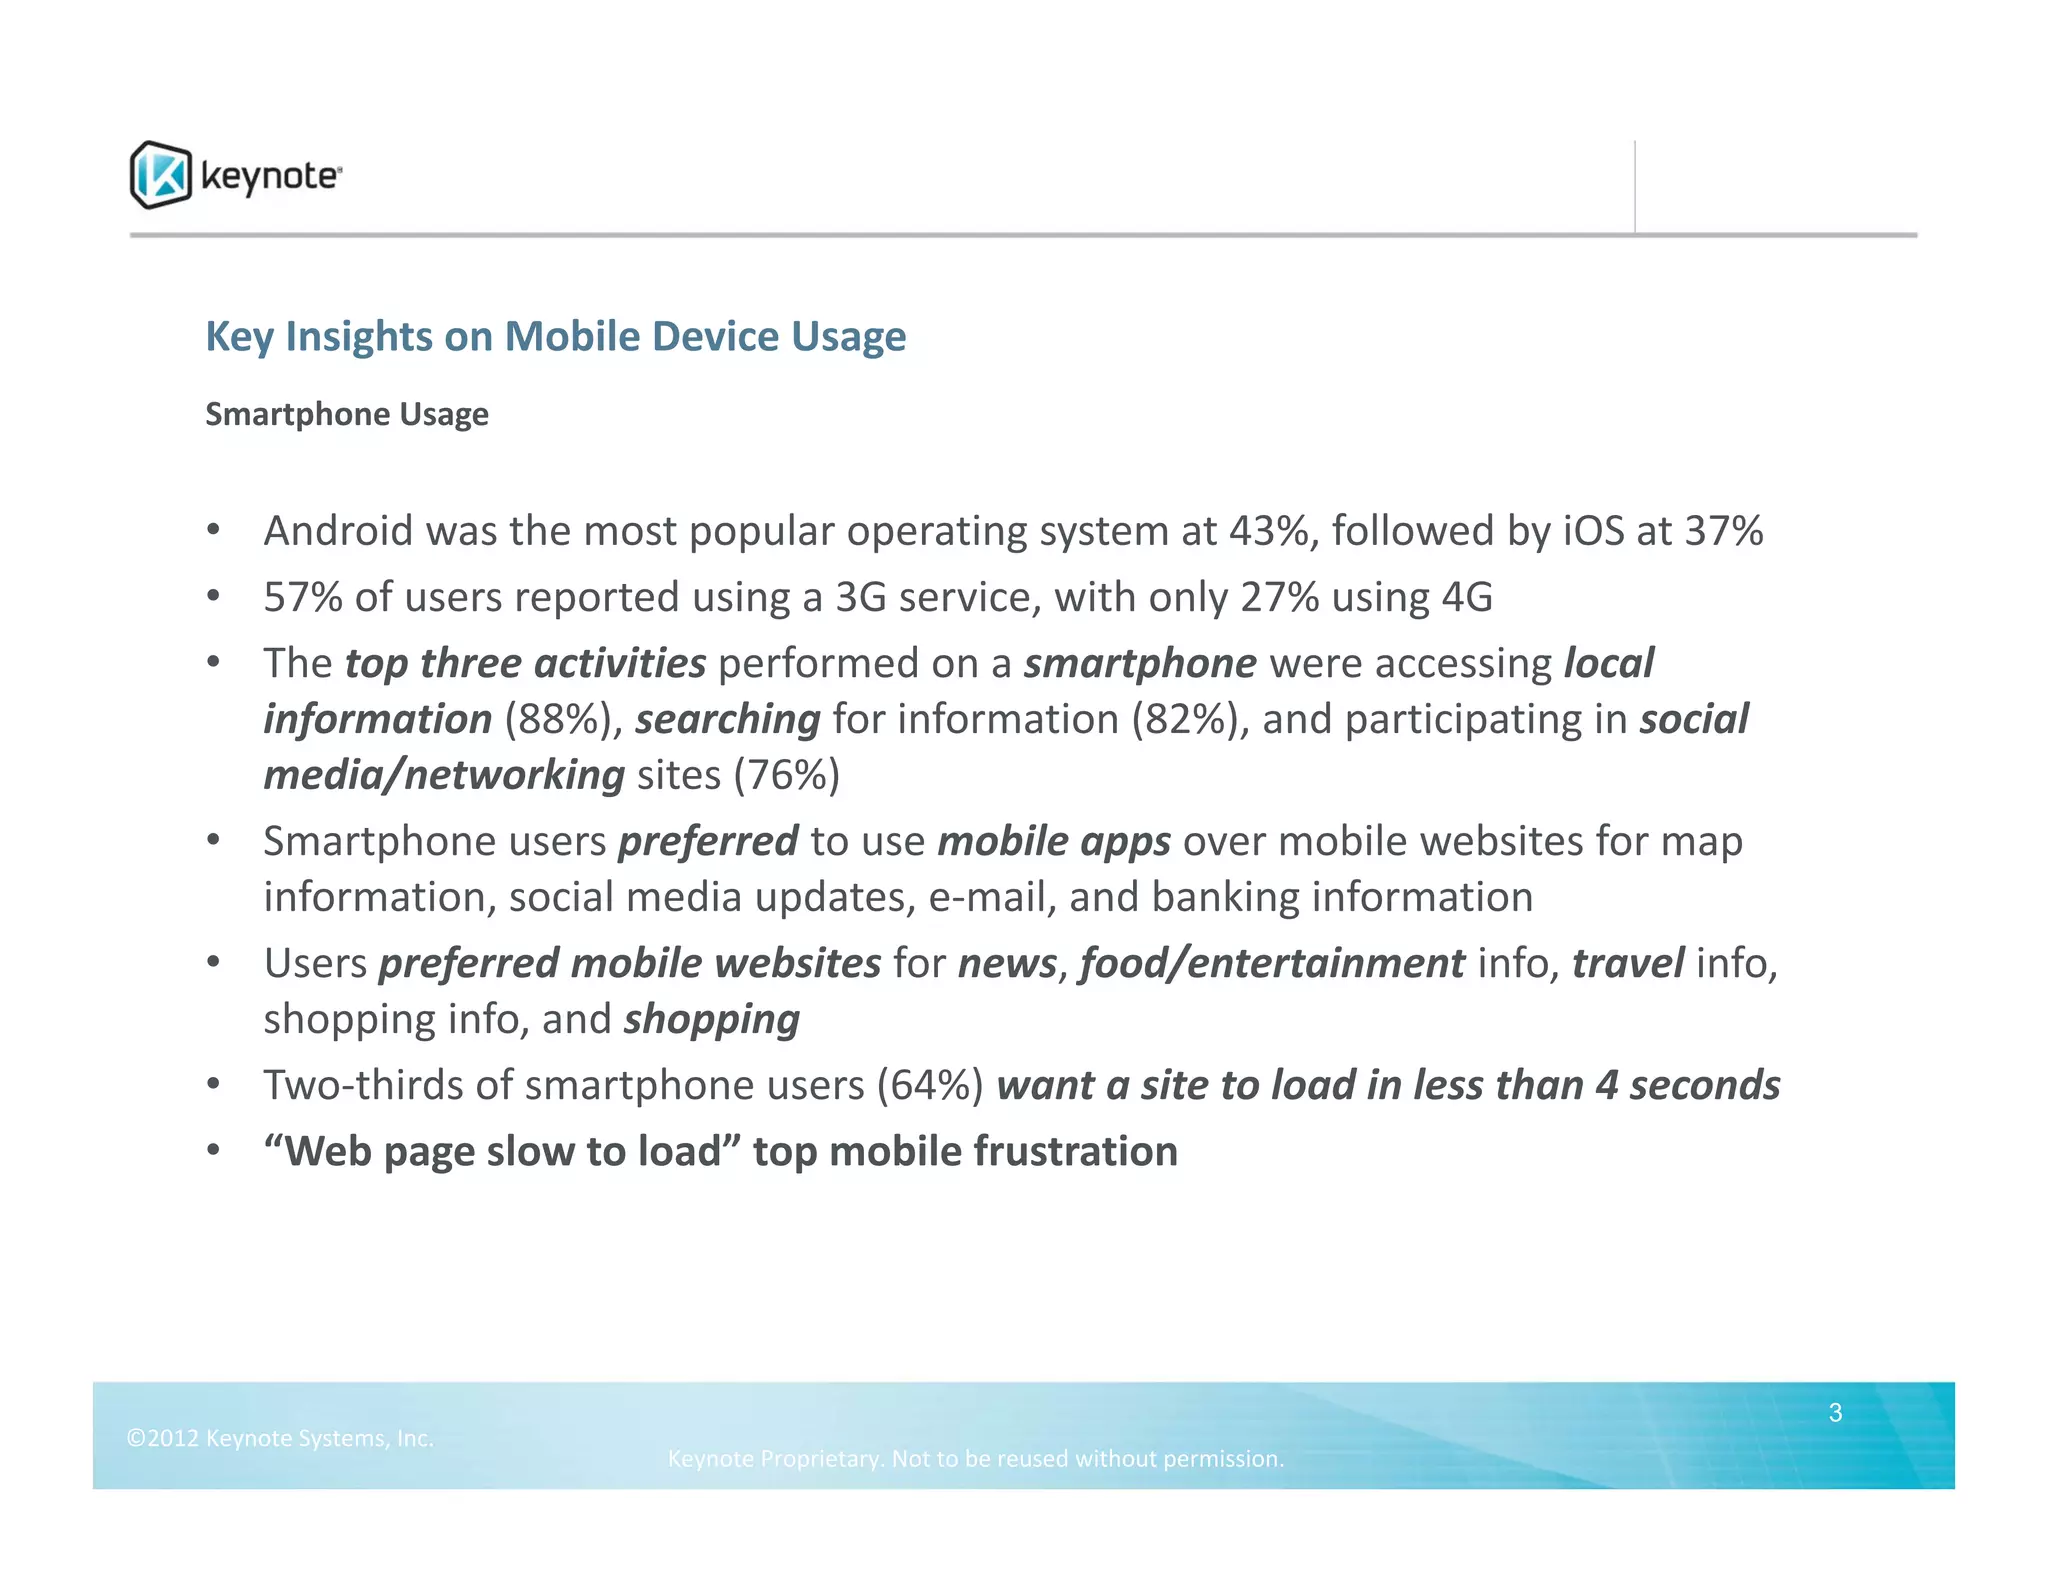
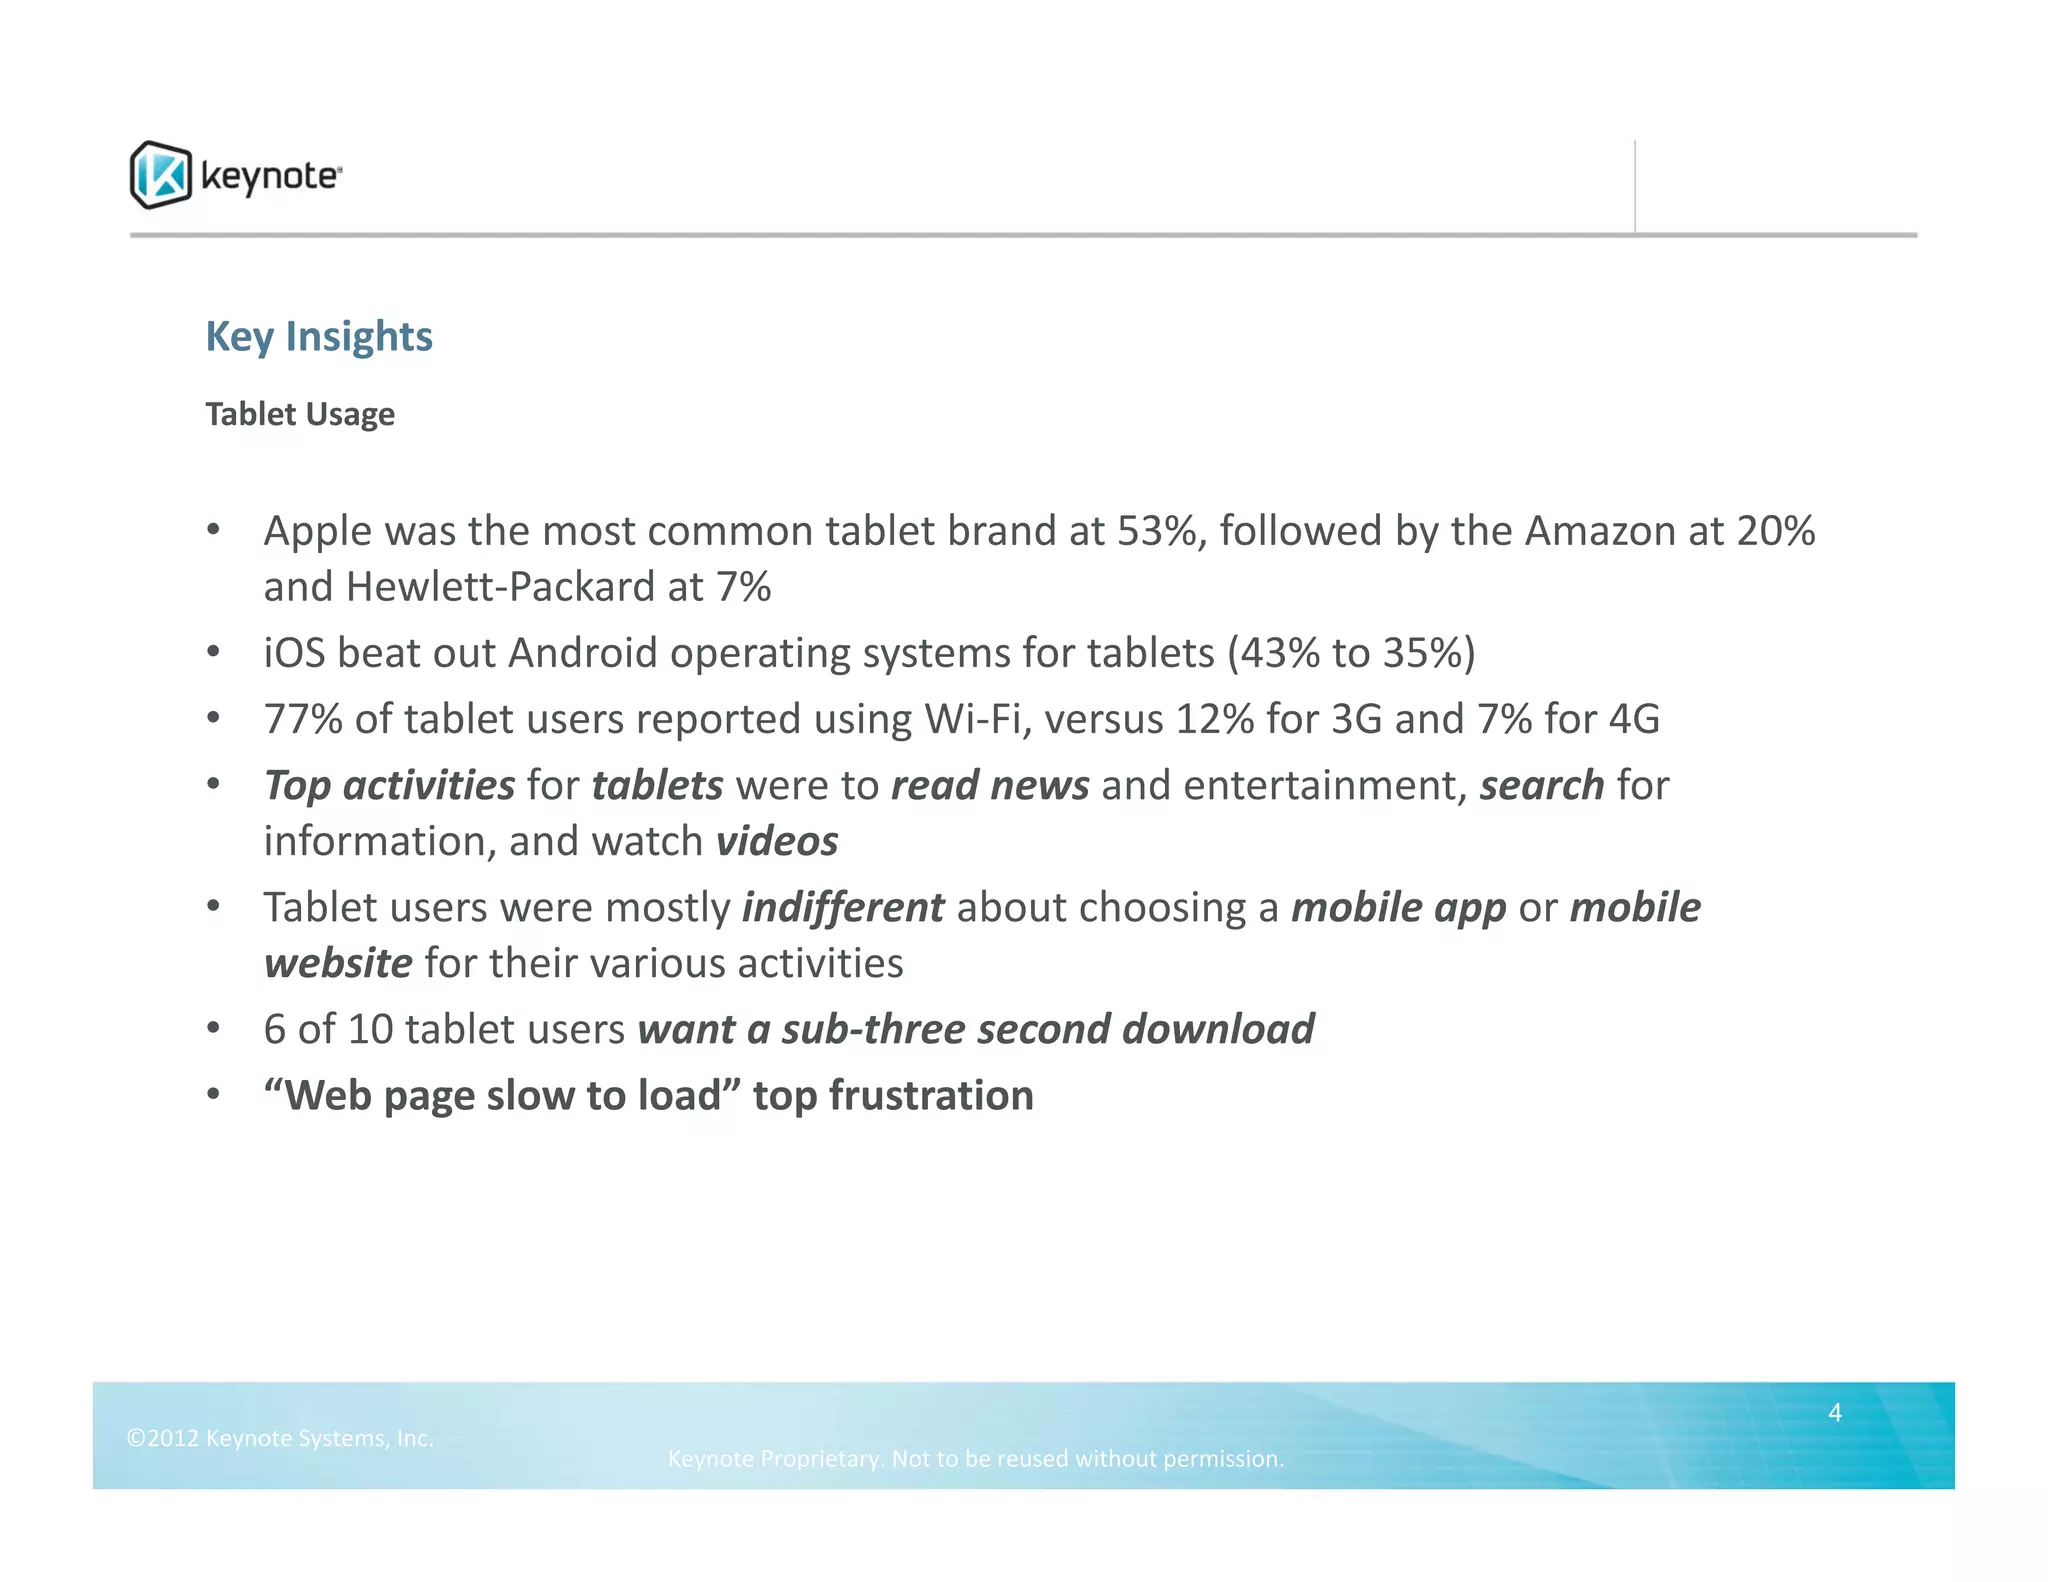
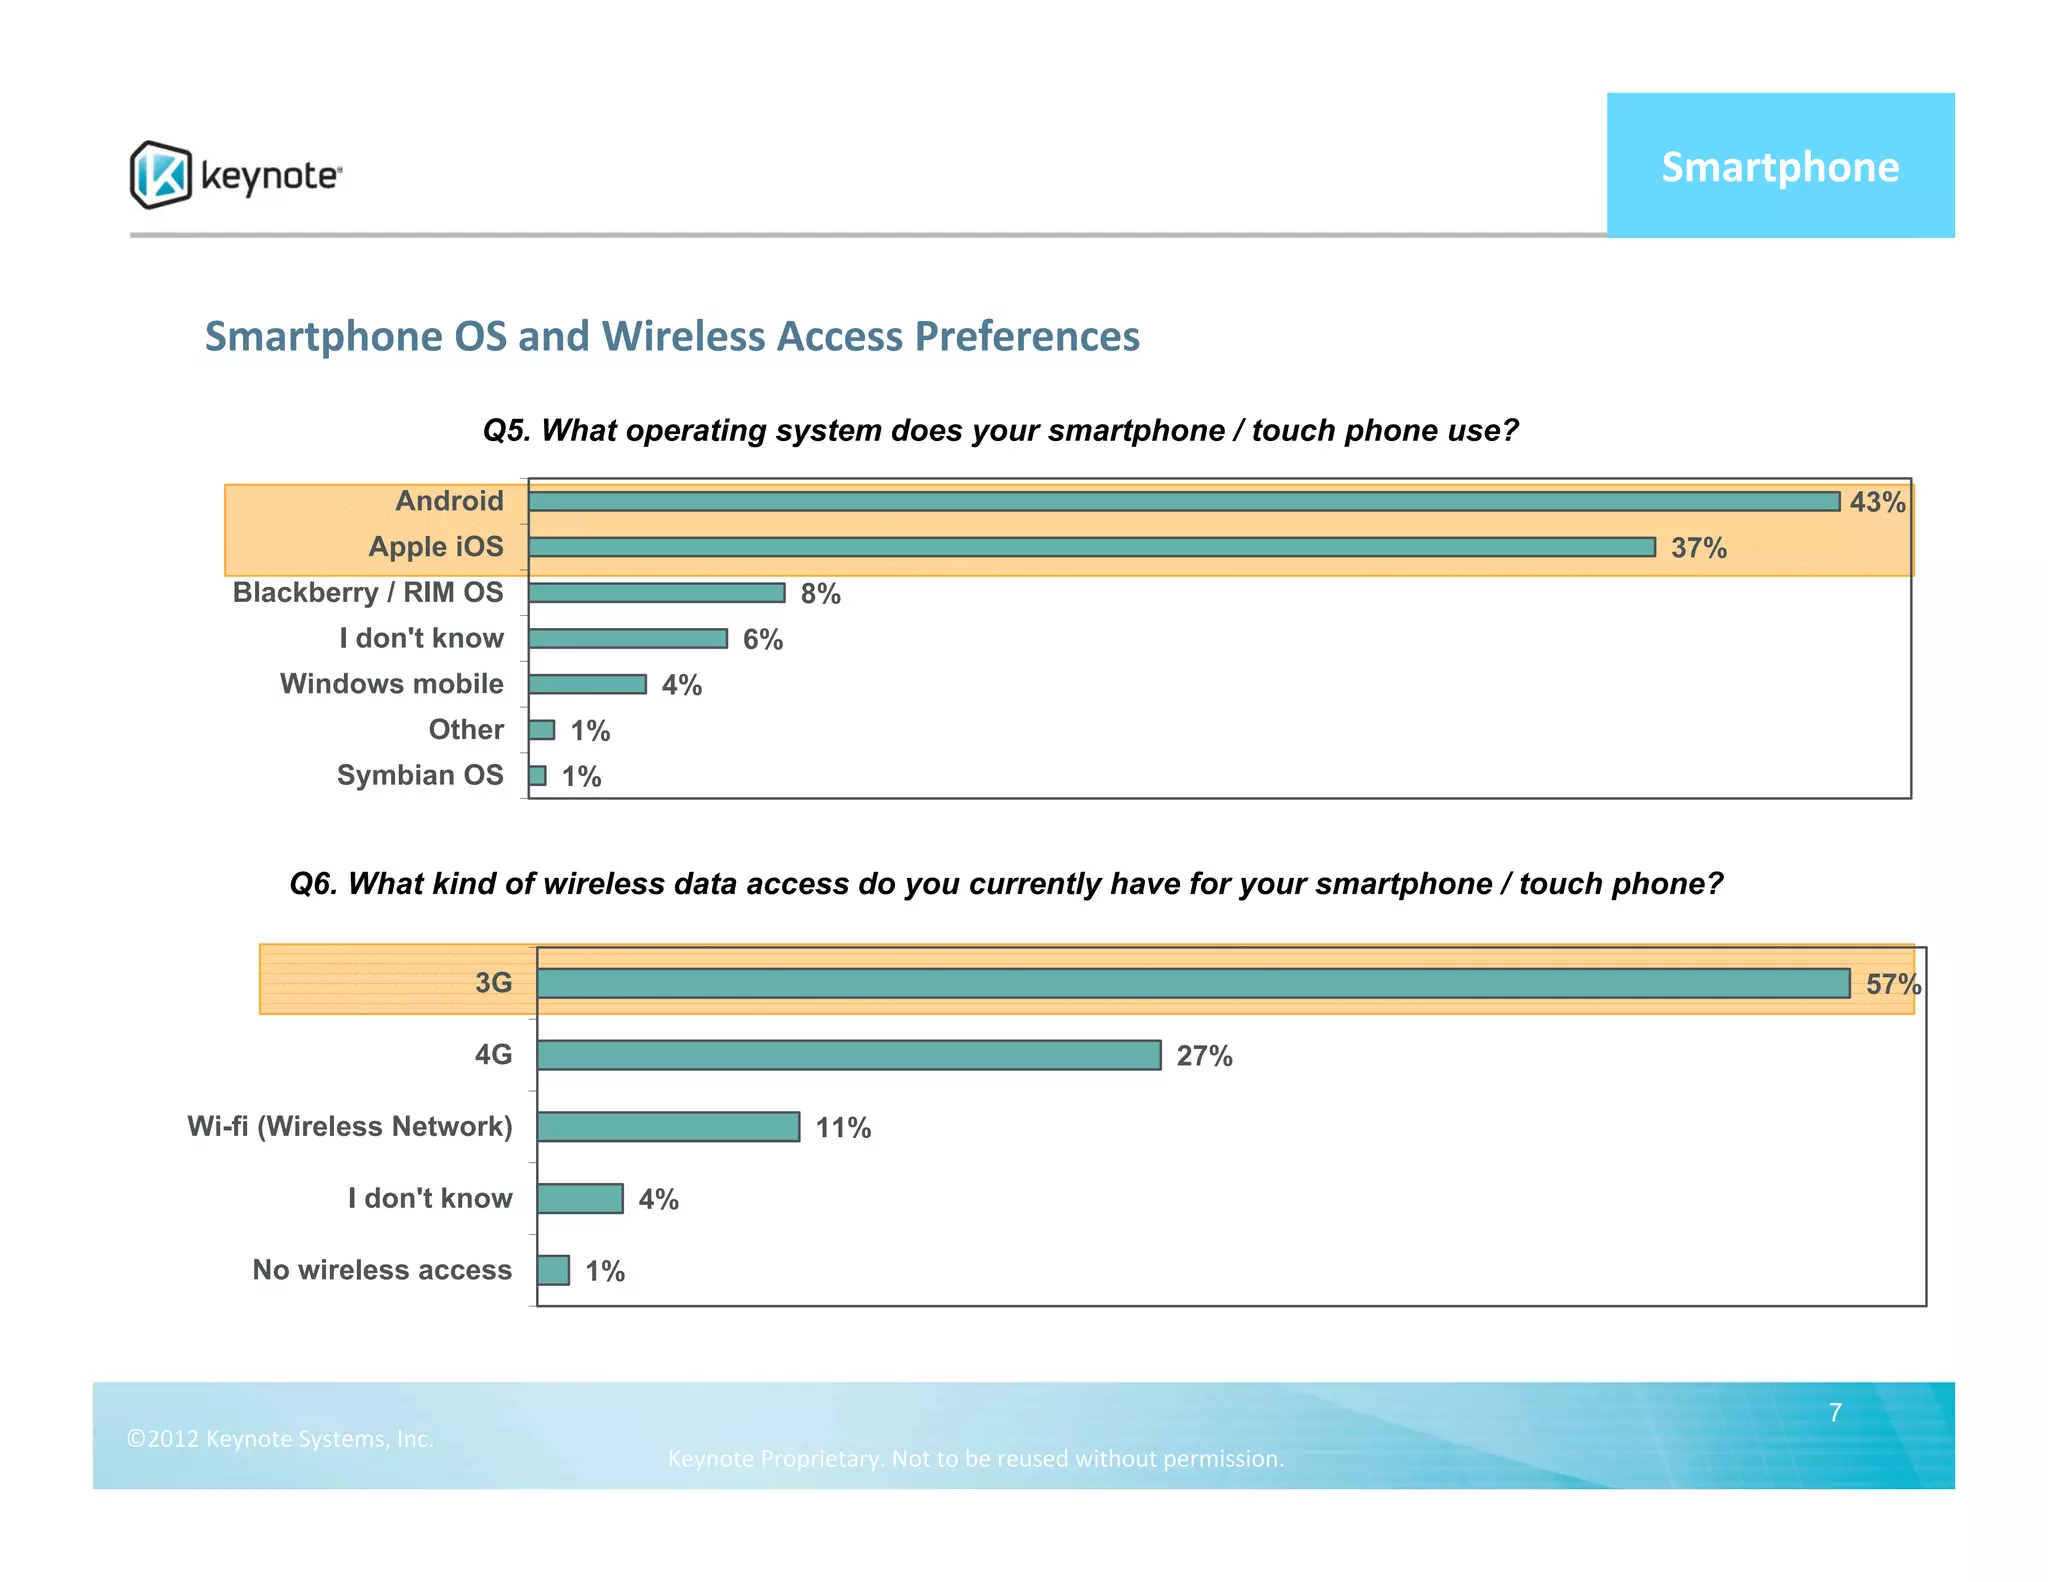
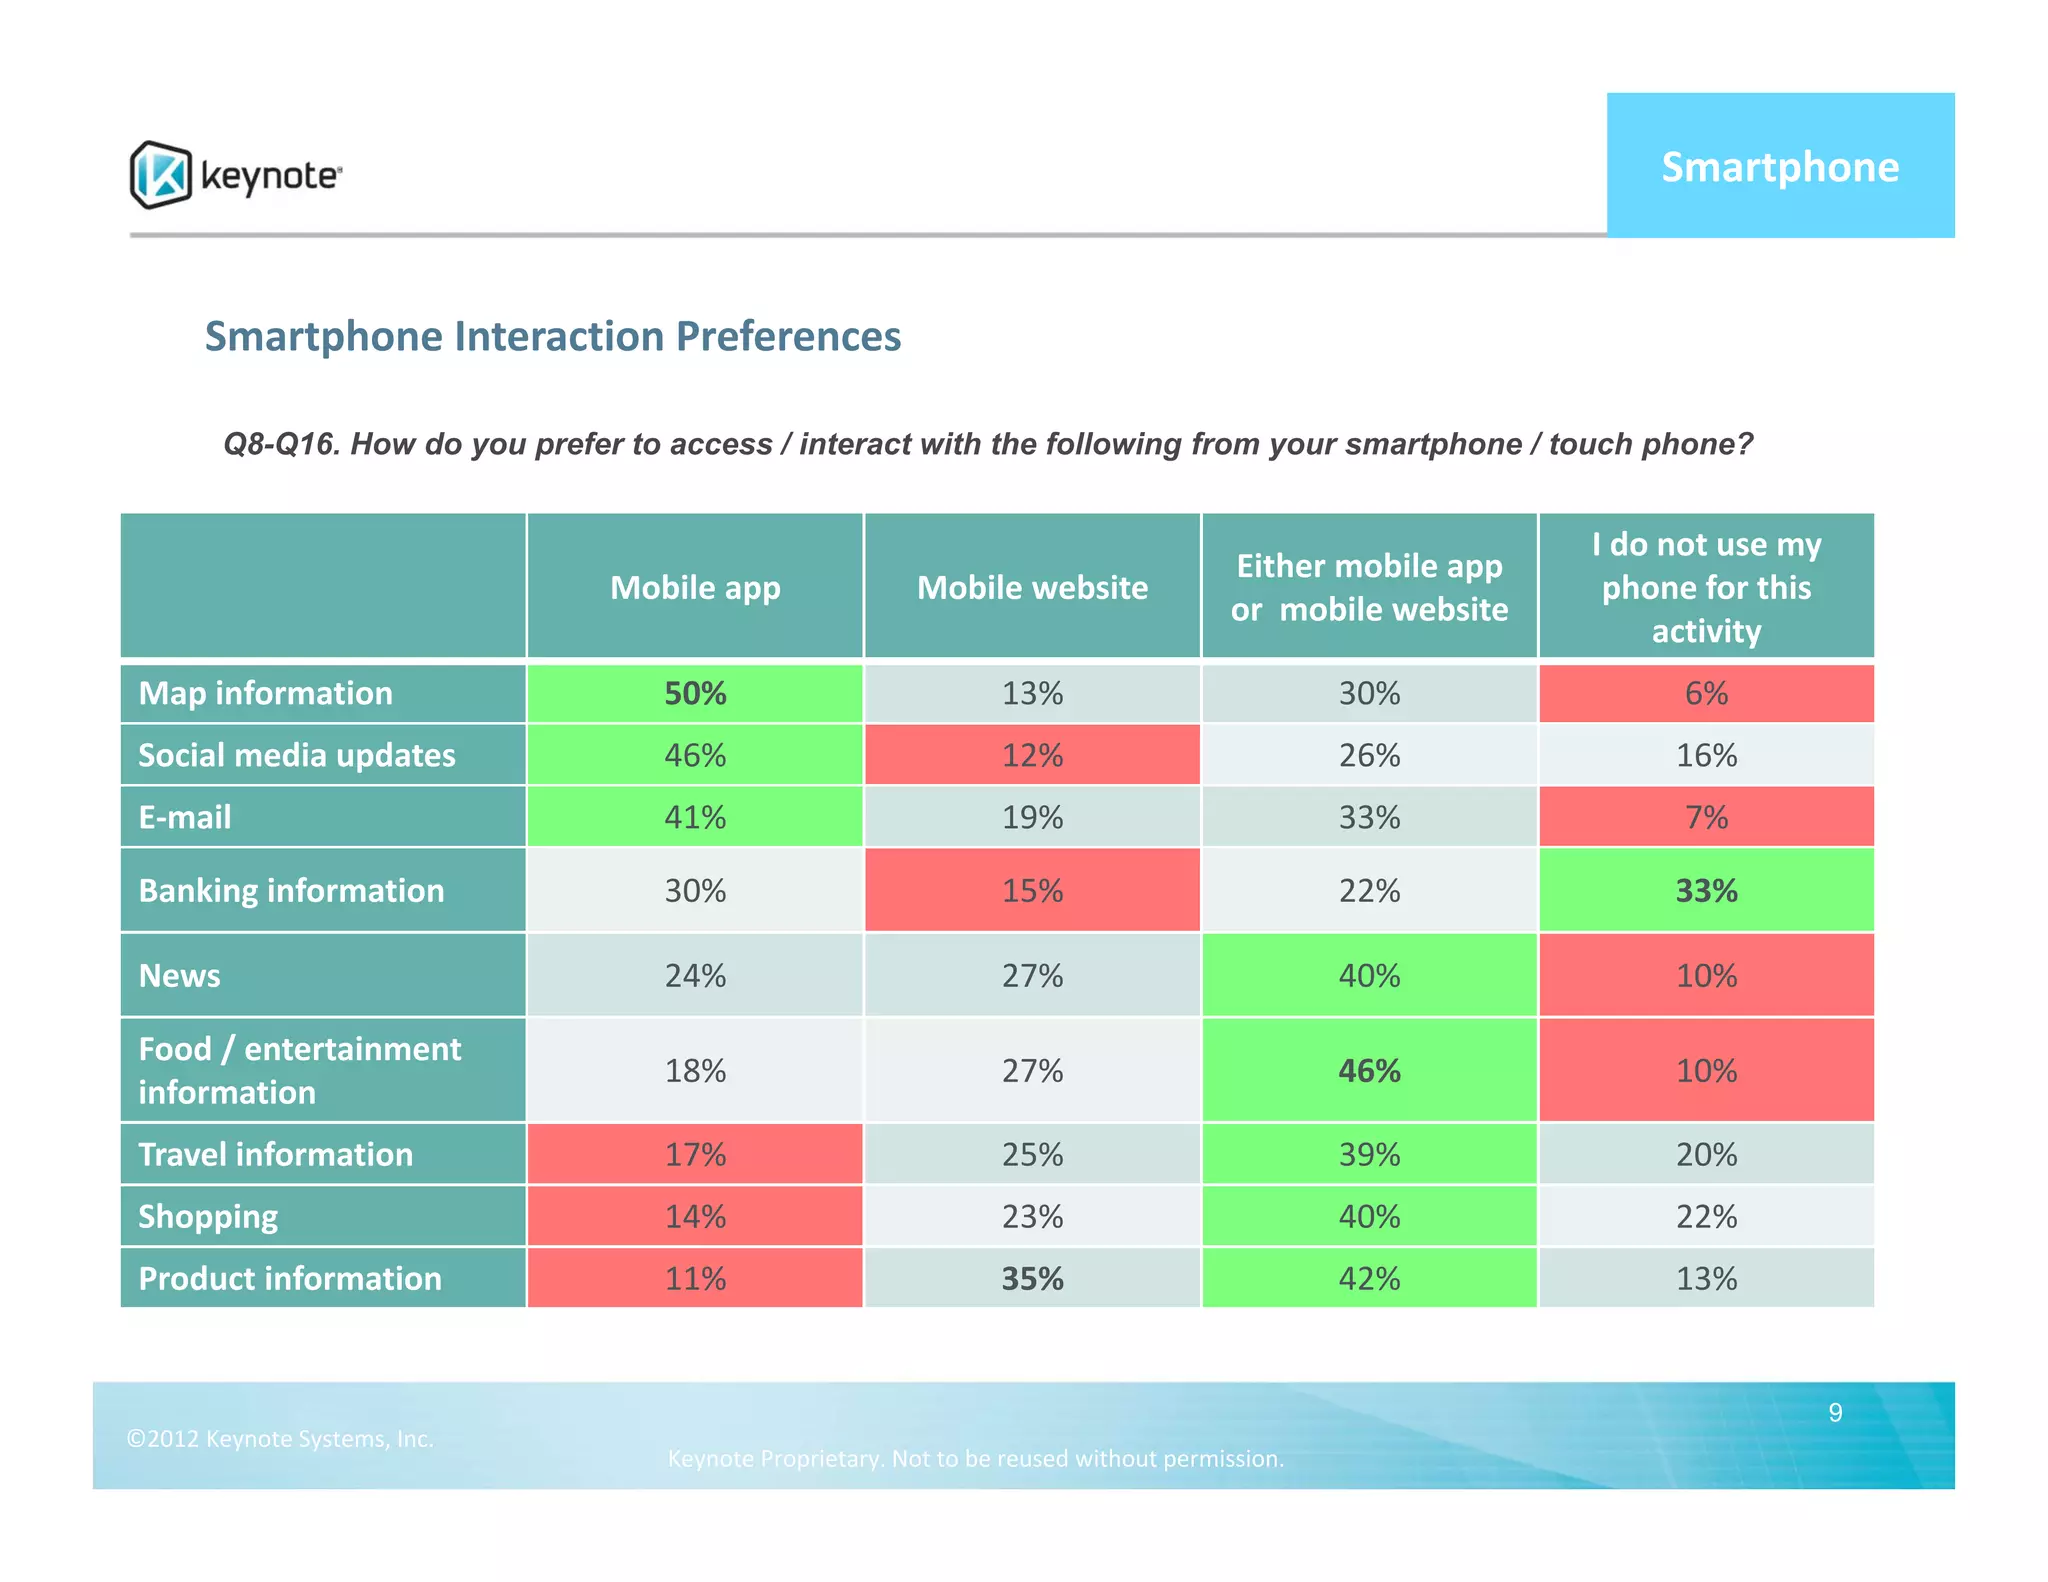
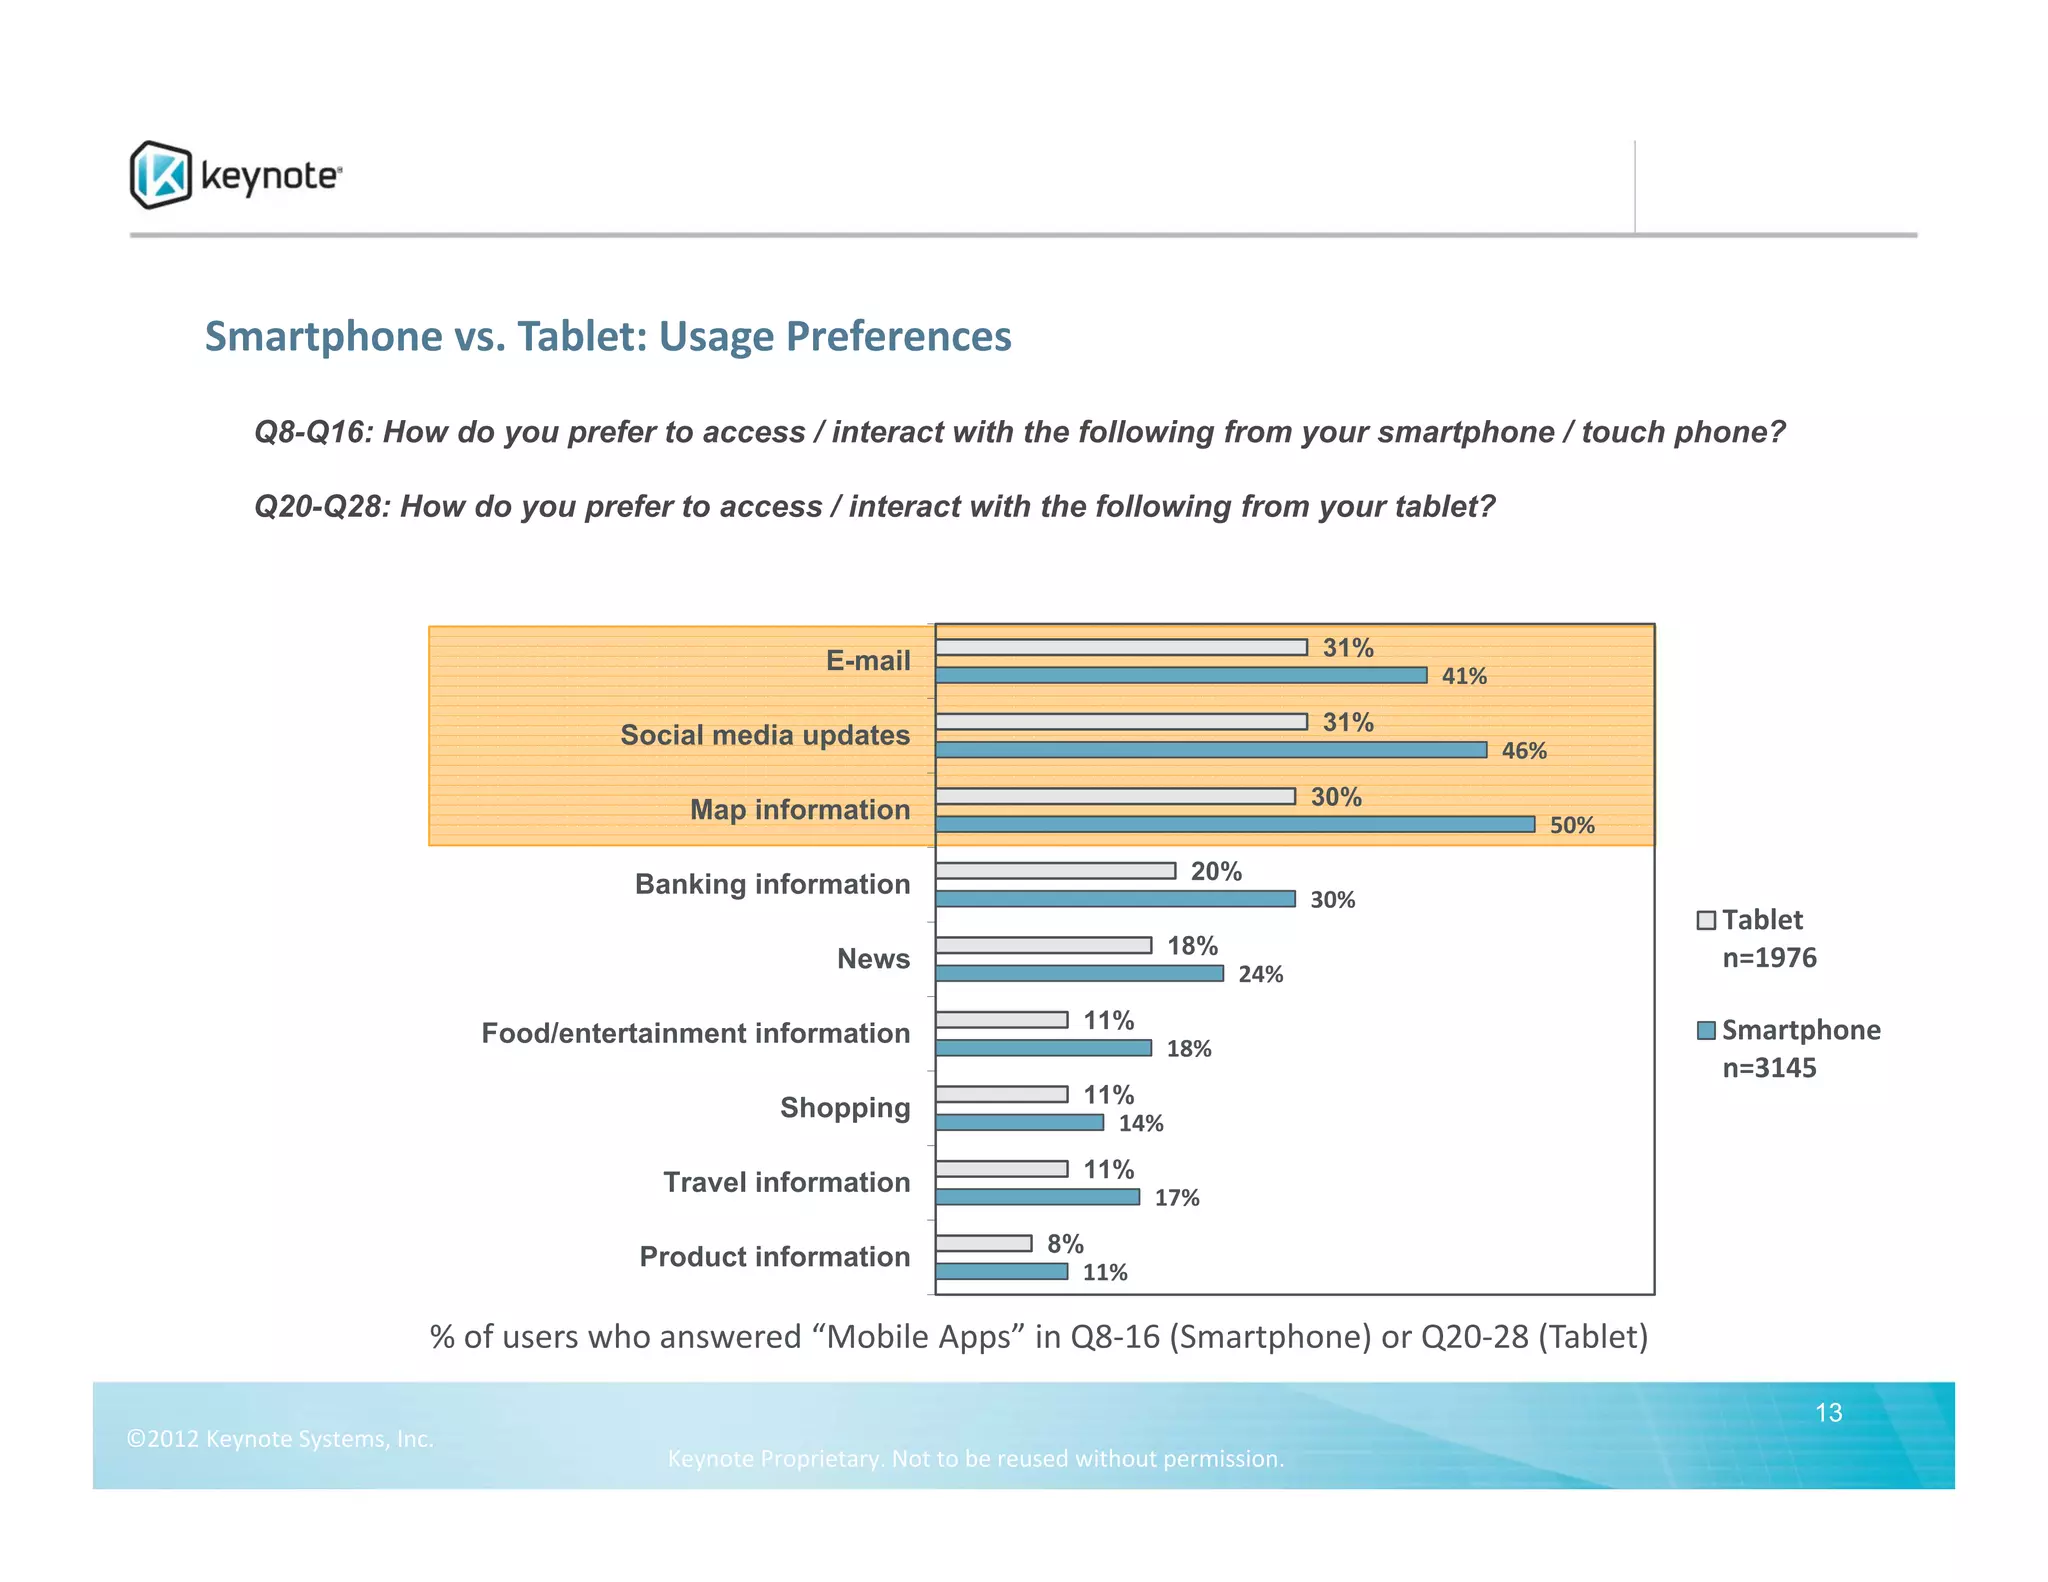
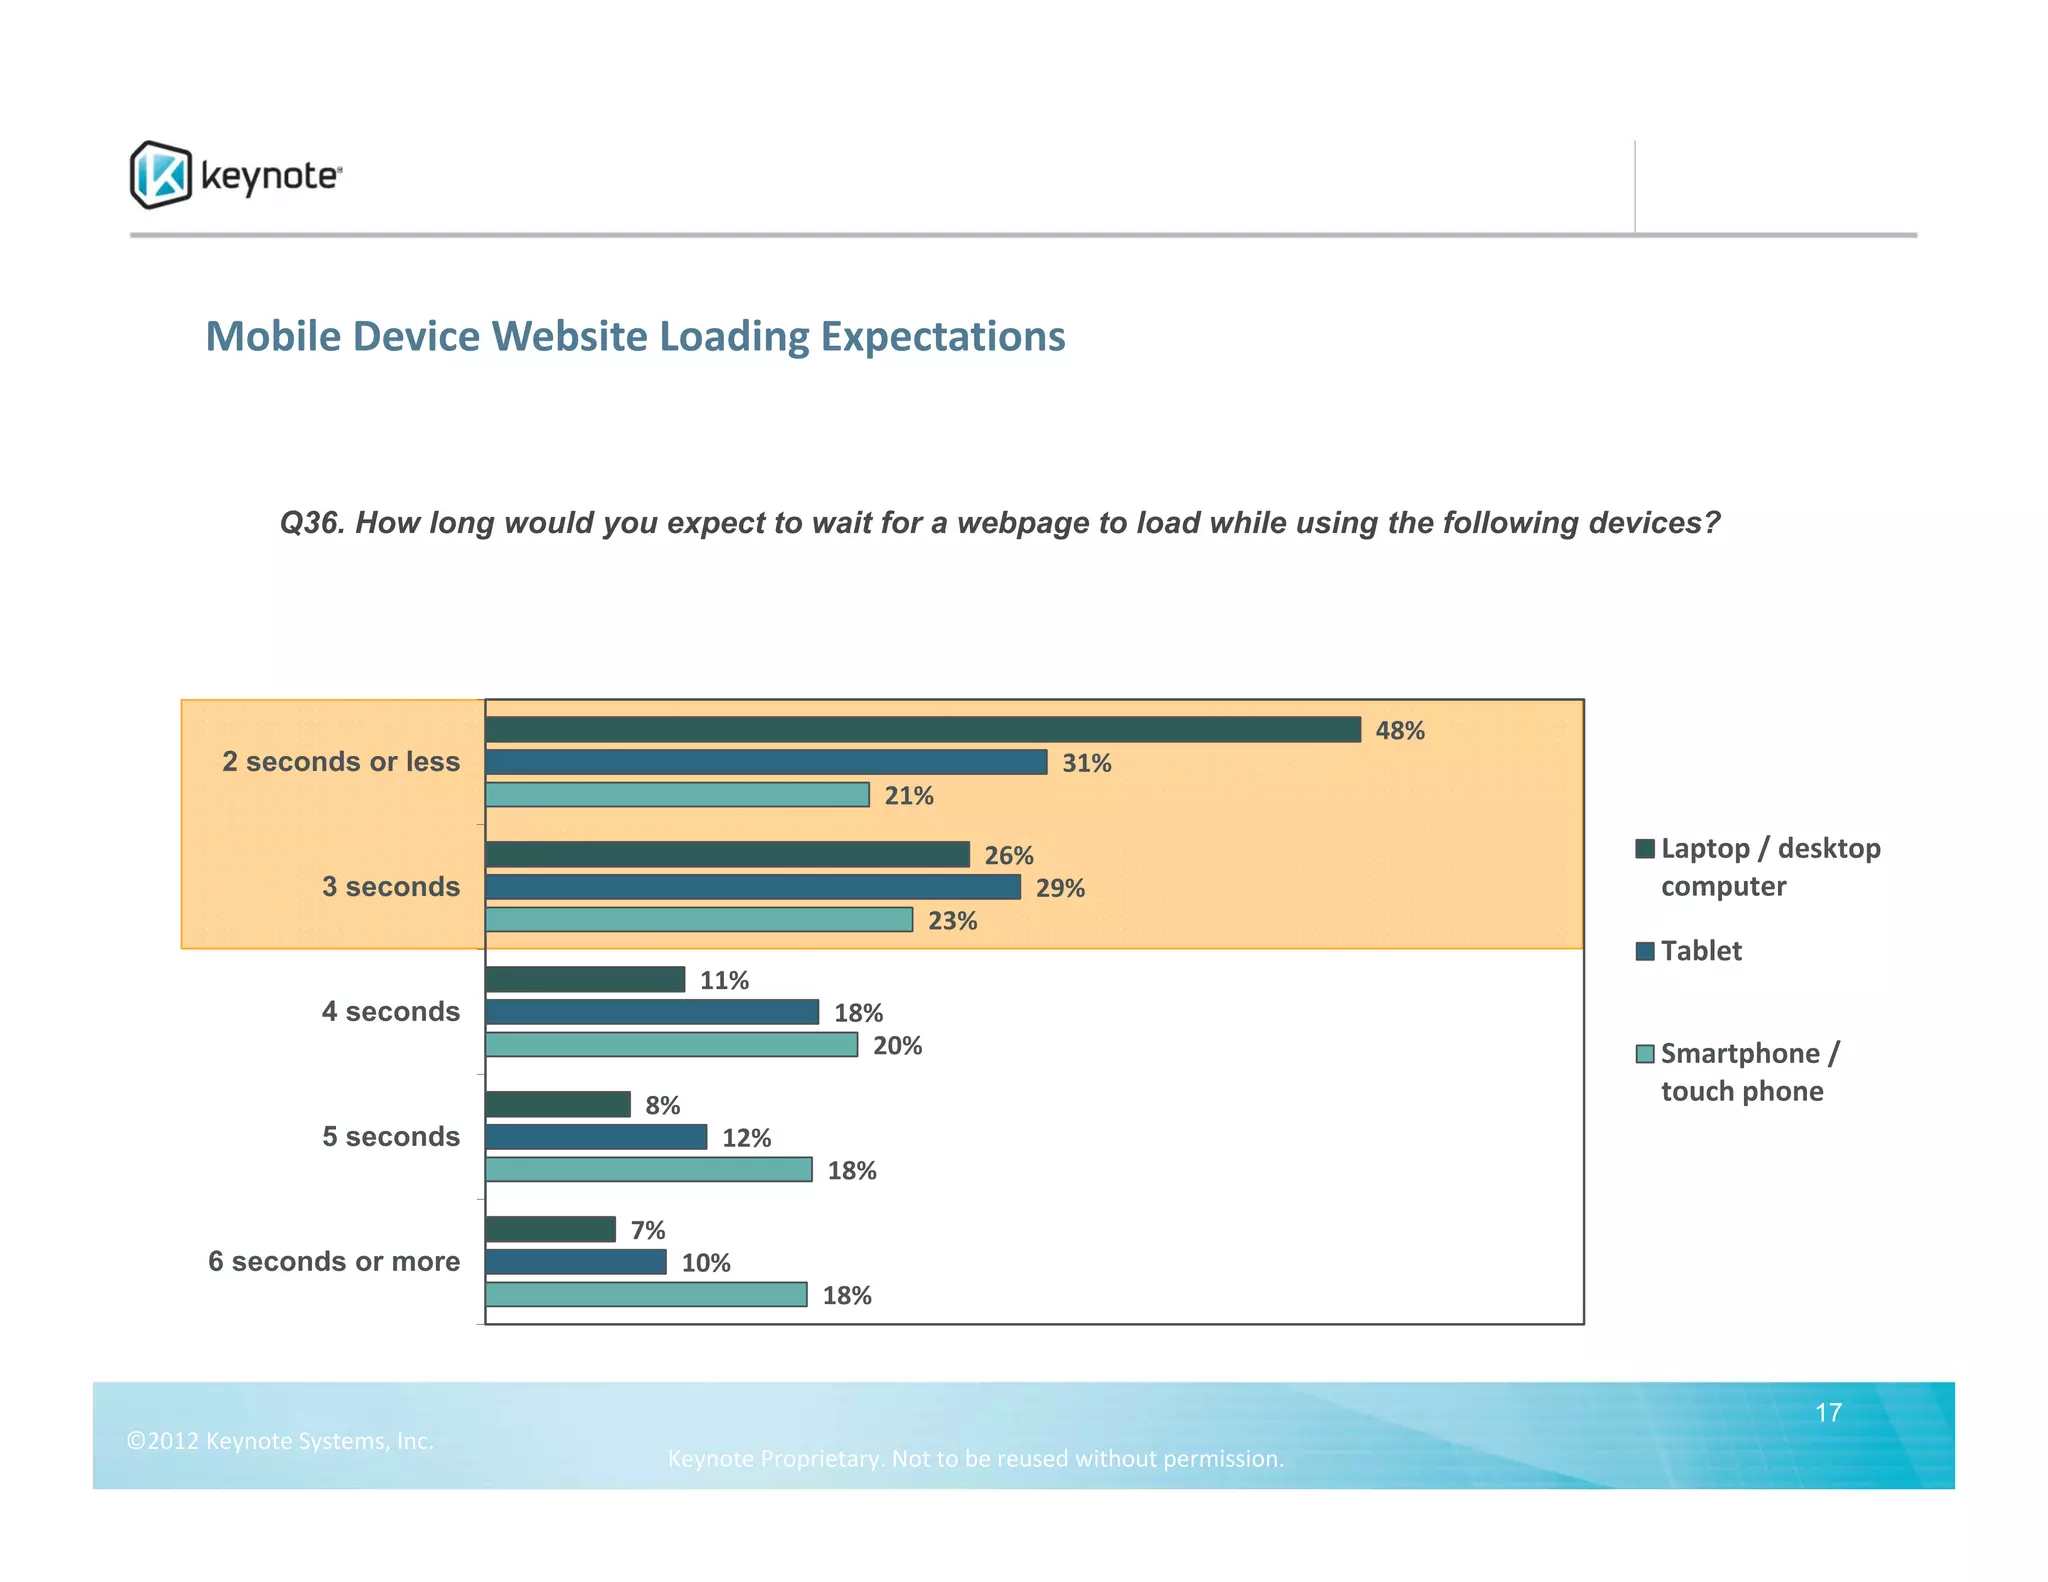
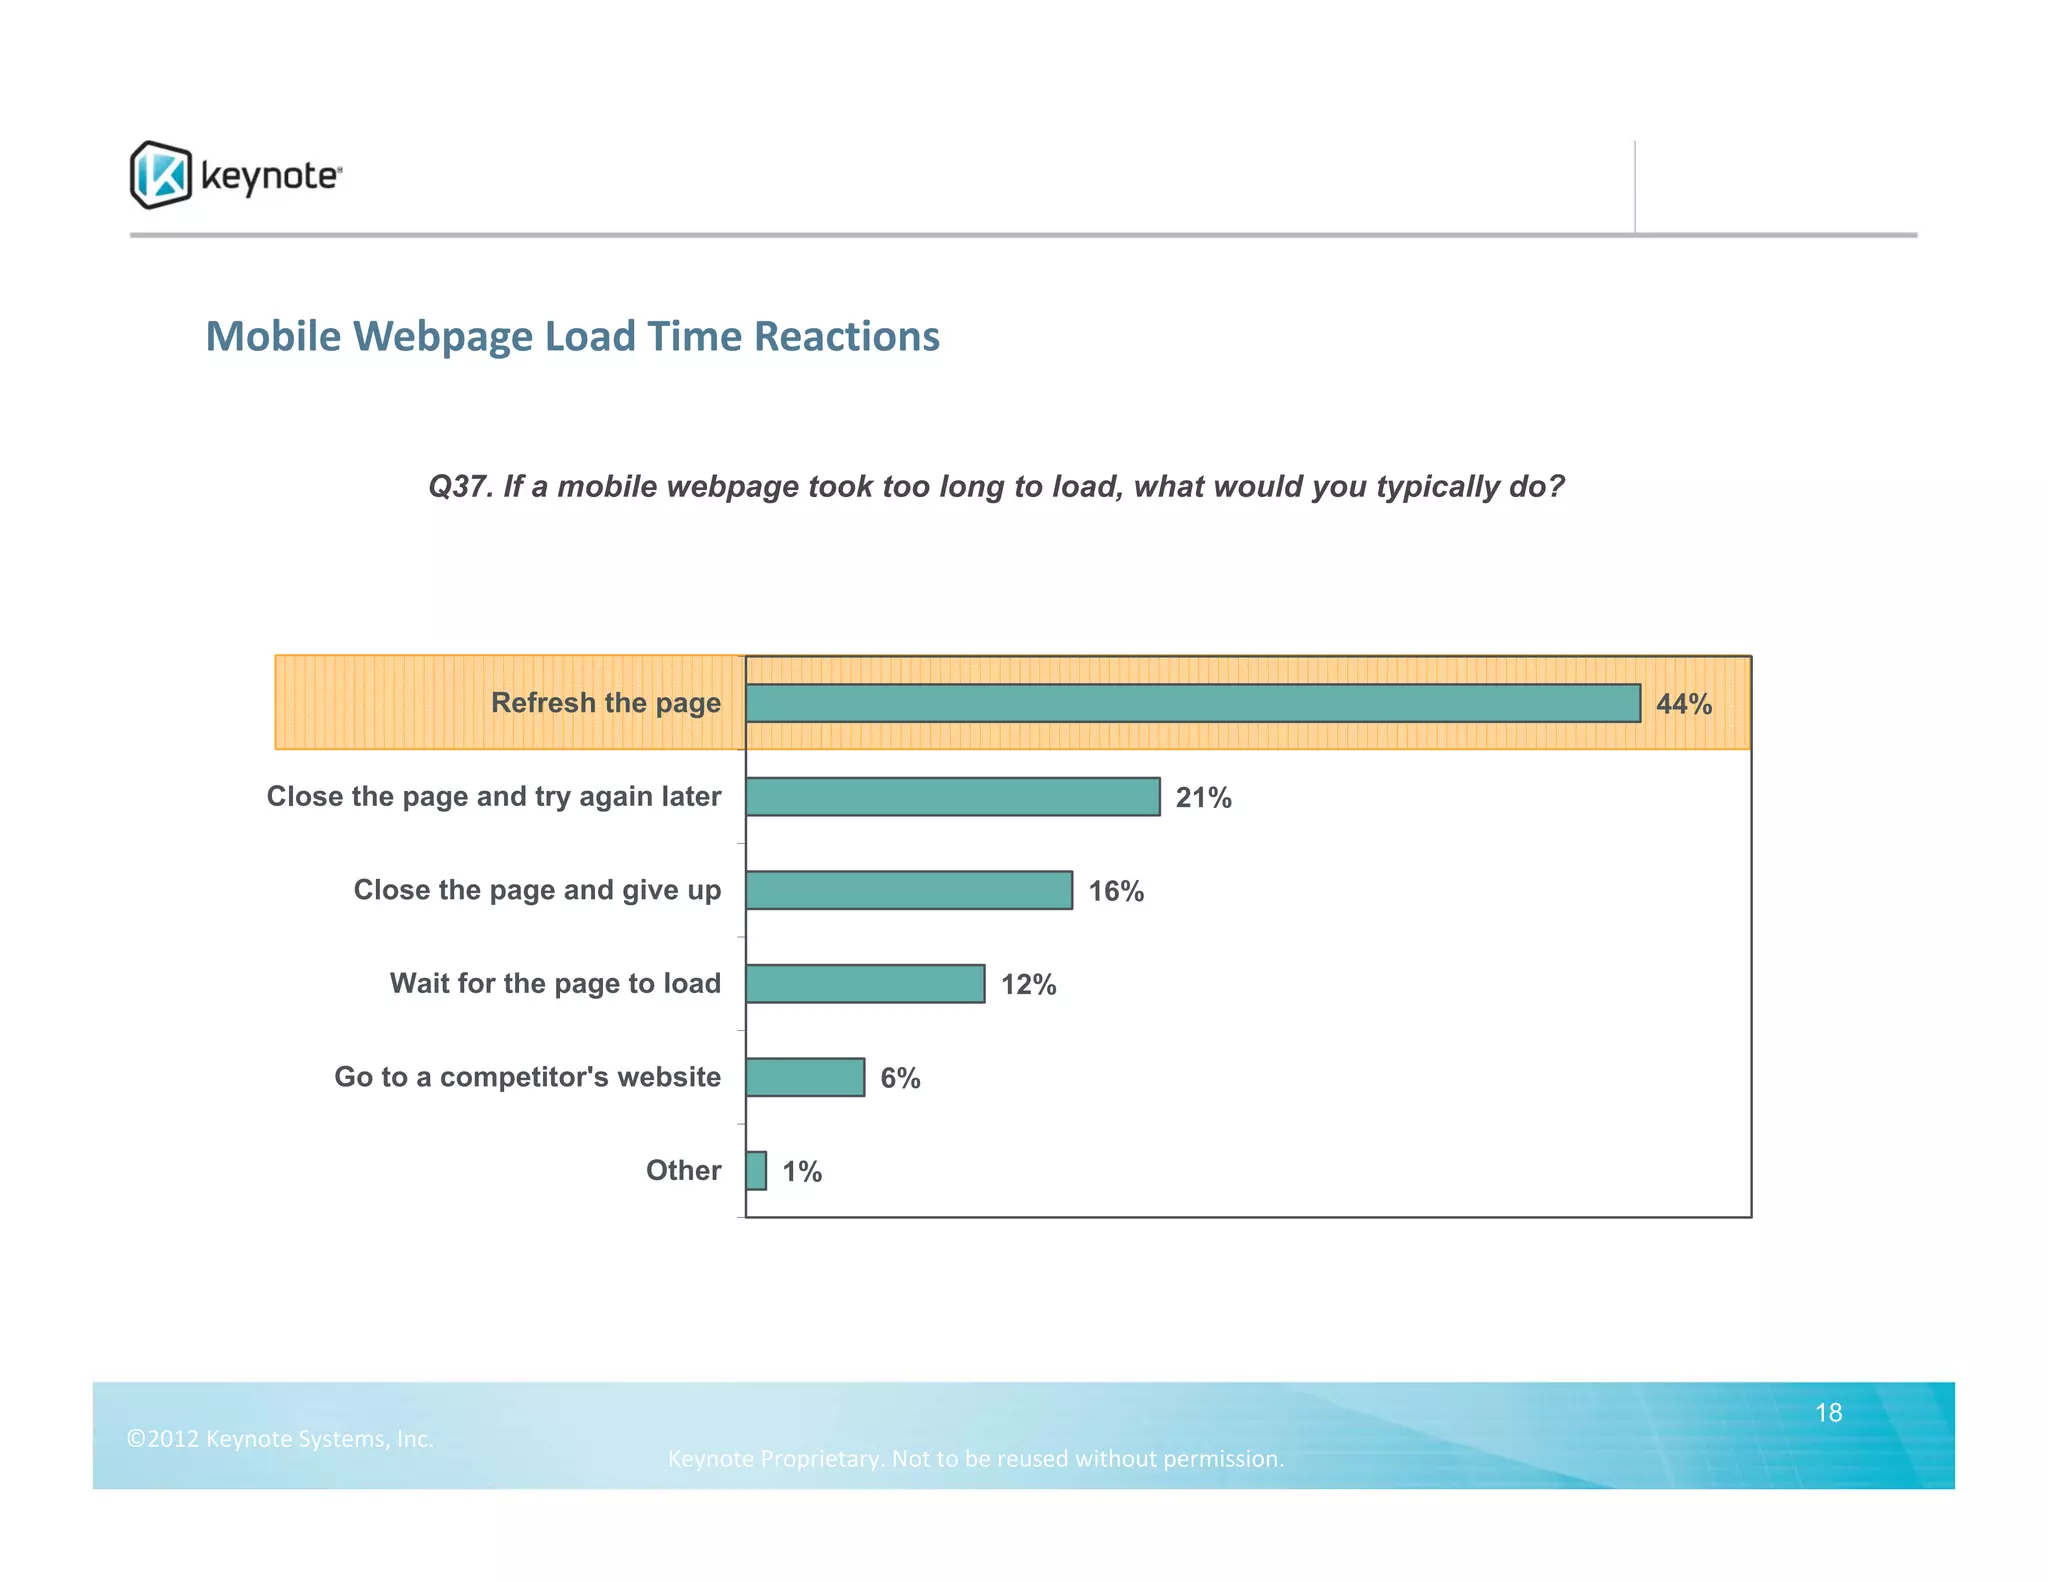
A 2012 survey of over 5,000 mobile device users explored usage patterns and preferences. For smartphones, Android was the most popular OS at 43% and top activities included accessing local information, searching online, and social media. Users preferred mobile apps over mobile websites for many tasks but preferred websites for news, entertainment, and shopping information. Two-thirds of users wanted sites to load within 4 seconds and slow loading was a top frustration.


