Download to read offline


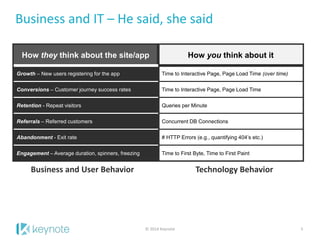
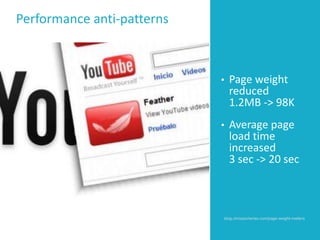
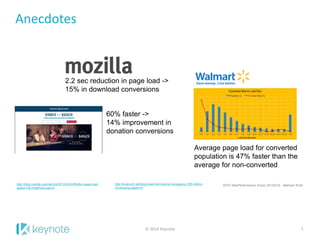
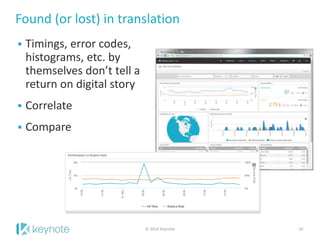
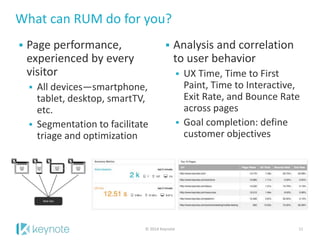


The document discusses the significance of web performance as a key performance indicator (KPI) and how real user monitoring (RUM) can provide insights into user behavior and business impact. It highlights the correlation between page load times and conversion rates, emphasizing that even minor improvements can lead to substantial revenue gains. The content also outlines the capabilities of RUM in facilitating performance analysis, metrics tracking, and user engagement across various digital channels.


![Real-World Performance Budgets [PerfNow 2022]](https://cdn.slidesharecdn.com/ss_thumbnails/2022-perfnow-performance-budgets-221027130426-9aa85c3a-thumbnail.jpg?width=640&height=640&fit=bounds)


